Indicator Charts
Every chart investors need to know
Also published on EllTec Analysis Read it there
In the financial markets there are plenty of charts that can be used as an indicator. EllTec Analysis filters every important chart investors need to know in EllTec Analysis opinion.
Stock market indices
USA
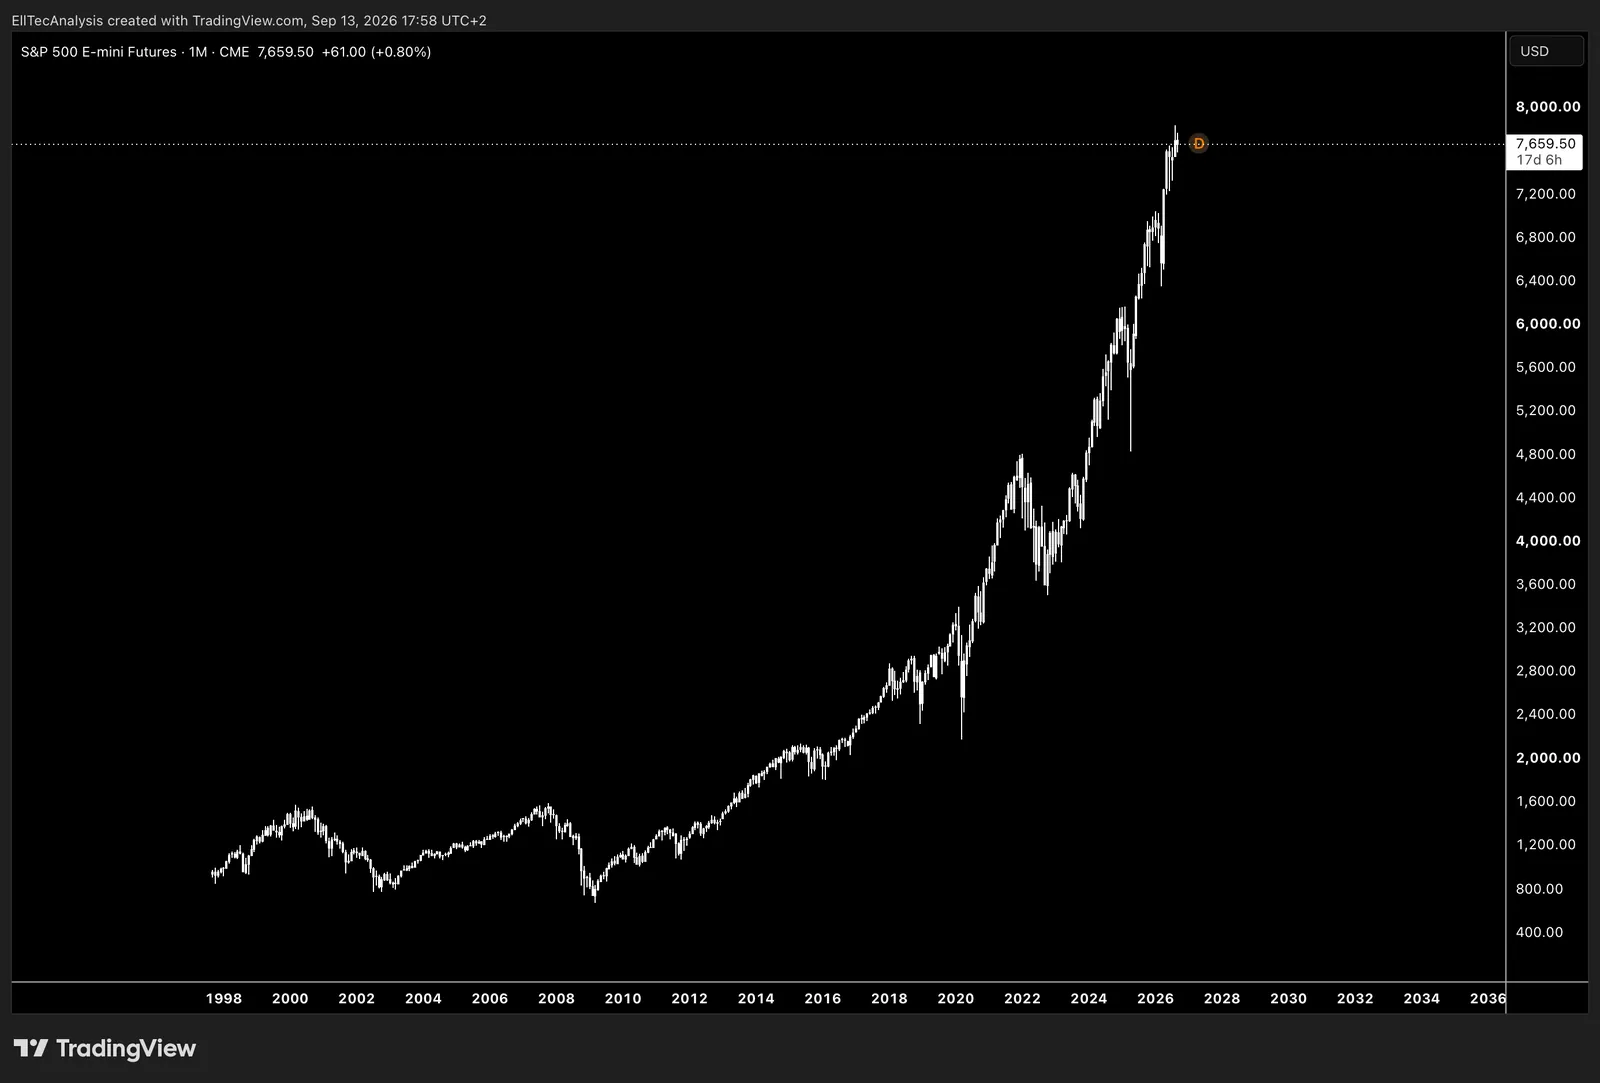
Most common US stock market index including 500 stocks.
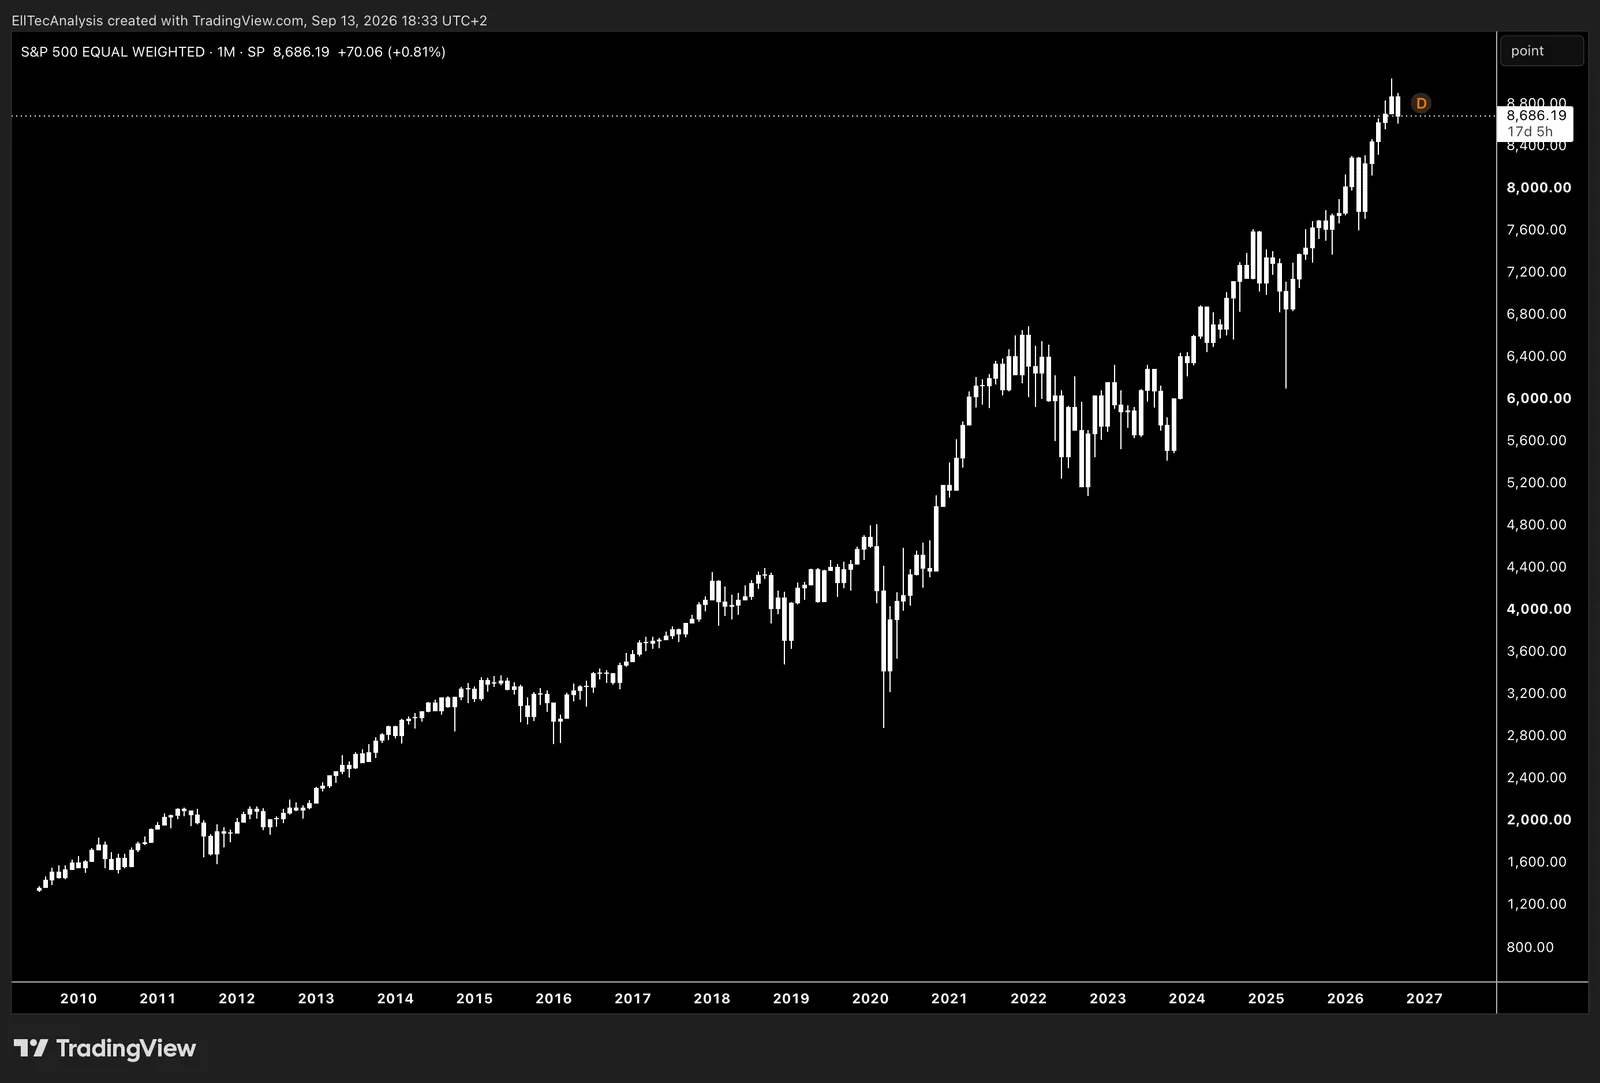
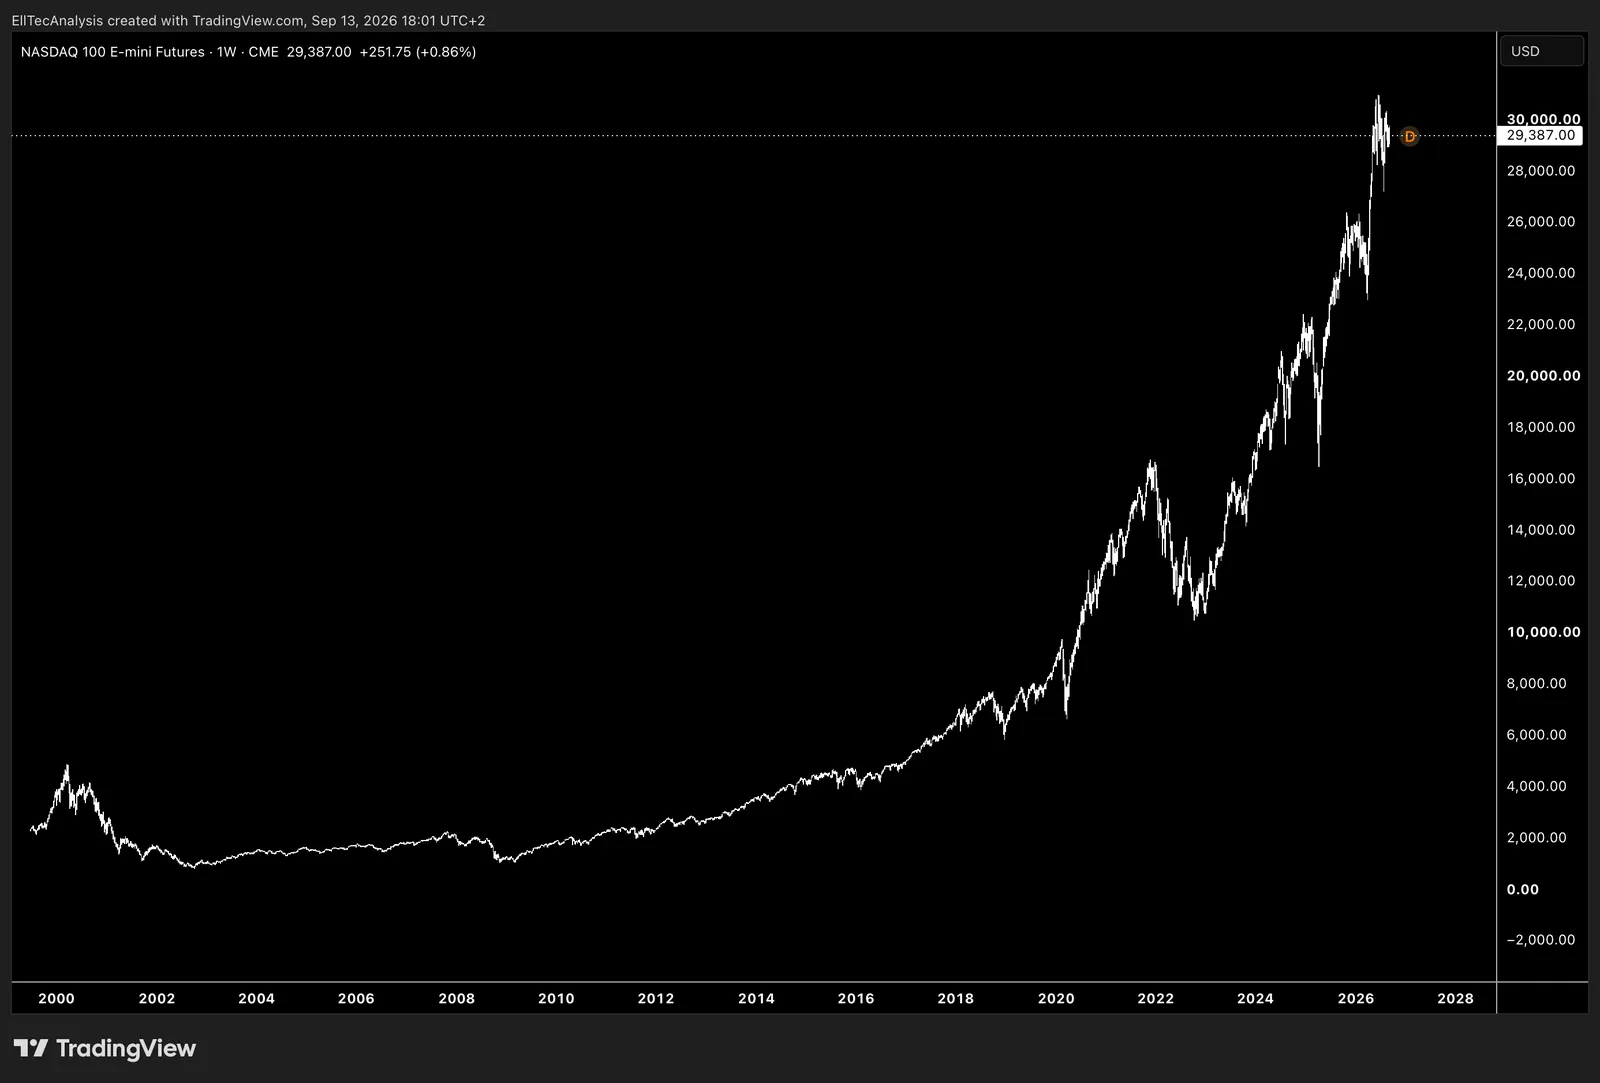
Most common technology index for the US including 100 stocks.
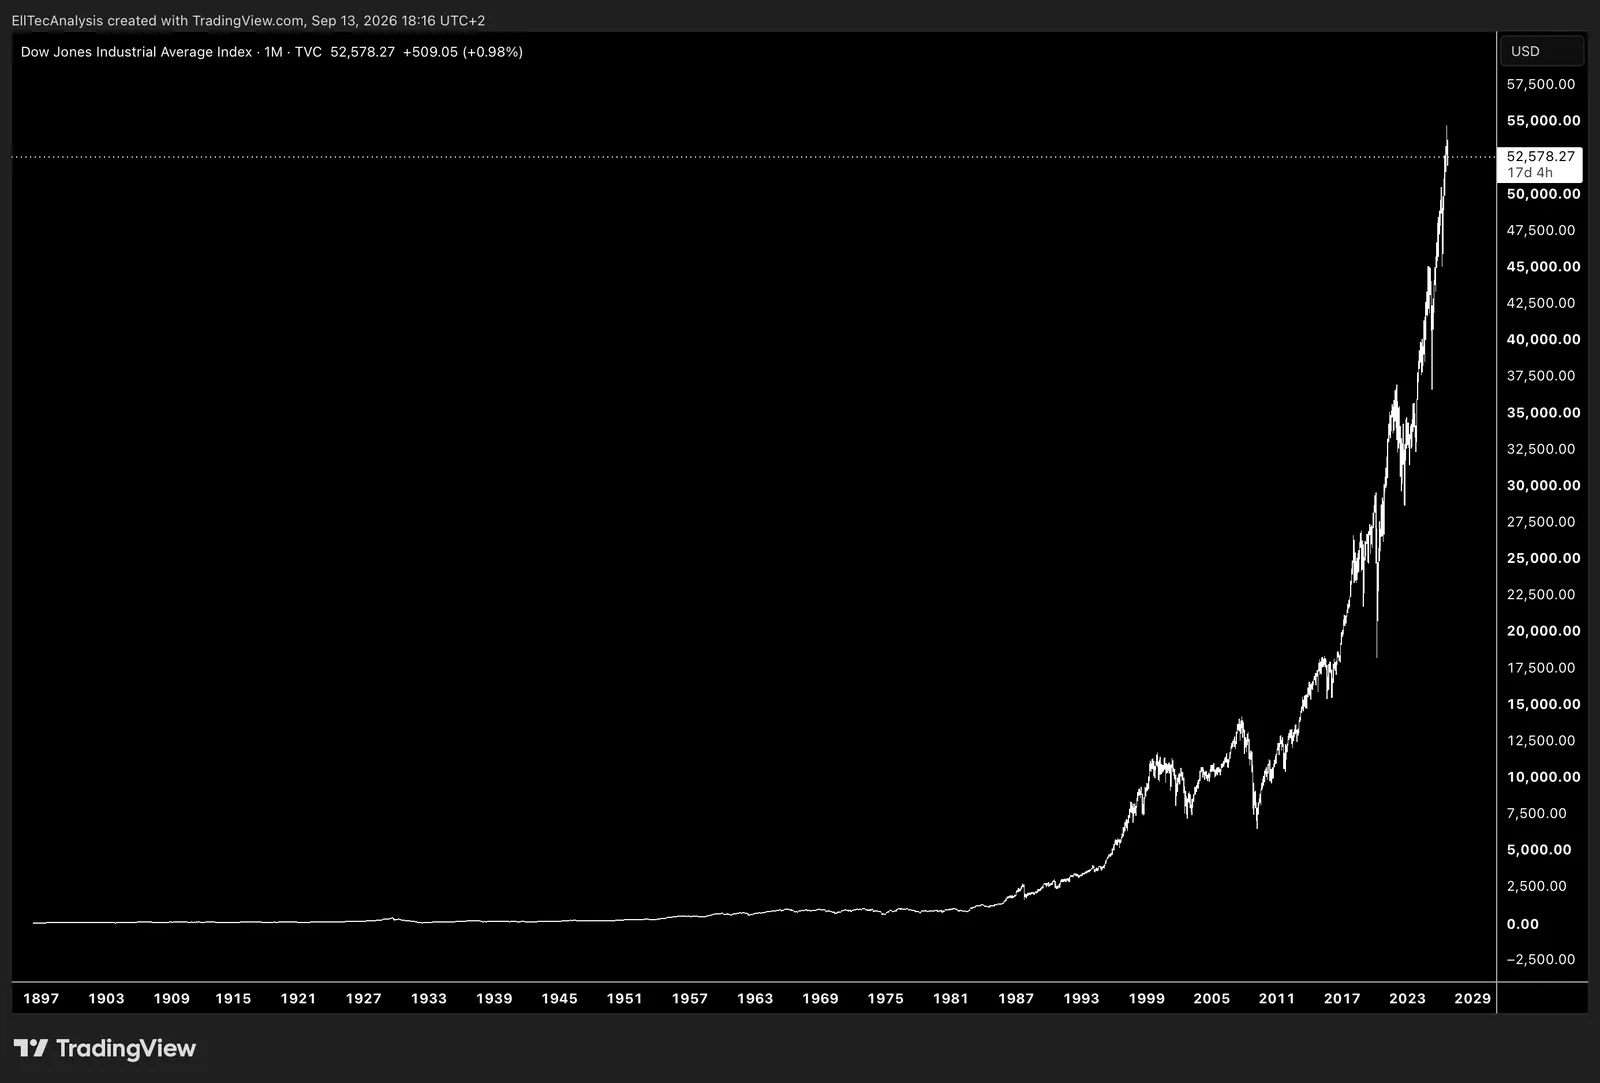
Price-weighted US stock index tracking the top 30 blue-chip companies.
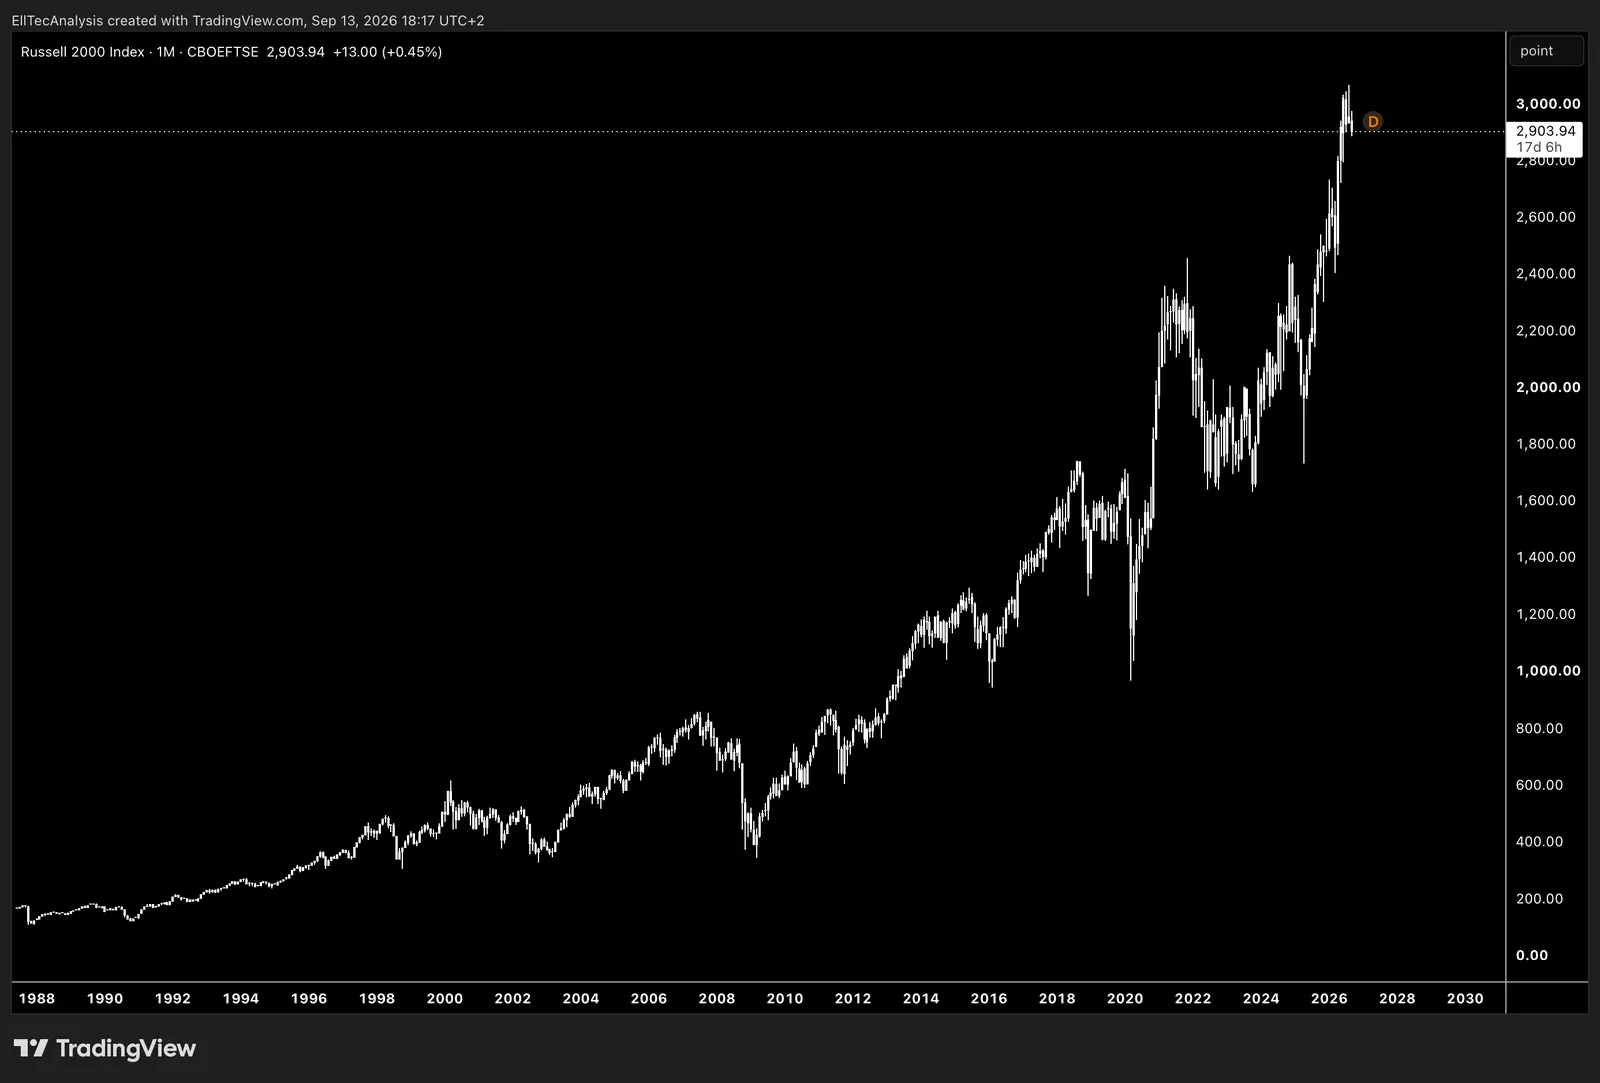
US small-cap index tracking 2000 of the smallest US publicly traded companies.
World
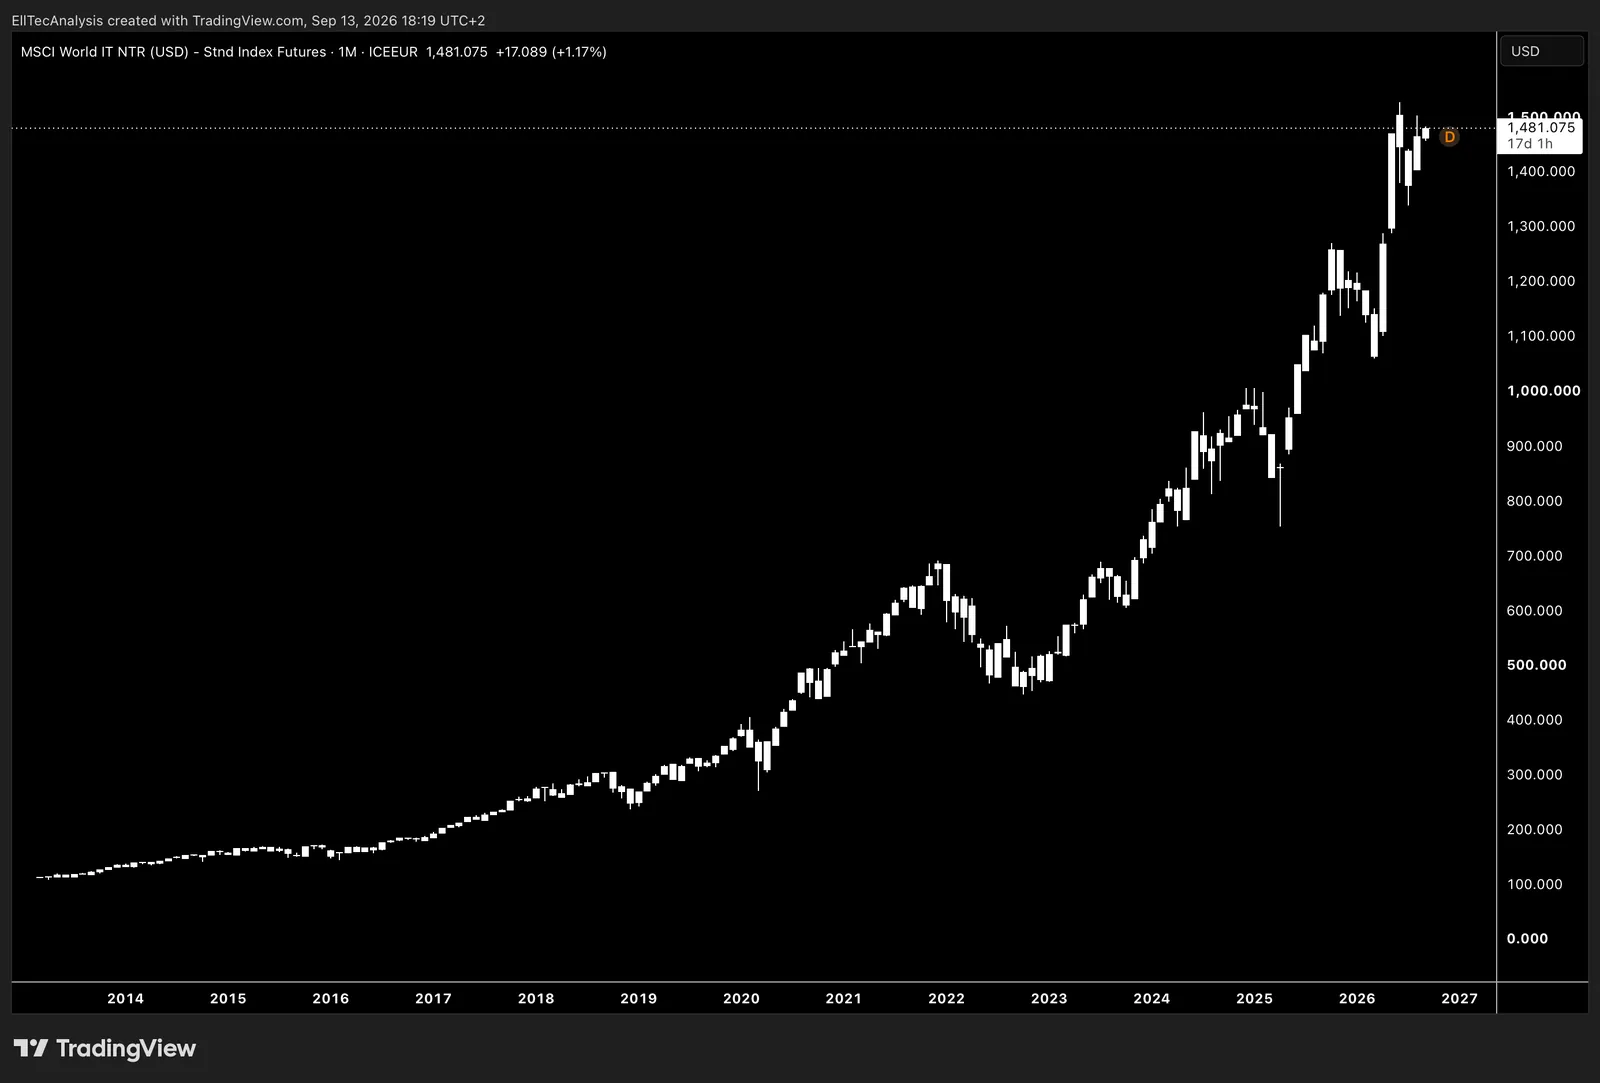
Market-weighted index covering large and mid-cap stocks from 23 developed countries.
Emerging Markets
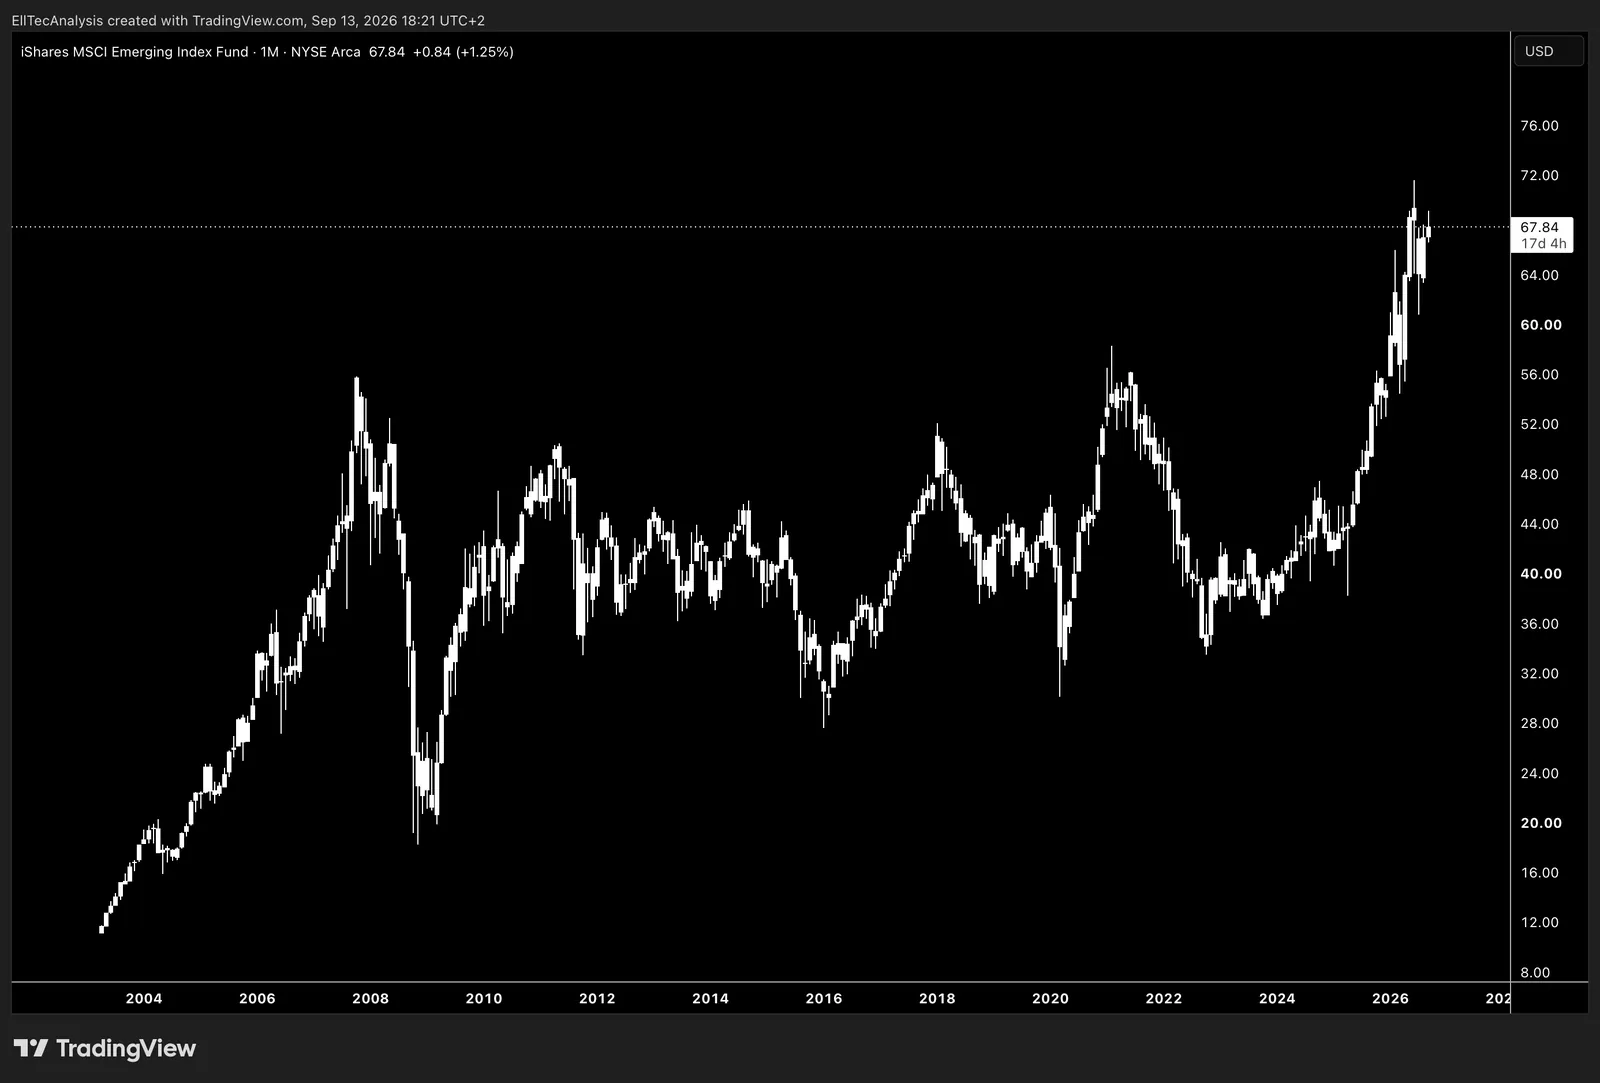
Market weighted index covering large and mid-cap stocks from 24 emerging economies.
Europe
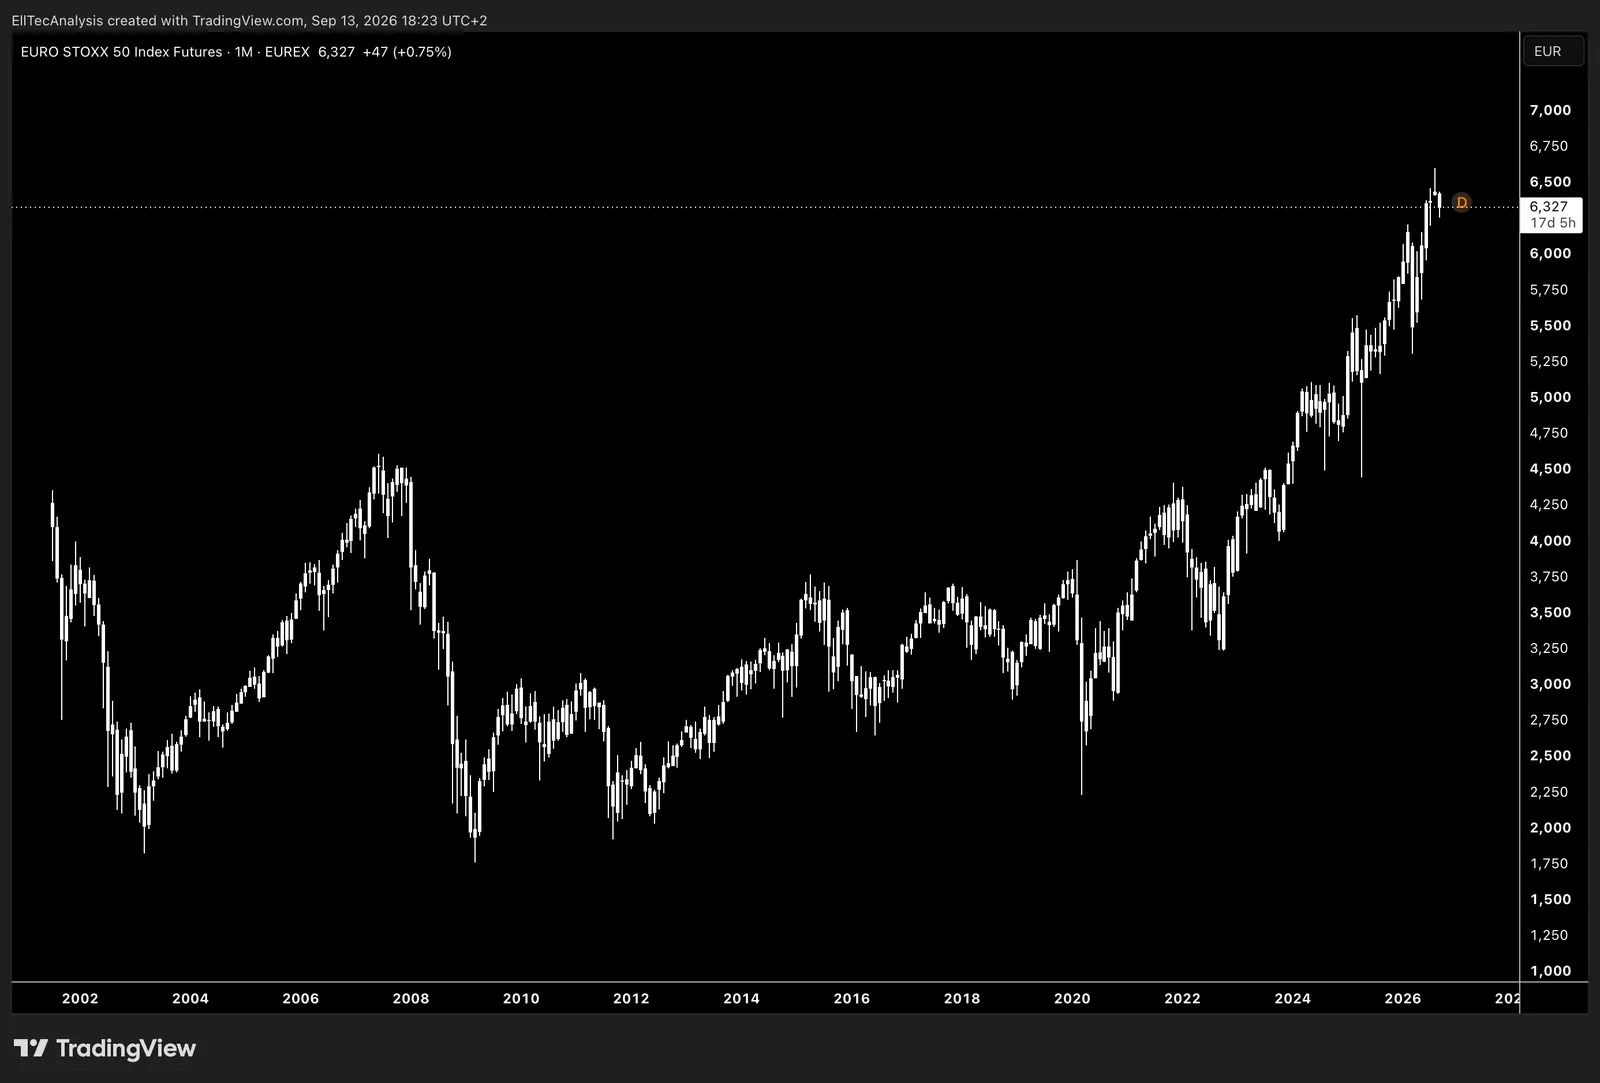
Market-cap-weighted index of 50 leading blue-chip companies from the Eurozone.
Germany
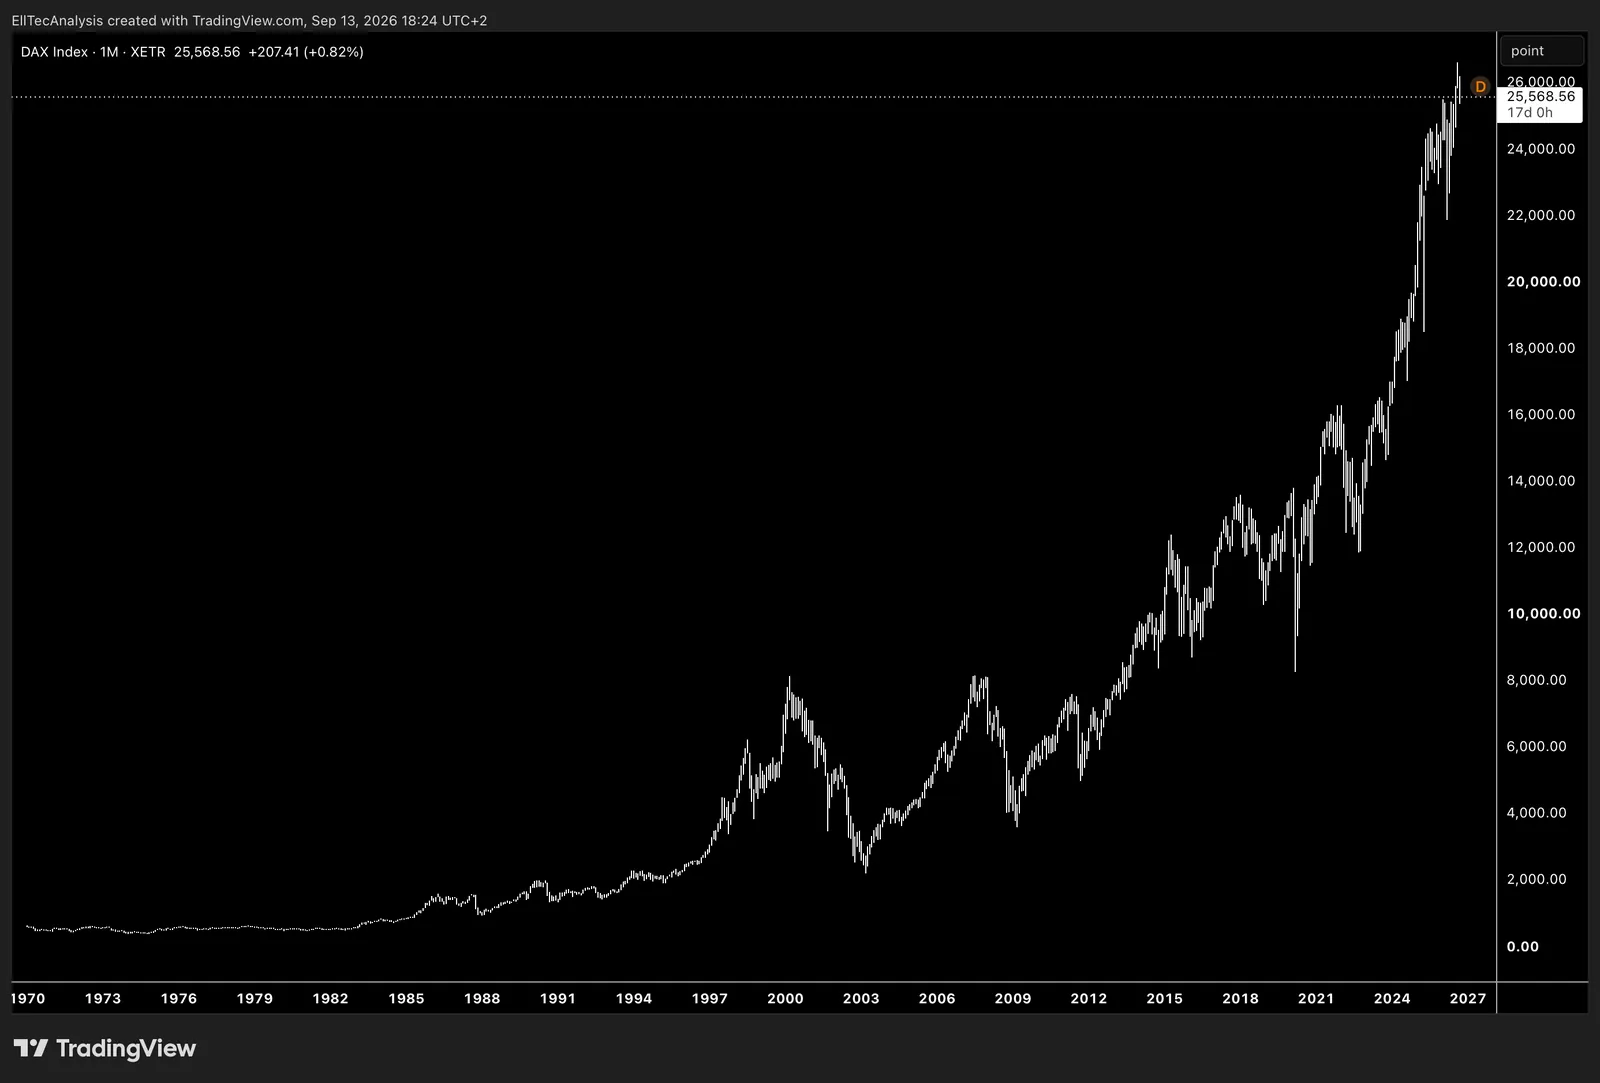
Market-cap weighted index of 40 major blue-chip companies listed in Germany.
Japan
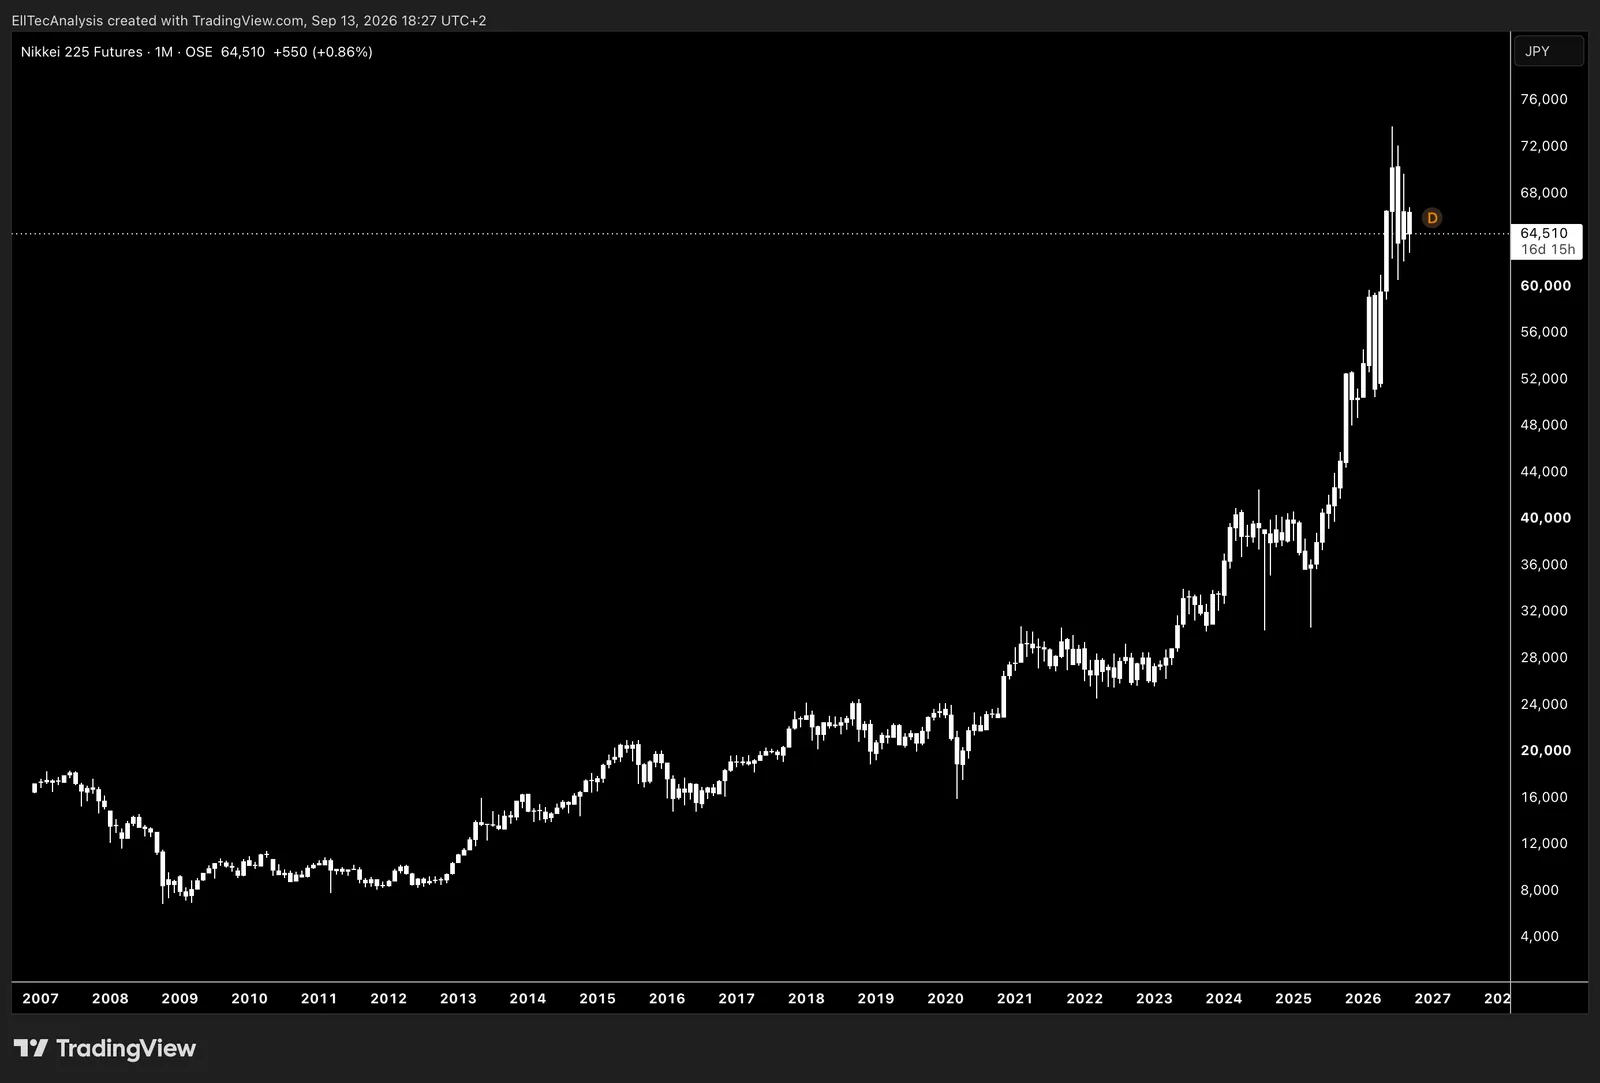
Price-weighted index of 225 Japanese companies listed on the Tokyo Stock Exchange.
China
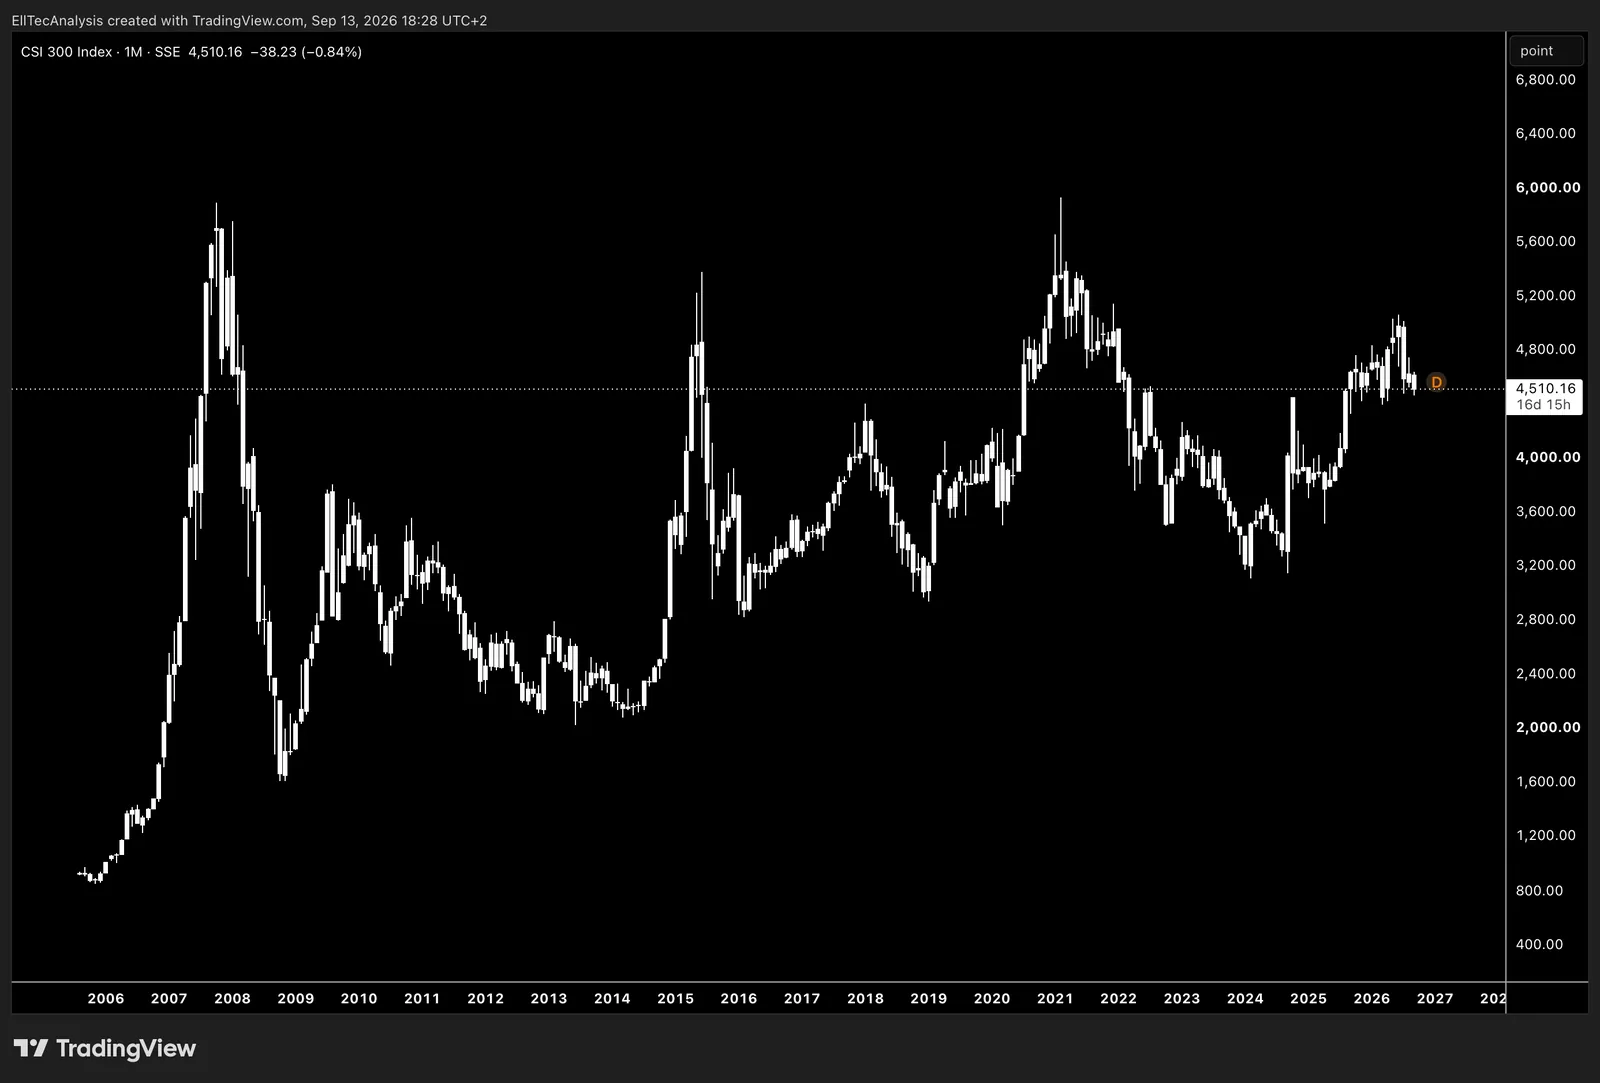
Market cap-weighted index tracking 300 large and liquid companies from the Shanghai and Shenzhen exchanges.
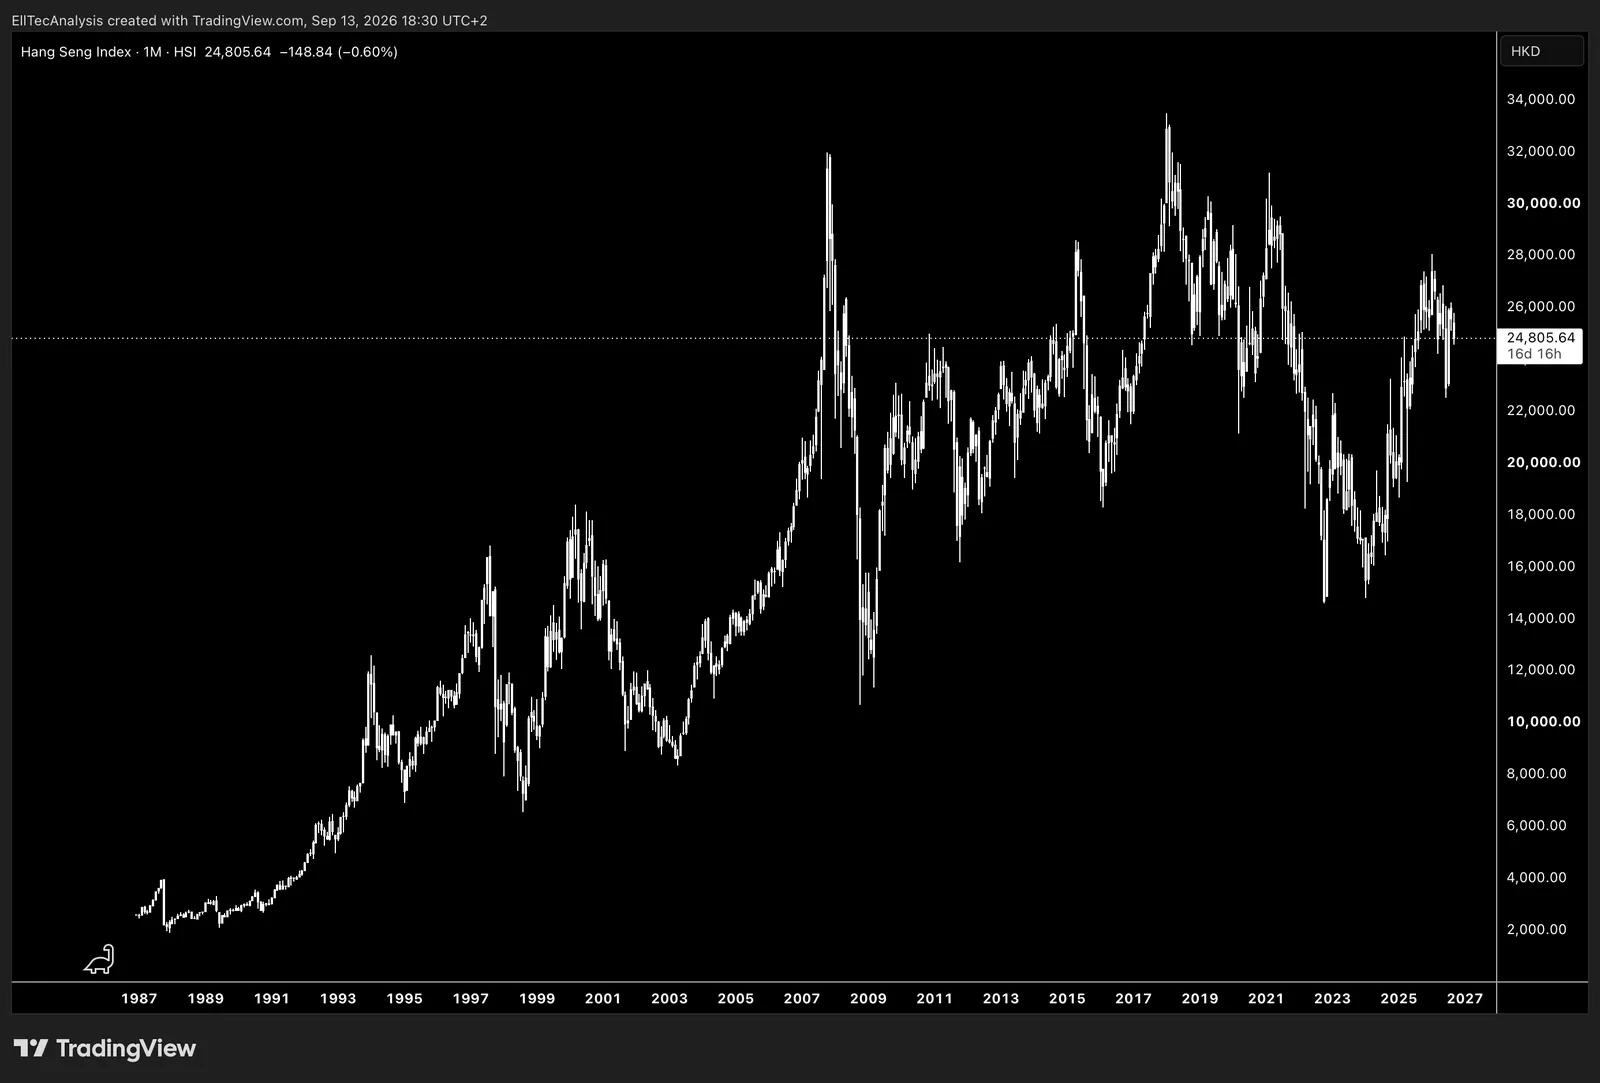
Free-float-weighted benchmark tracking 50 major companies listed in Hong Kong.
Great Britain
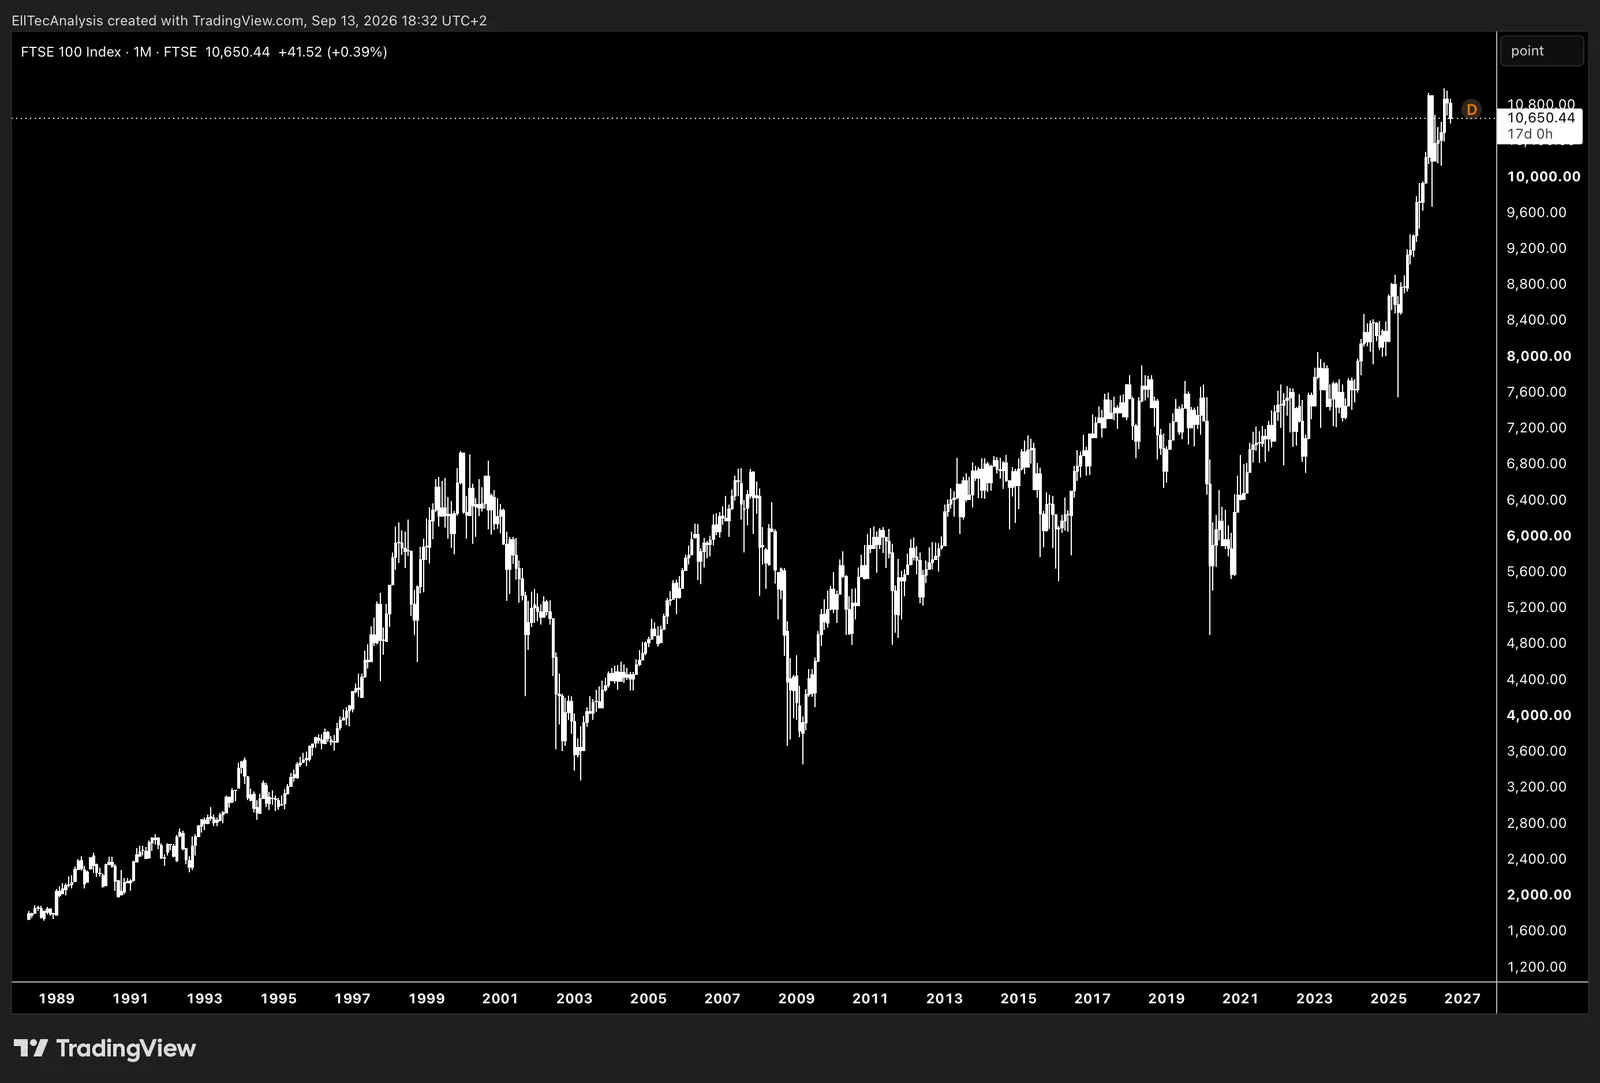
Free-float-weighted index of the largest companies listed on the London Stock Exchange.
Africa
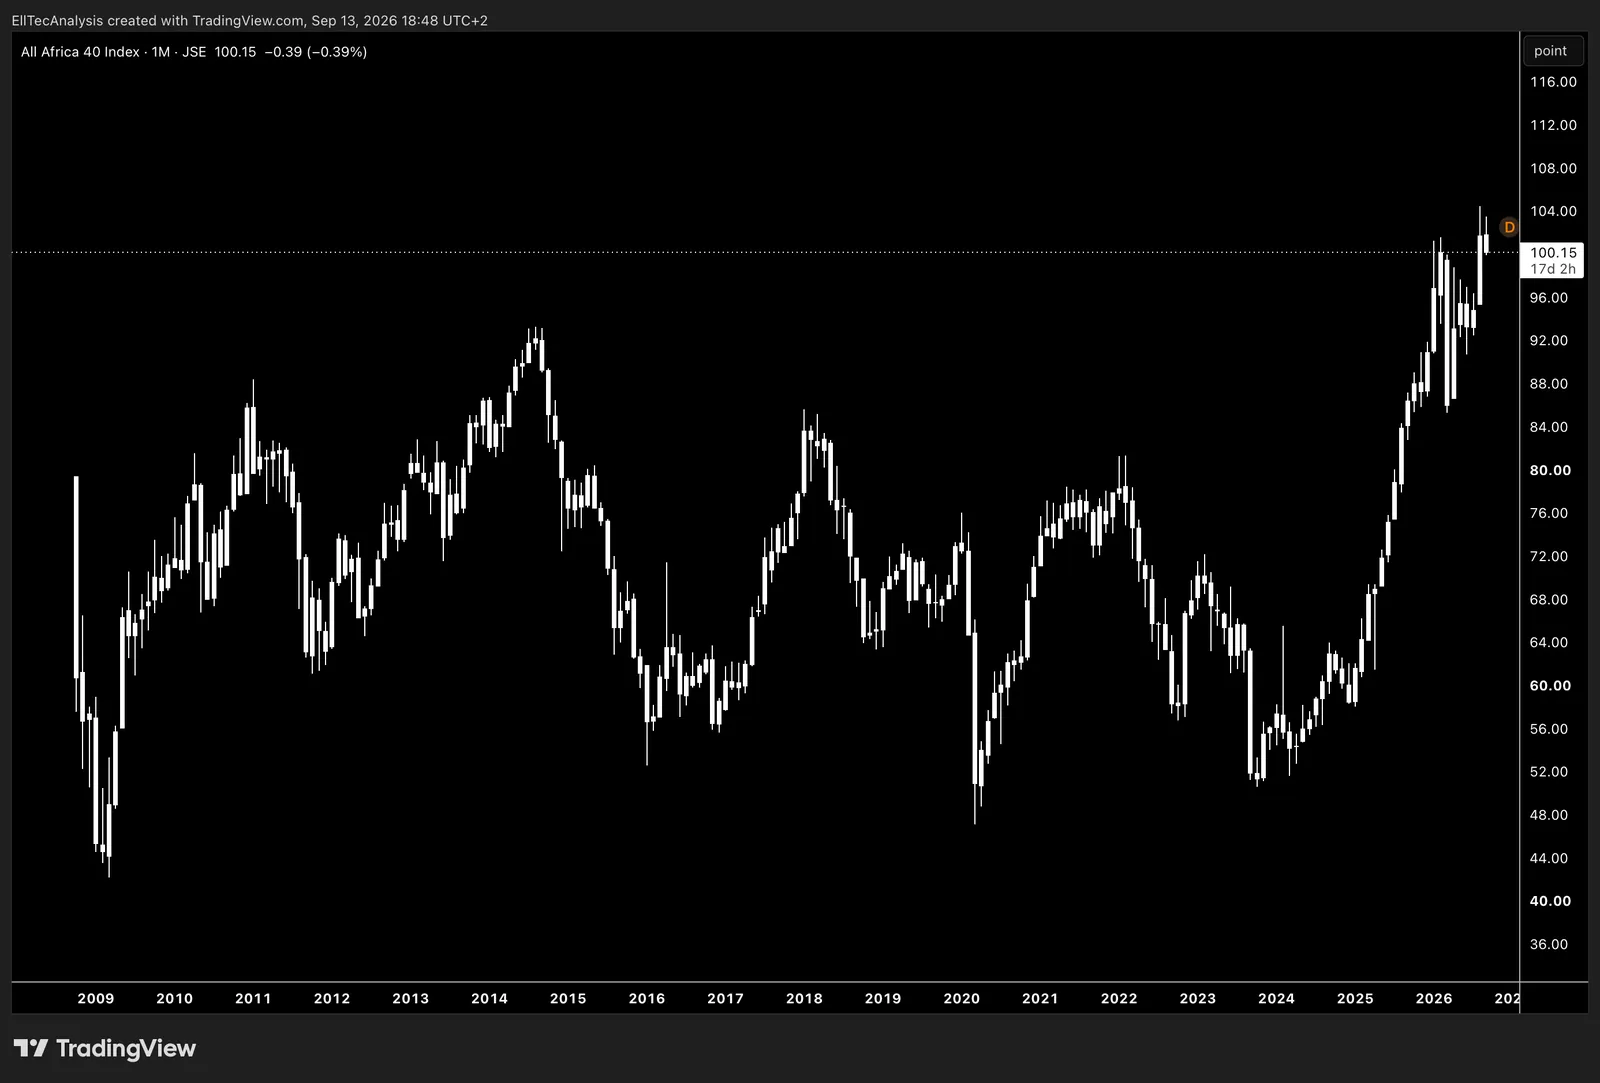
Free-float-weighted index tracking 40 of the largest and most liquid companies across major African markets.
Asia
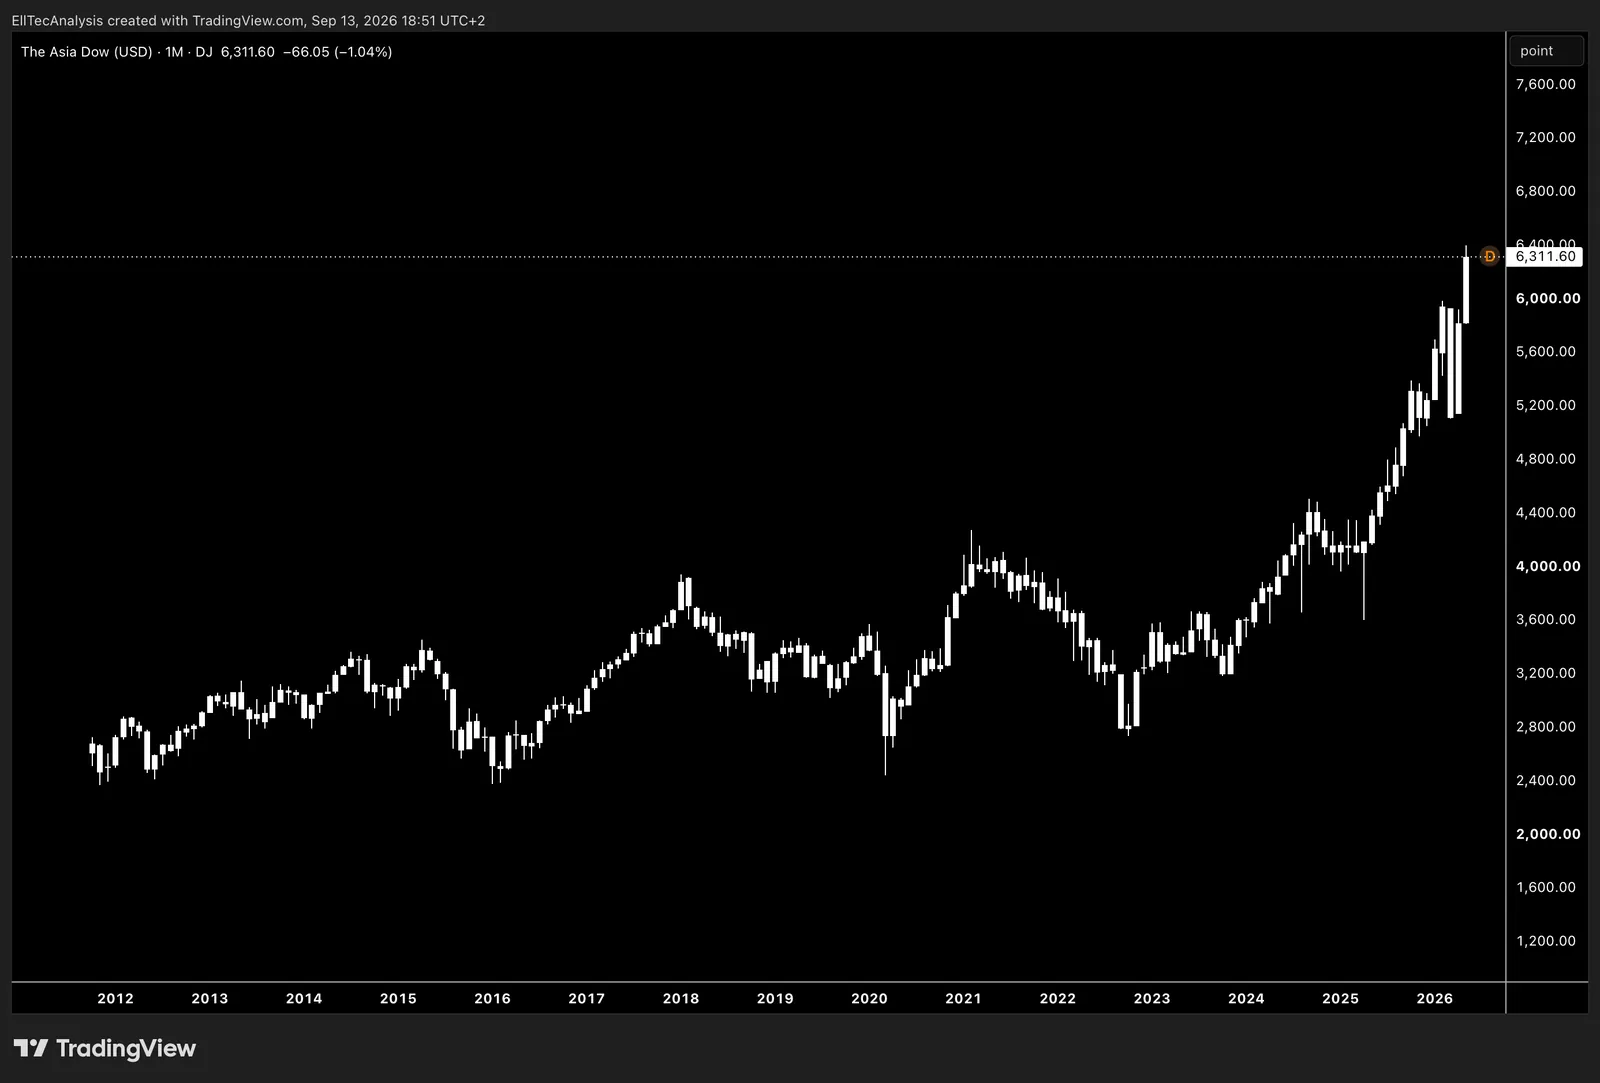
Regional index tracking major blue-chip companies across key Asia-Pacific markets.
Latin America
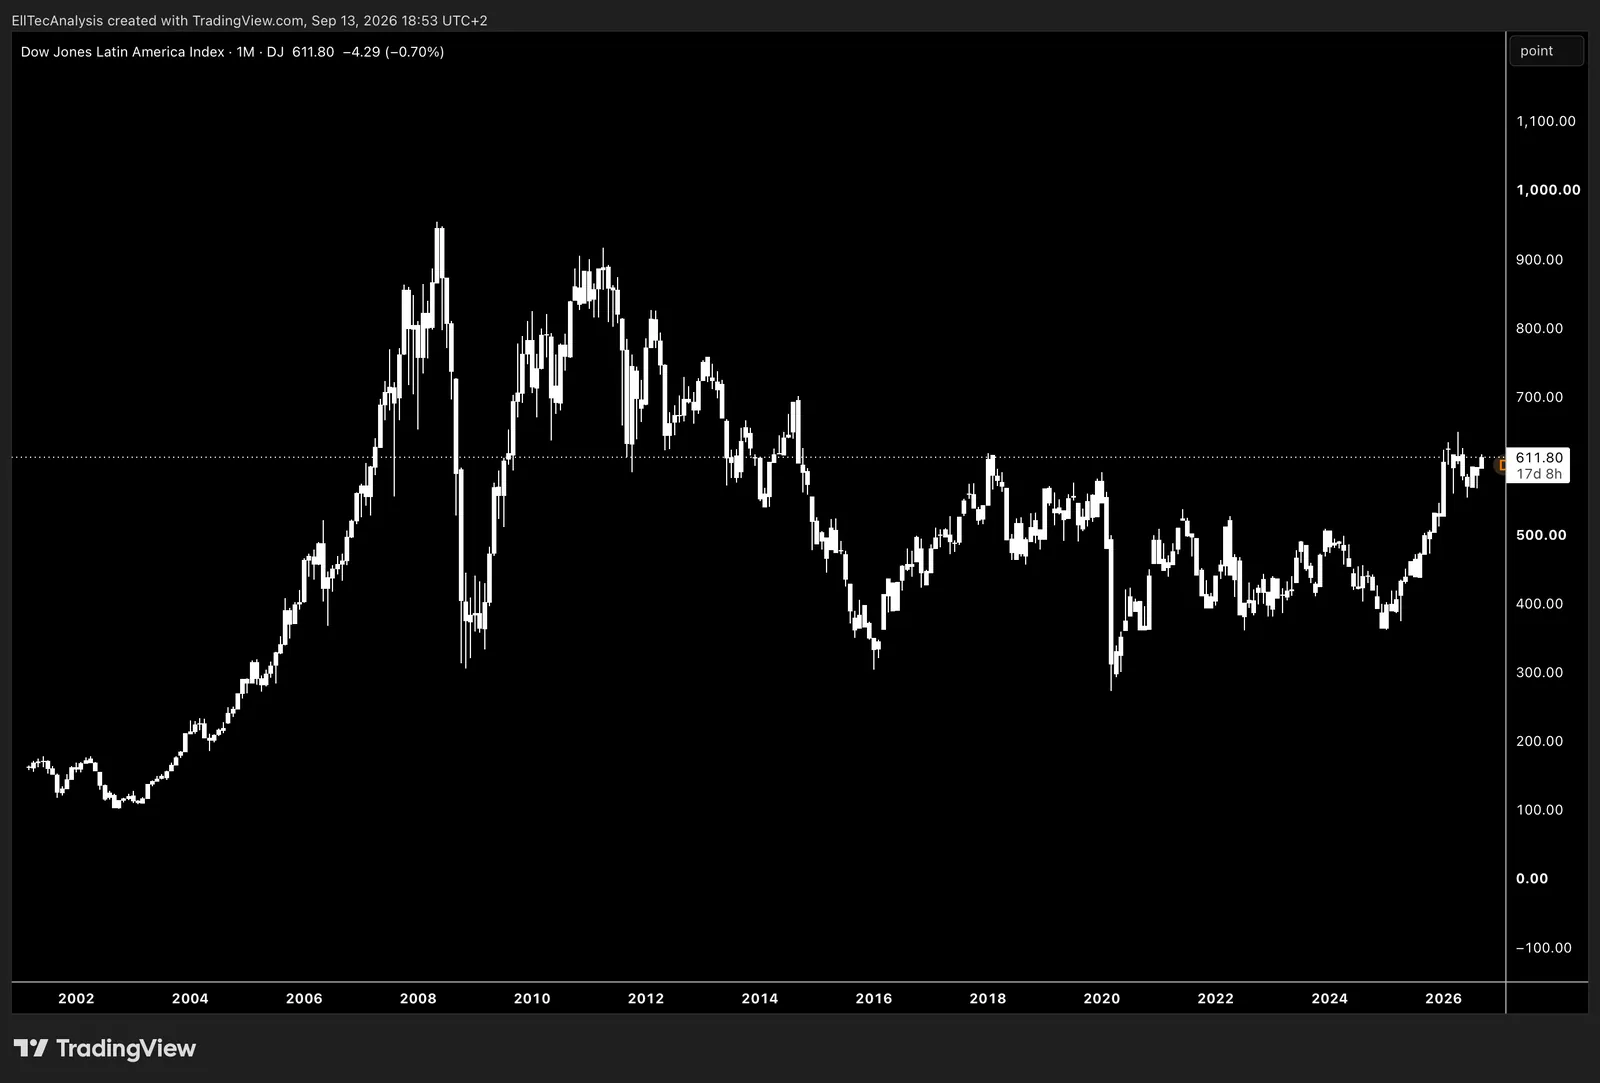
Regional index tracking major blue-chip companies across key Latin America markets.
Australia
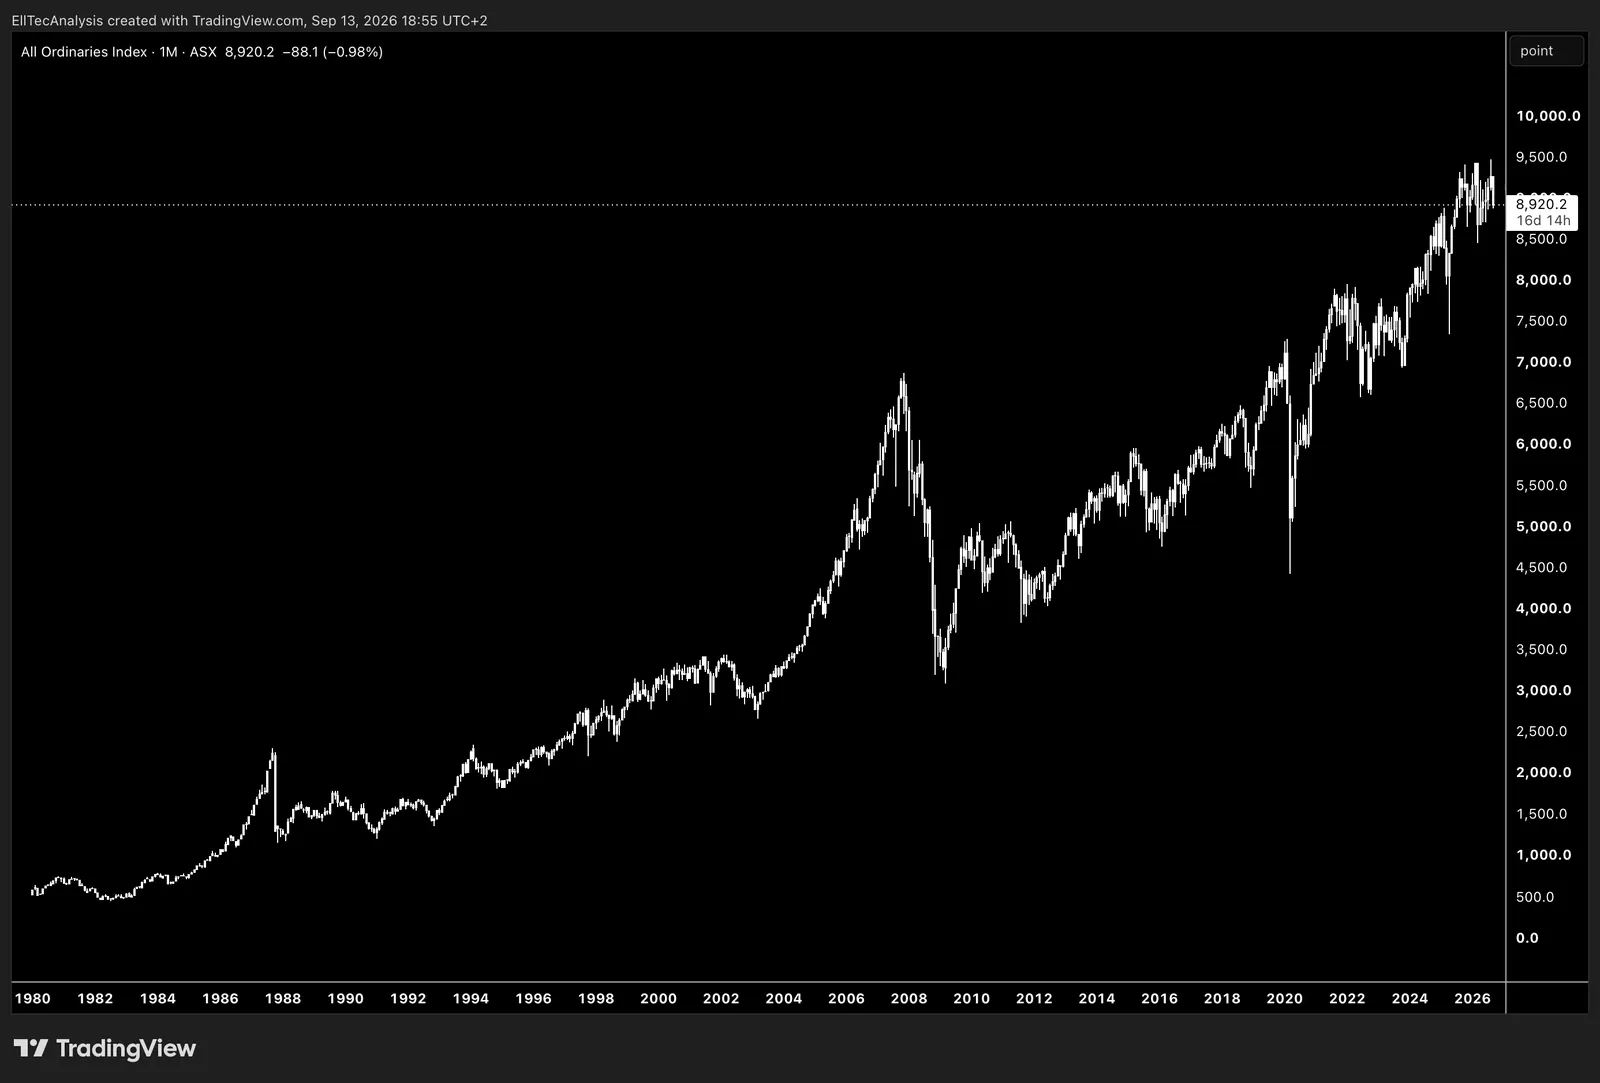
Broad Australian index tracking around 500 companies listed on the ASX by market-cap weight.
Market Breadth
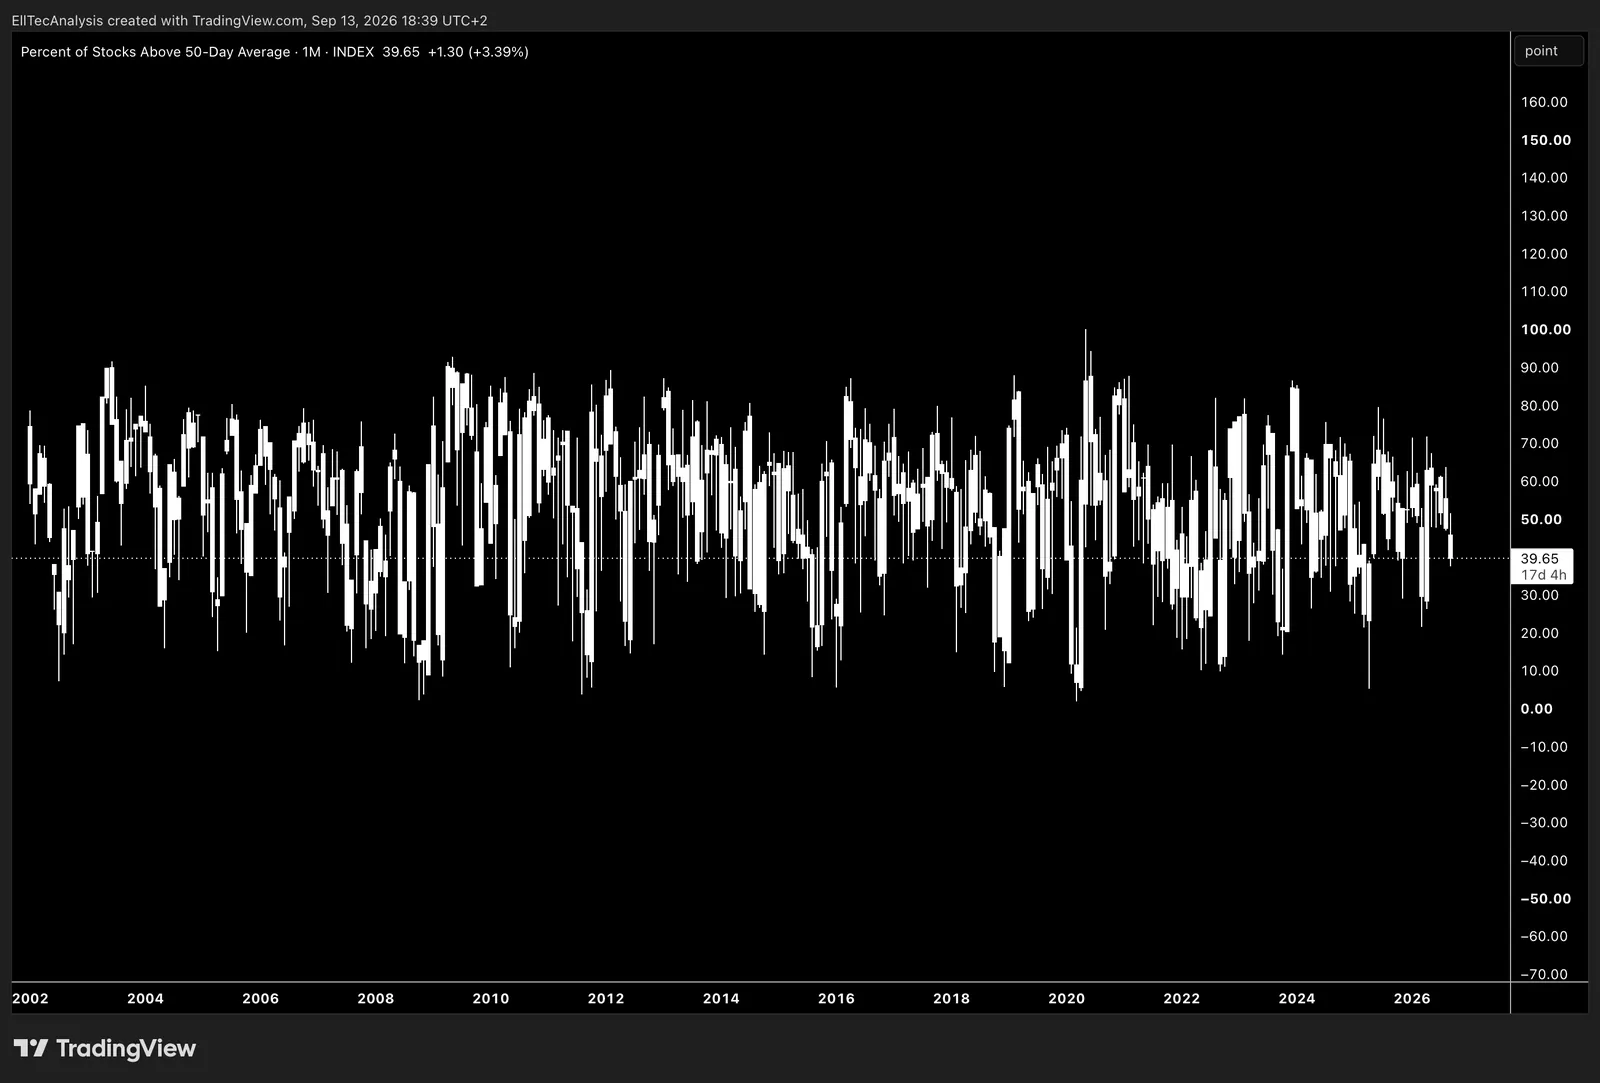
Percent of Stocks in the S&P 500 above the 20-day average.
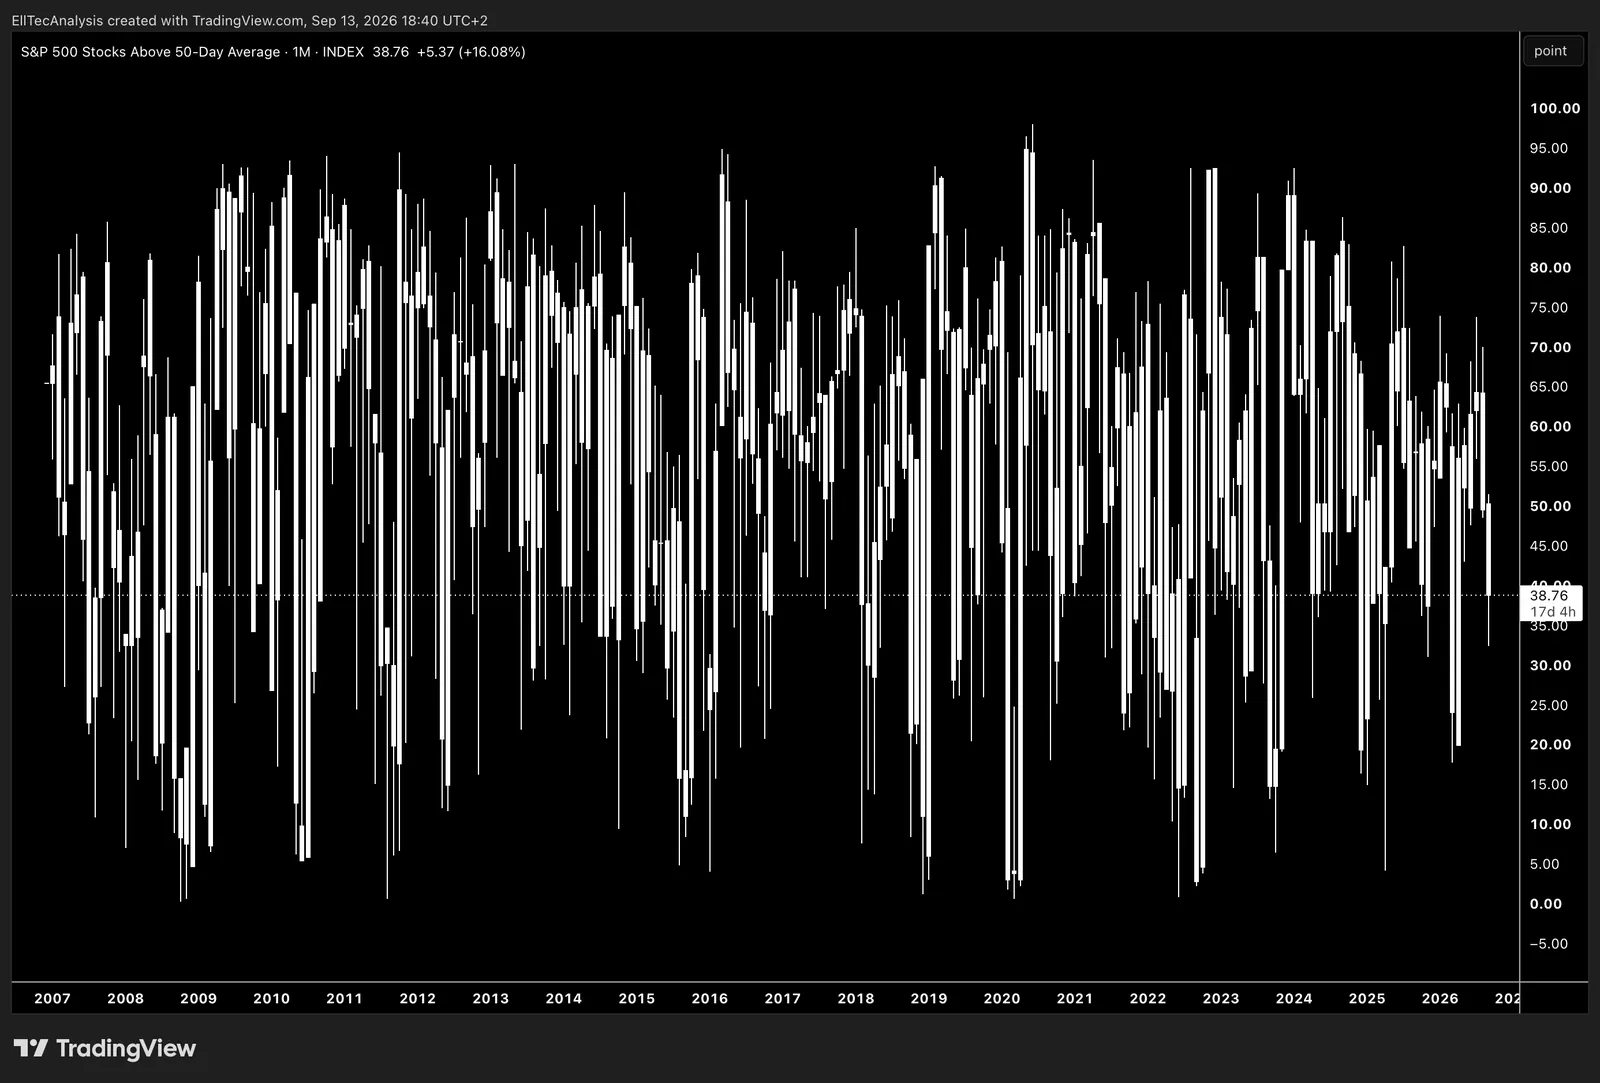
Percent of Stocks in the S&P 500 above the 50-day average.
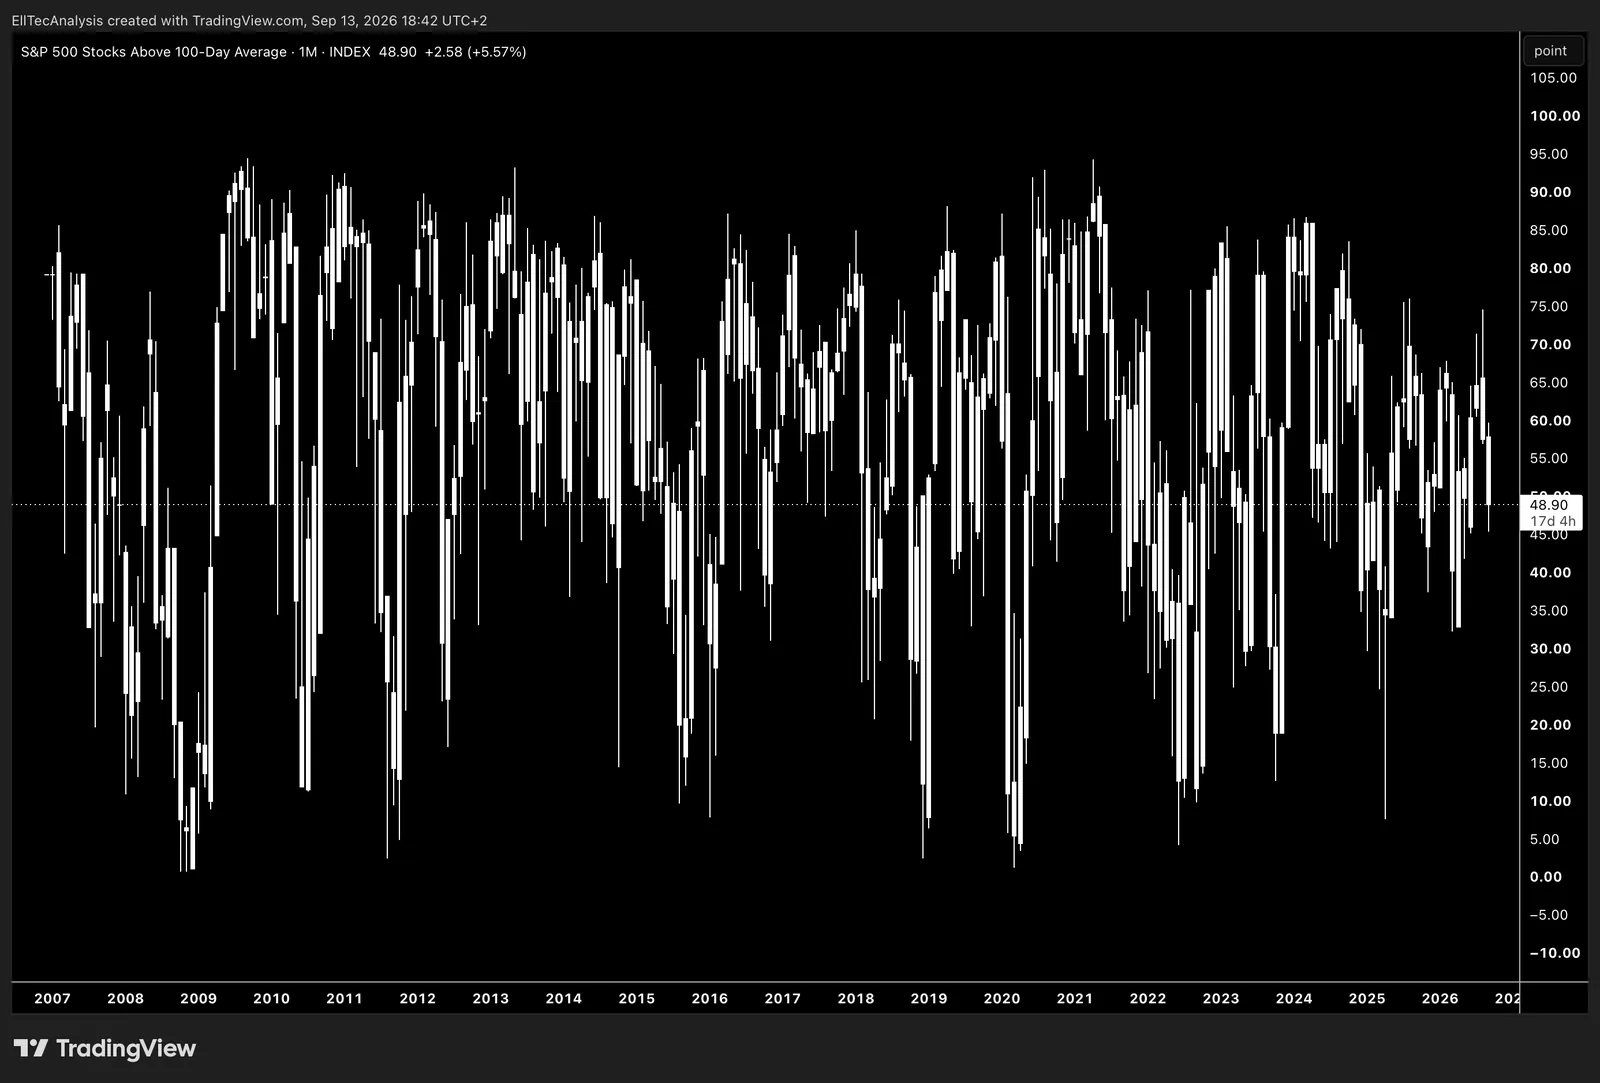
Percent of Stocks in the S&P 500 above the 100-day average.
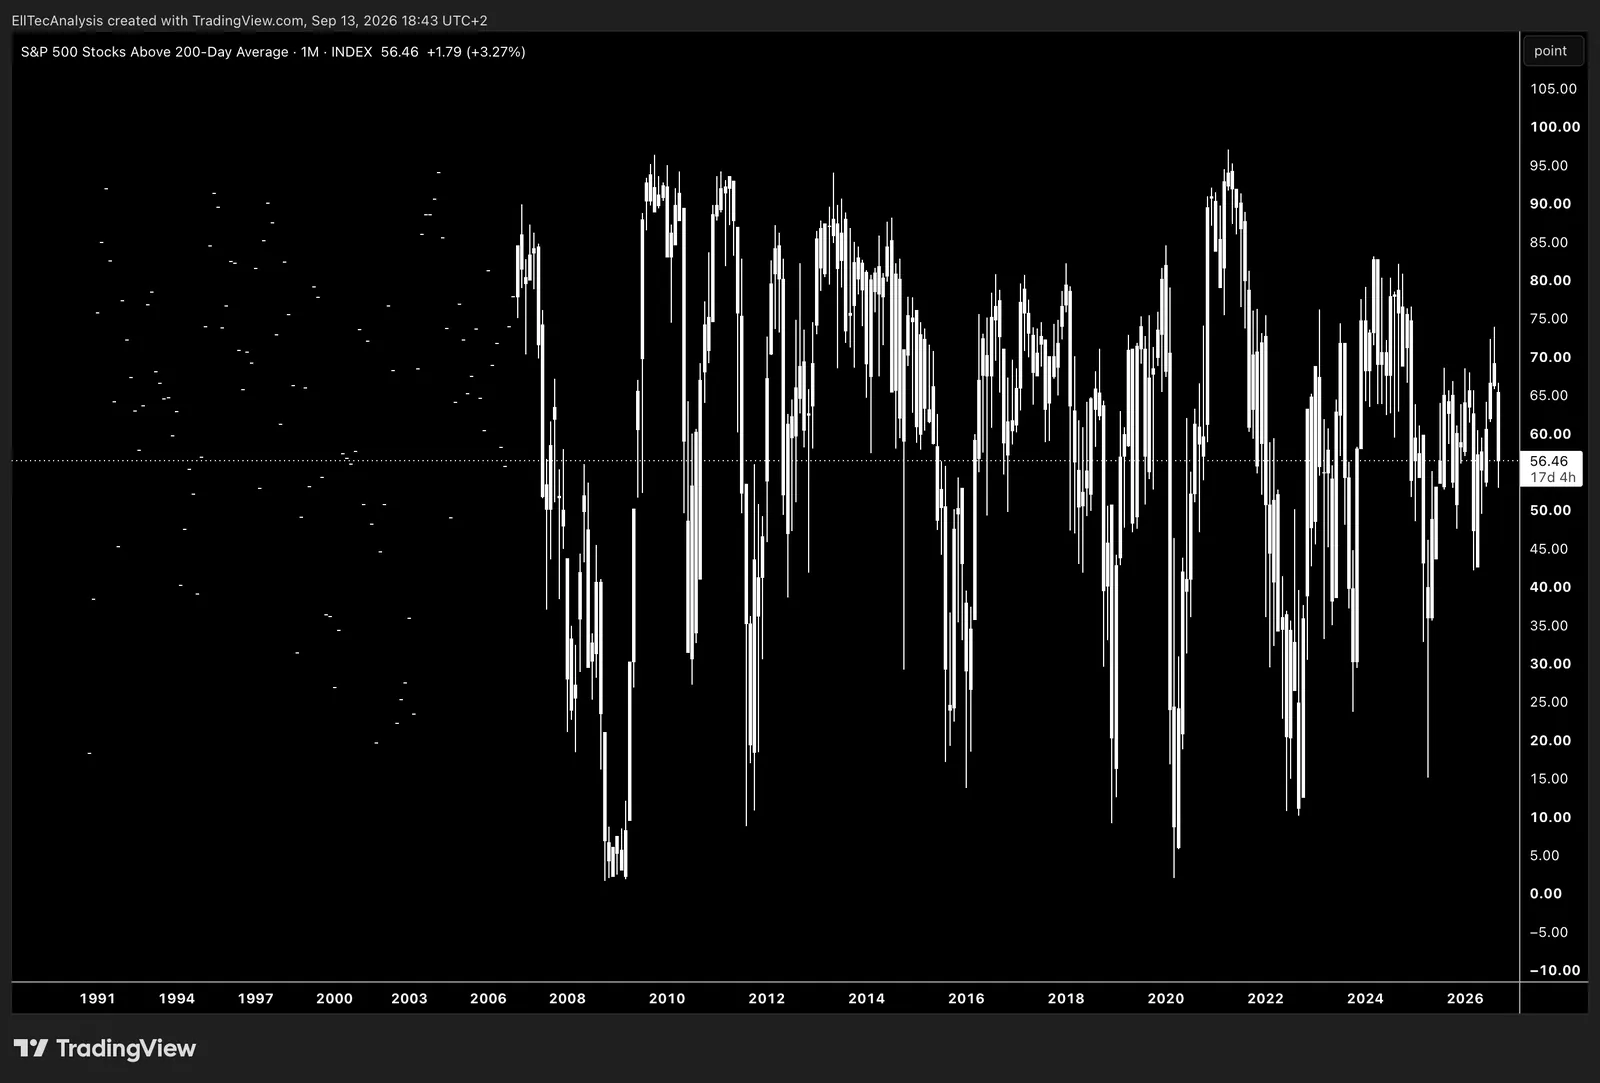
Percent of Stocks in the S&P 500 above the 200-day average.
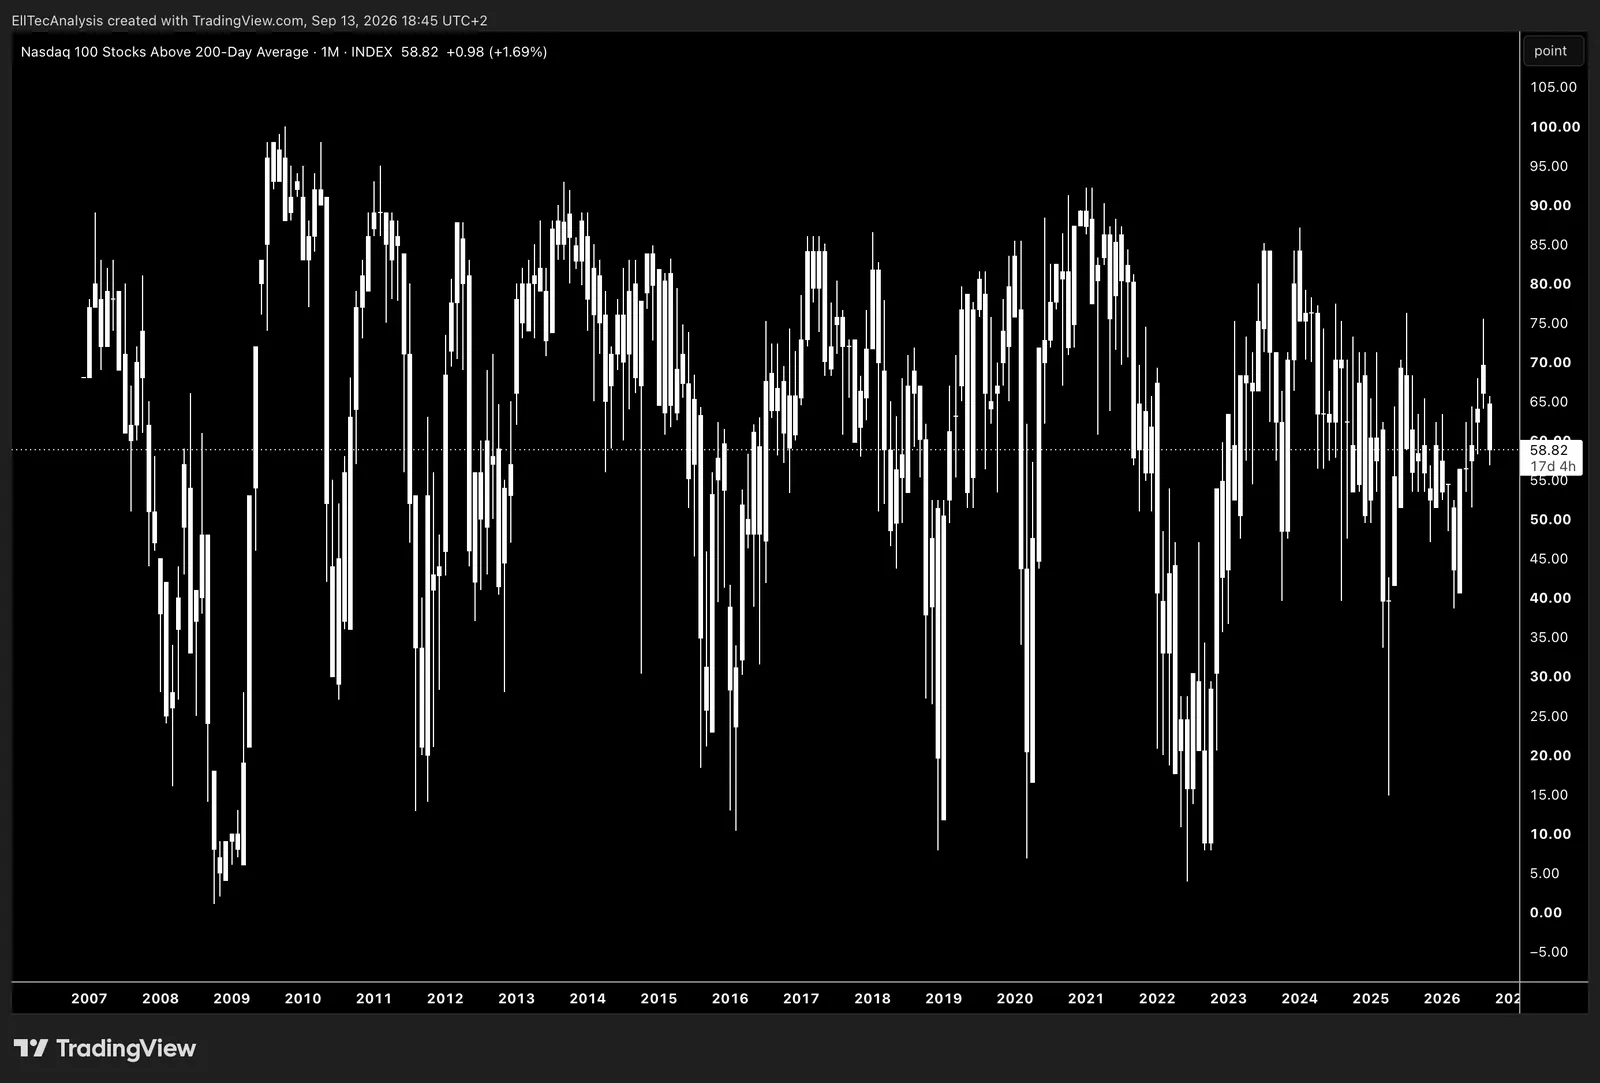
Percent of Stocks in the Nasdaq 100 above the 200-day average.
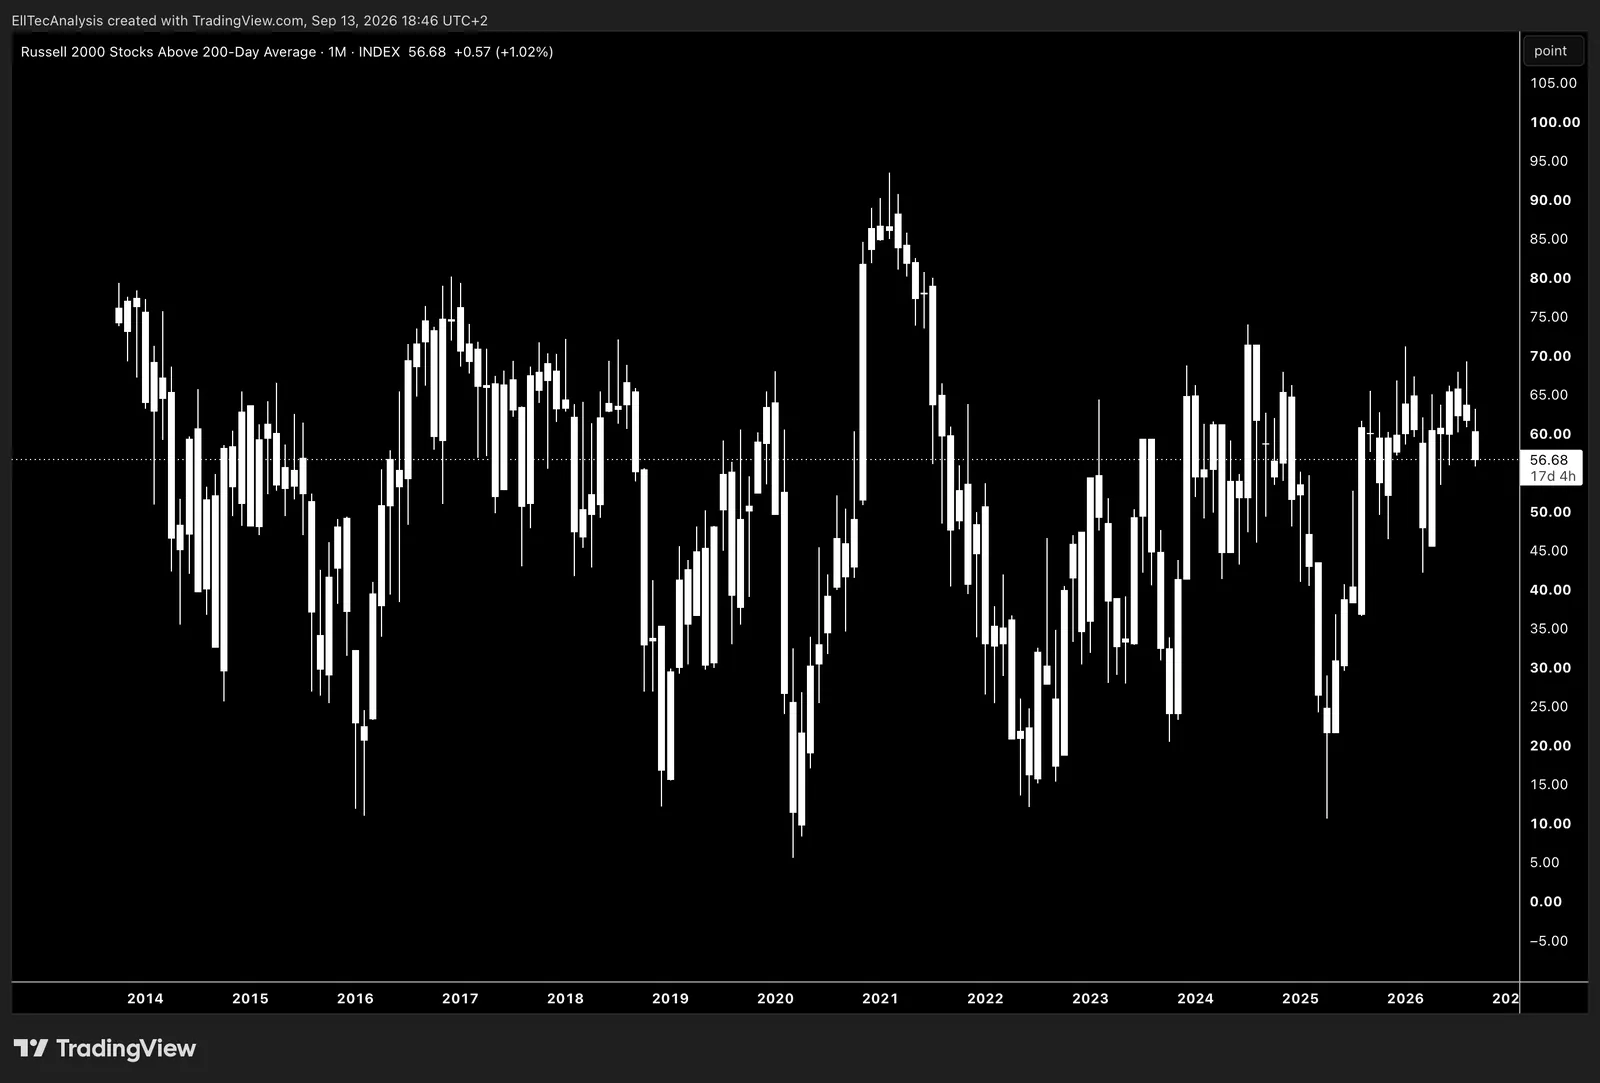
Percent of Stocks in the Russell 2000 above the 200-day average.
New Highs / Lows
USA
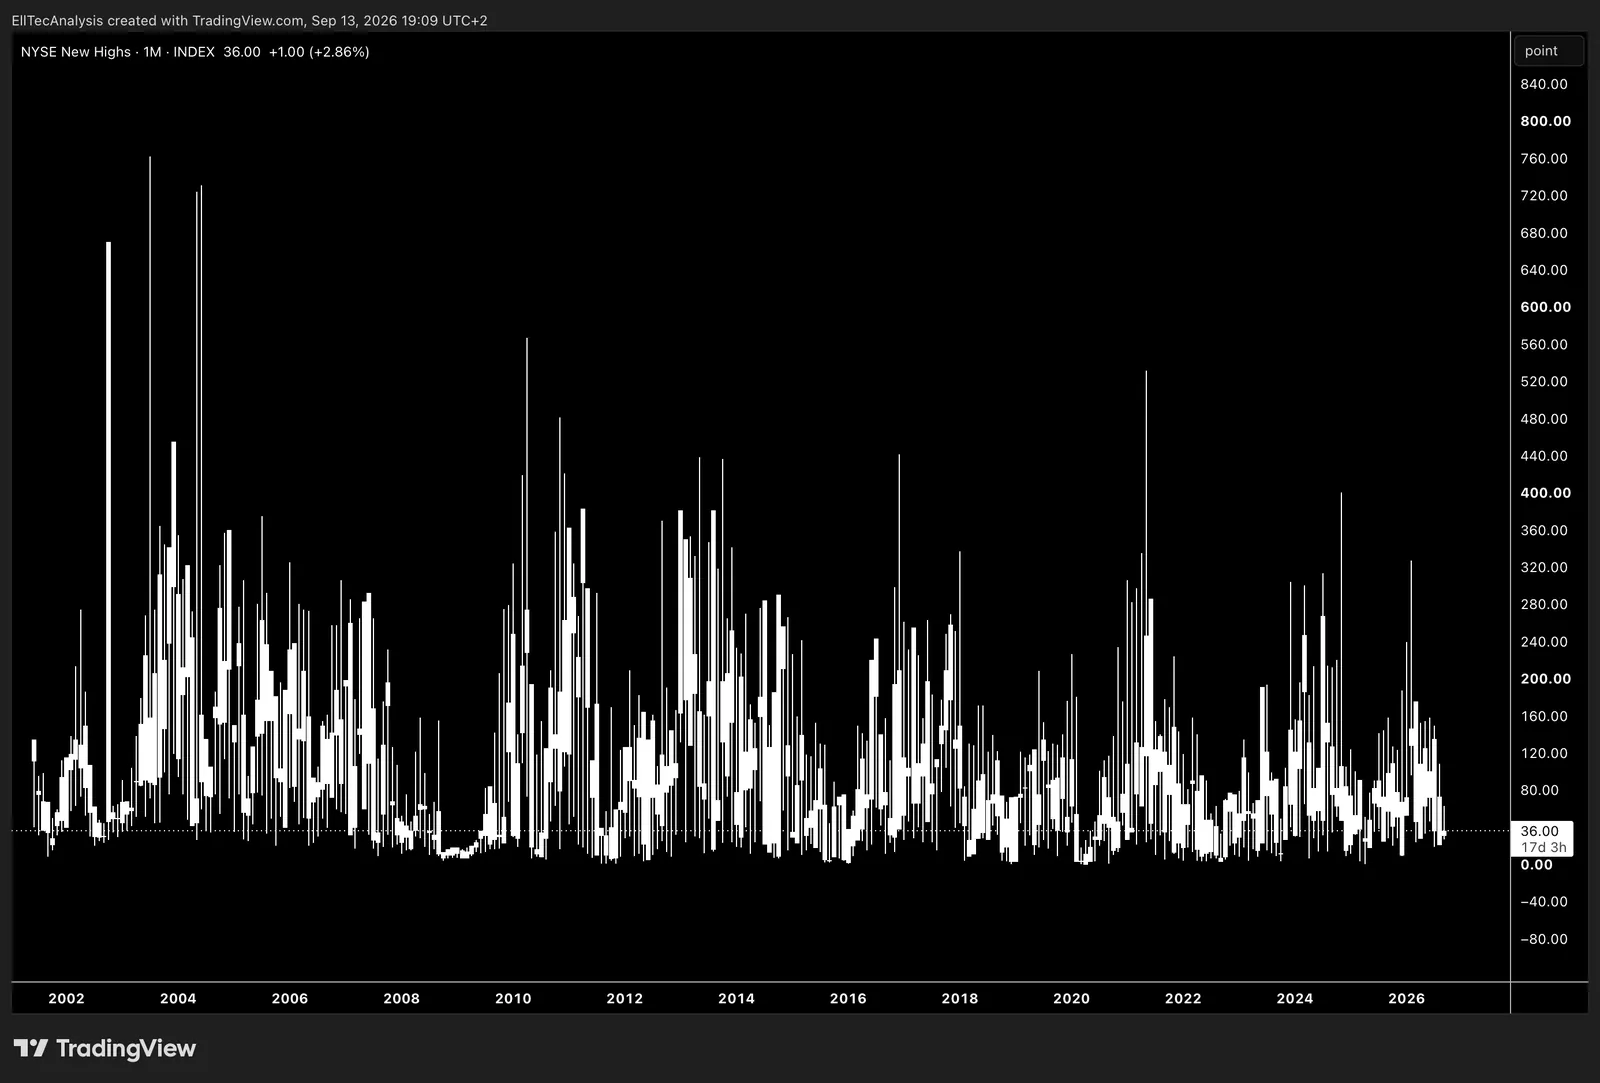
Number of stocks with new highs on the New York Stock Exchange.
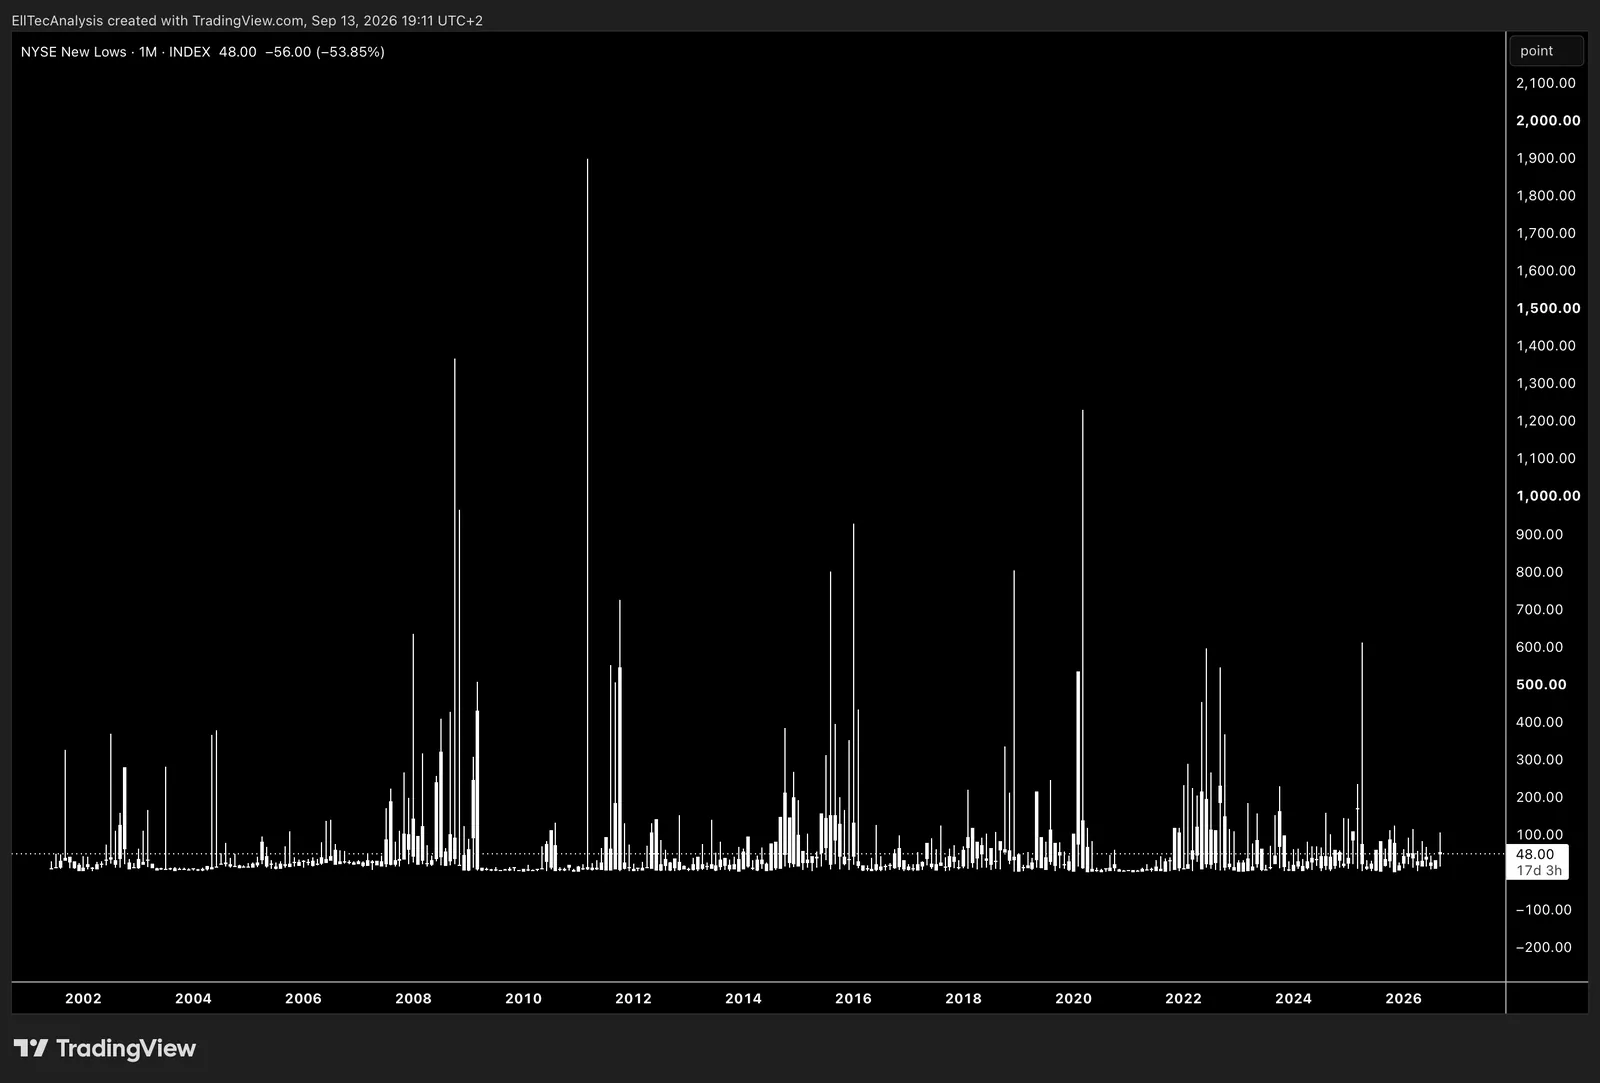
Number of stocks with new lows on the New York Stock Exchange.
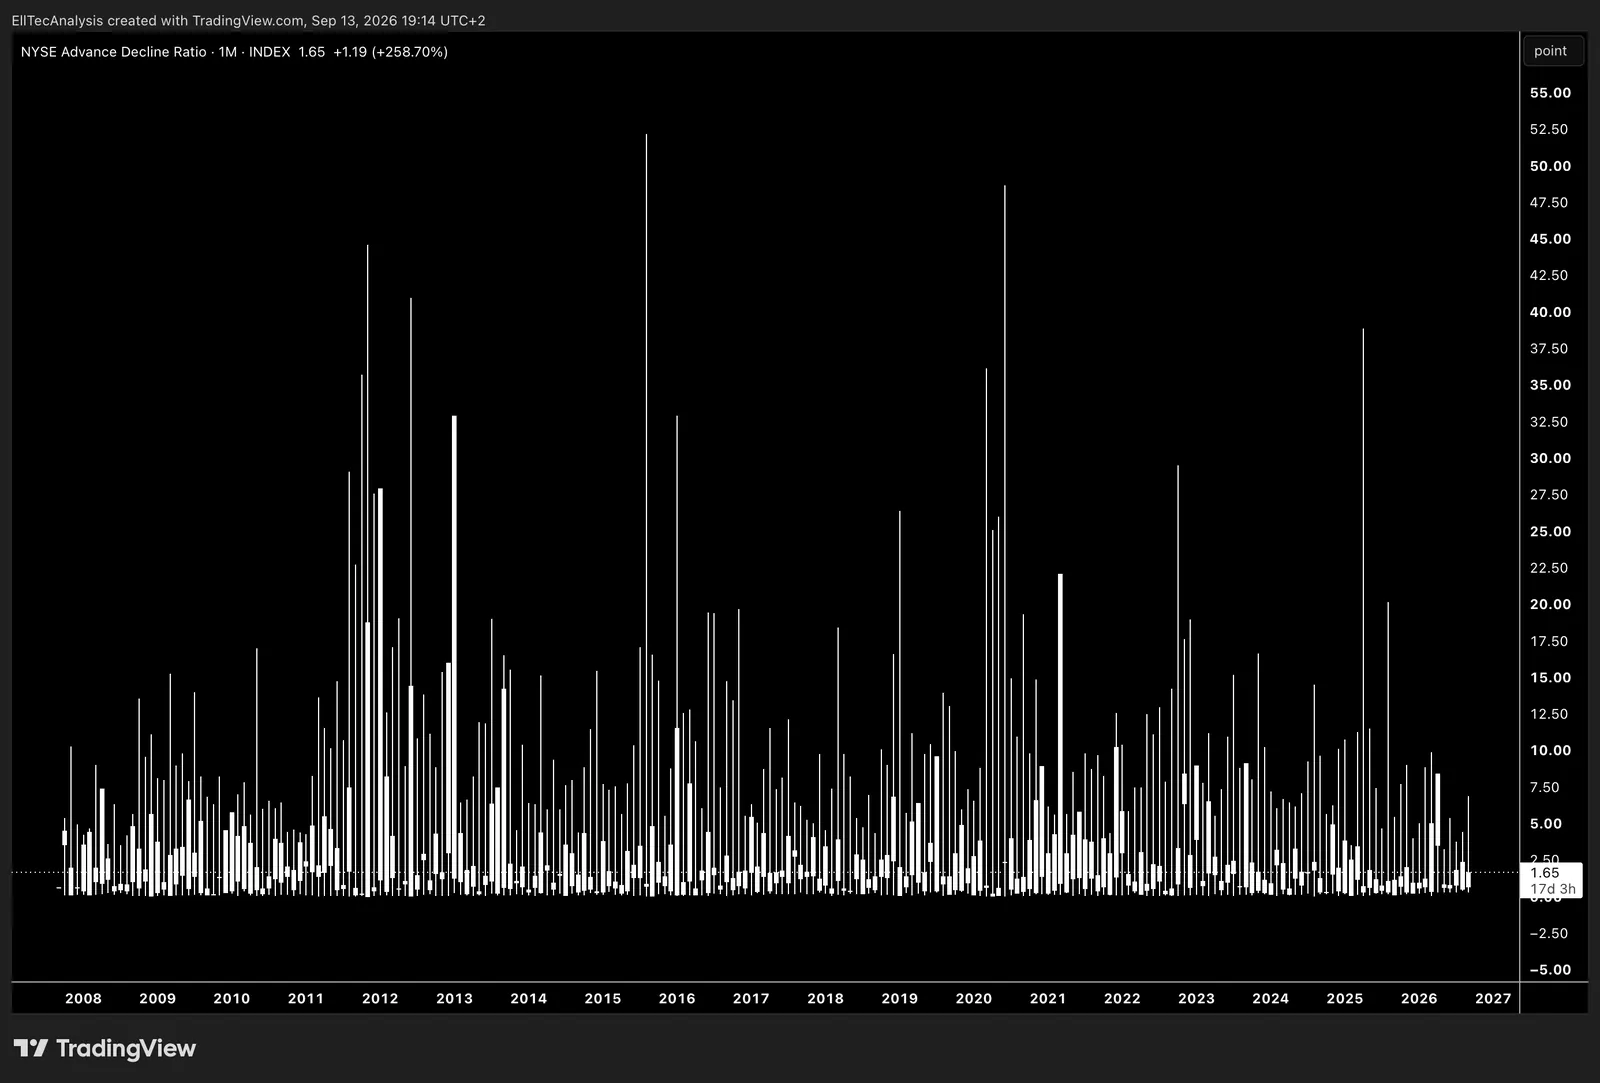
Measures market breadth by dividing advancing stocks by declining stocks on the New York Stock Exchange.
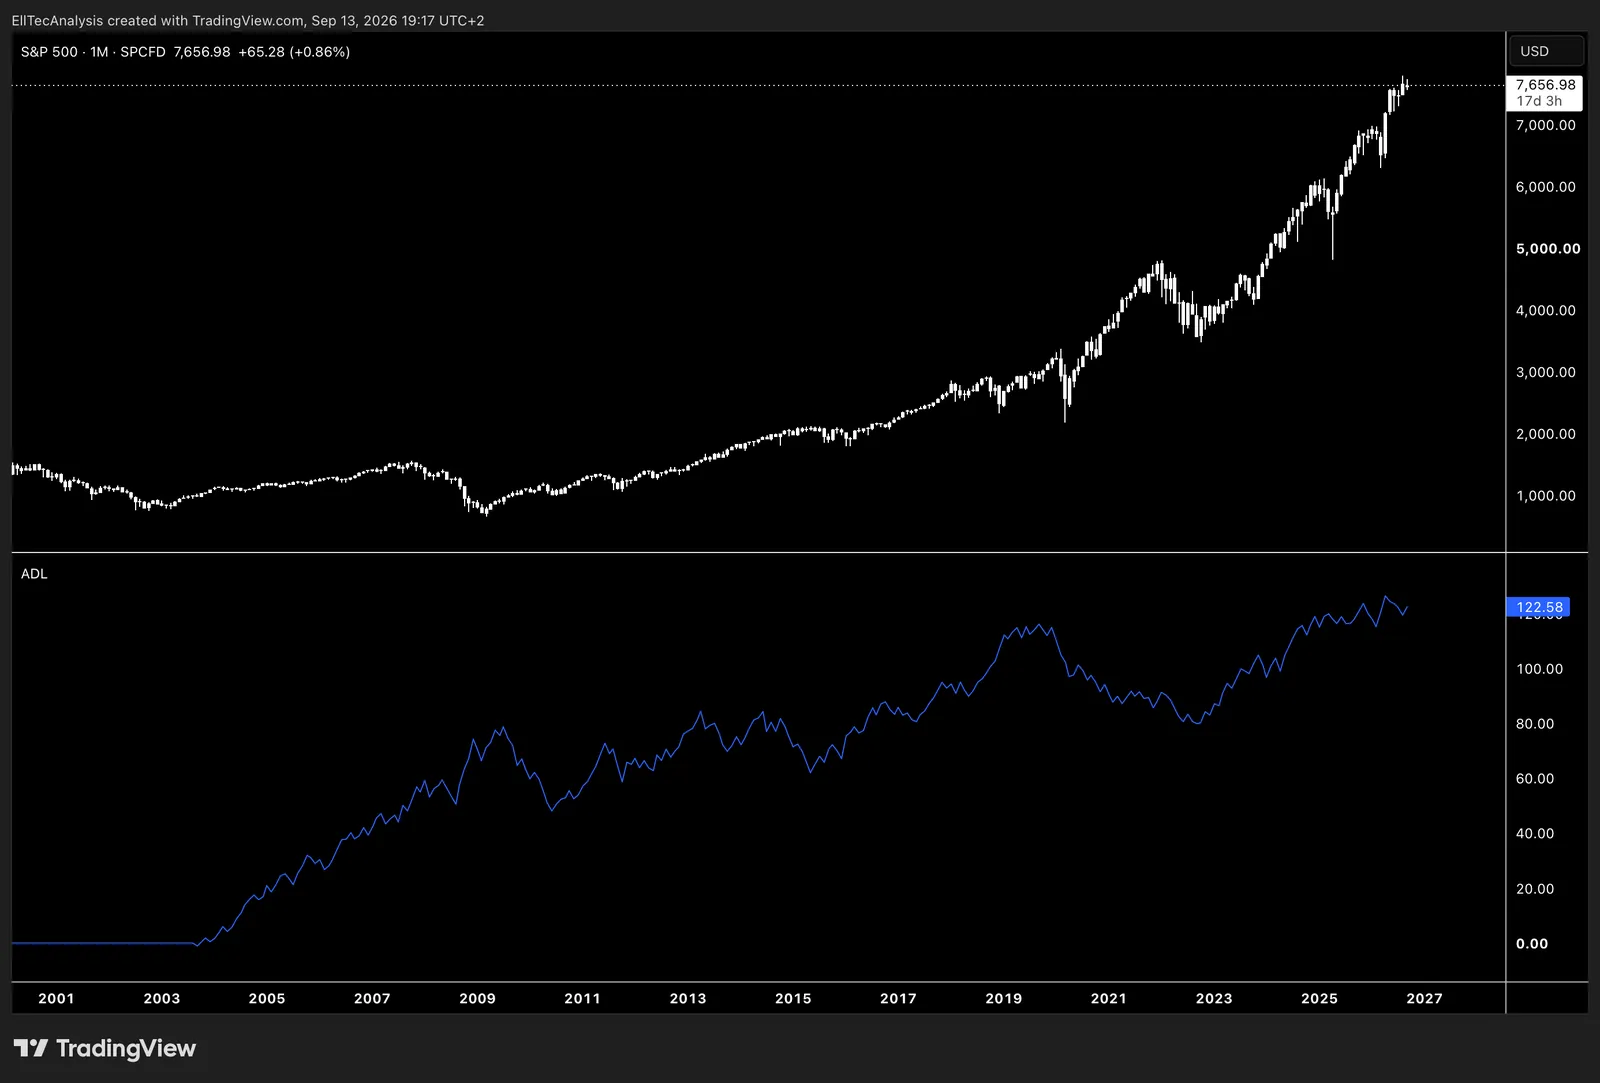
Comulative market-breadth indicator showing wheater more stocks advance or decline.
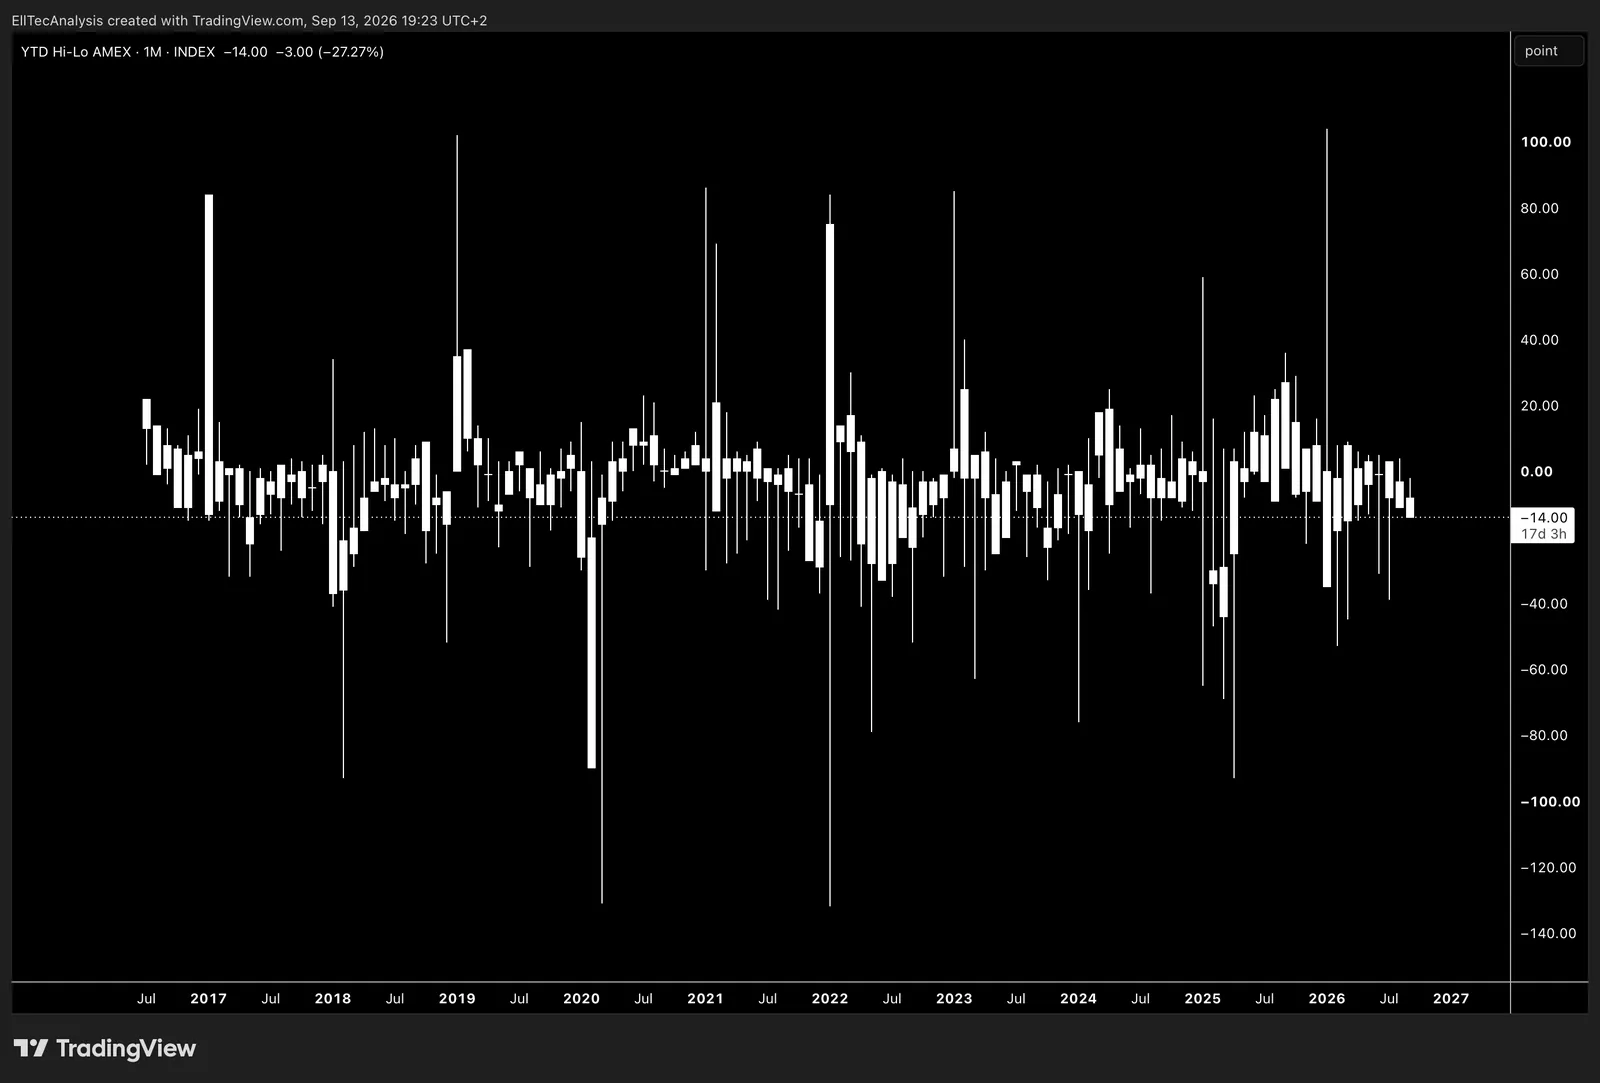
Year-to-Date new High / New Lows shows how many stocks on the New York Stock Exchange American have hit year-to-date highs versus year-to-date lows, indicating overall market strength or weakness.
Volatility
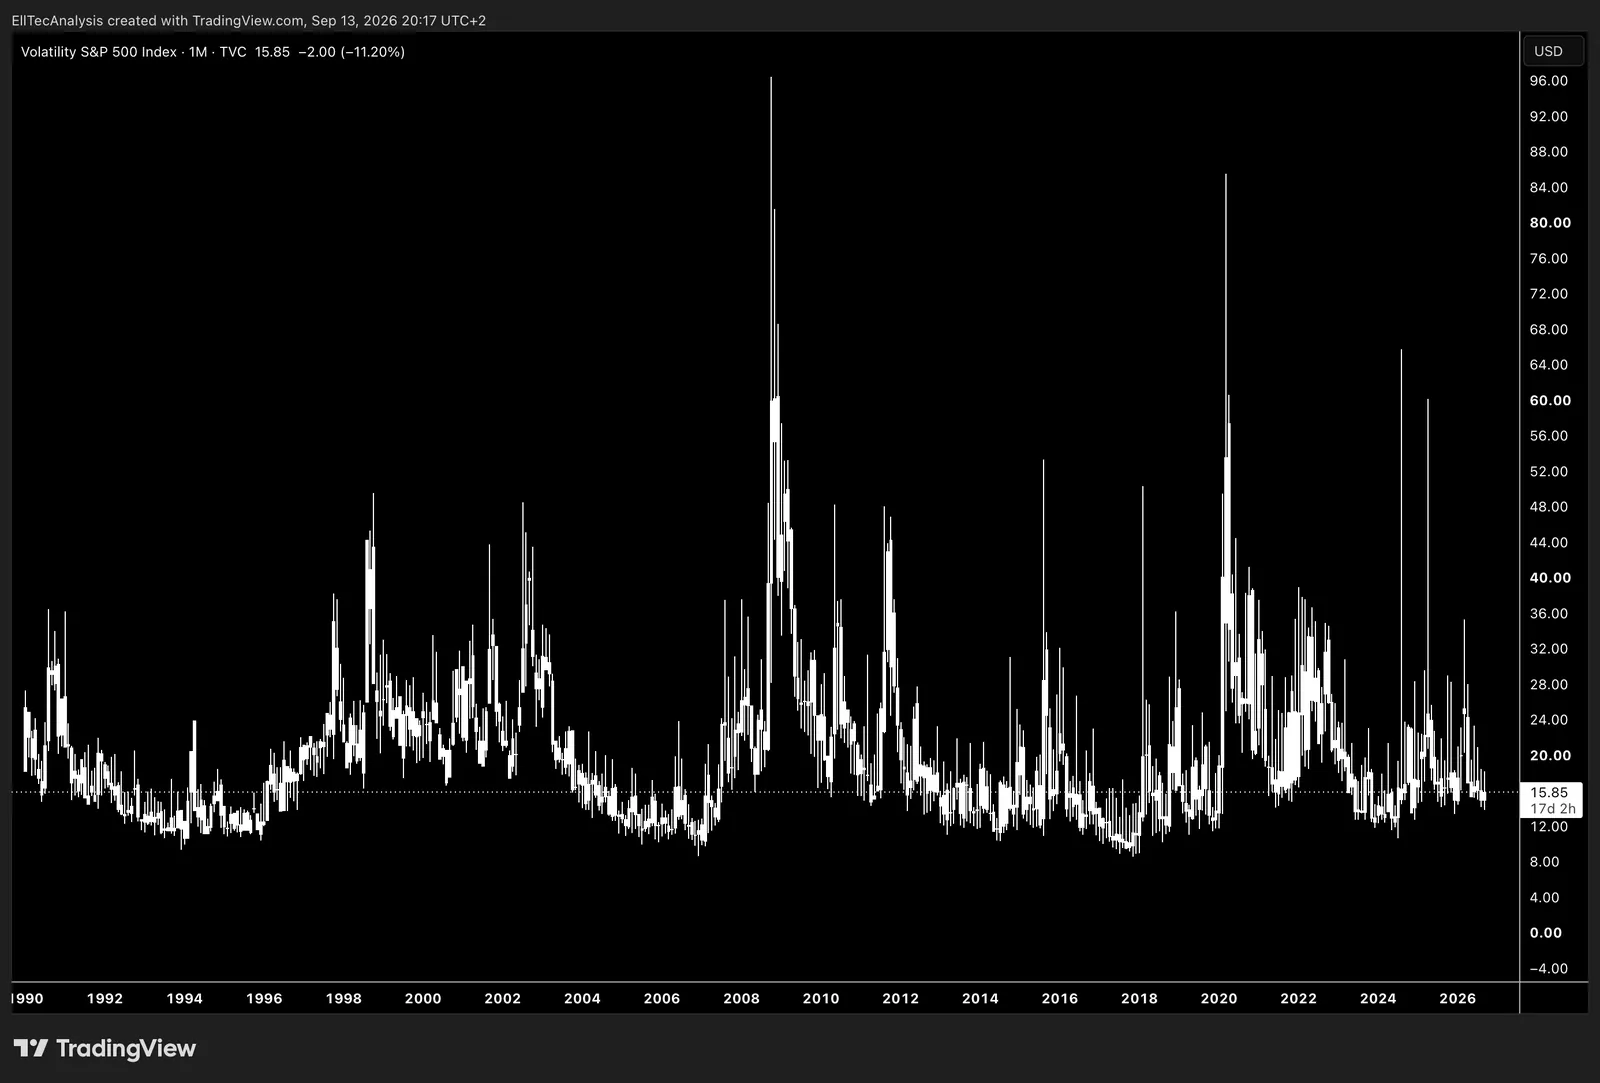
Reflects expected 30-day market volatility in the S&P 500.
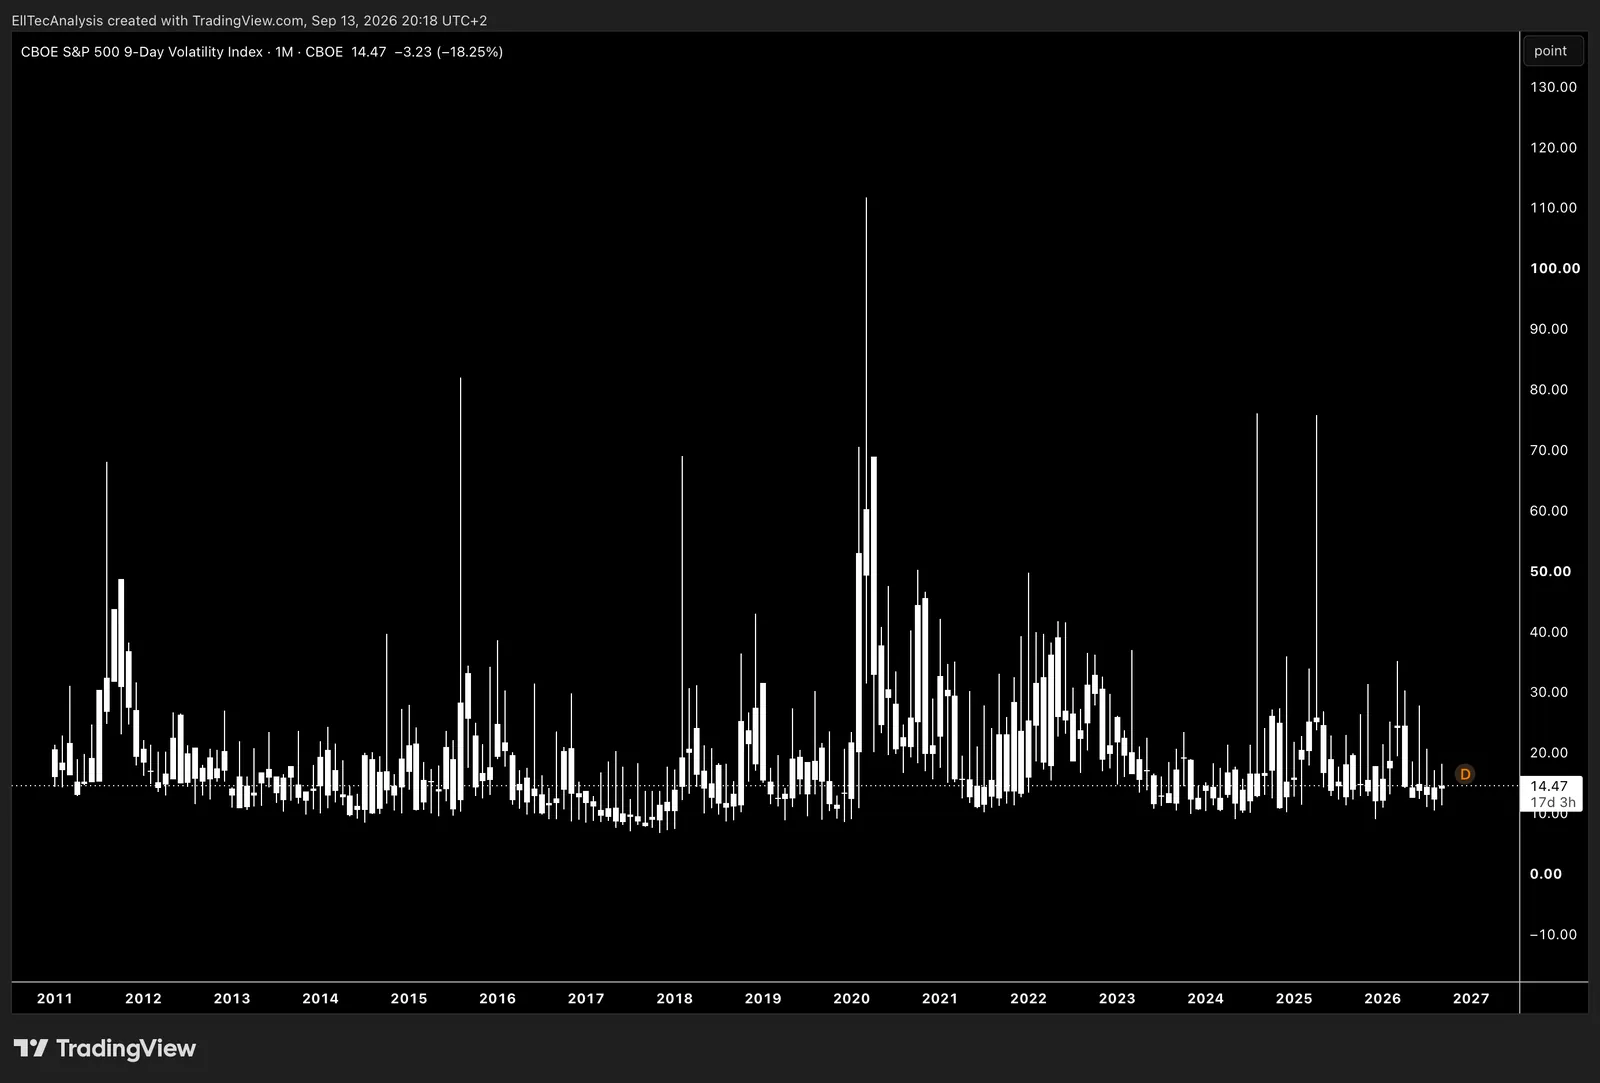
Reflects expected 9-day market volatility in the S&P 500.
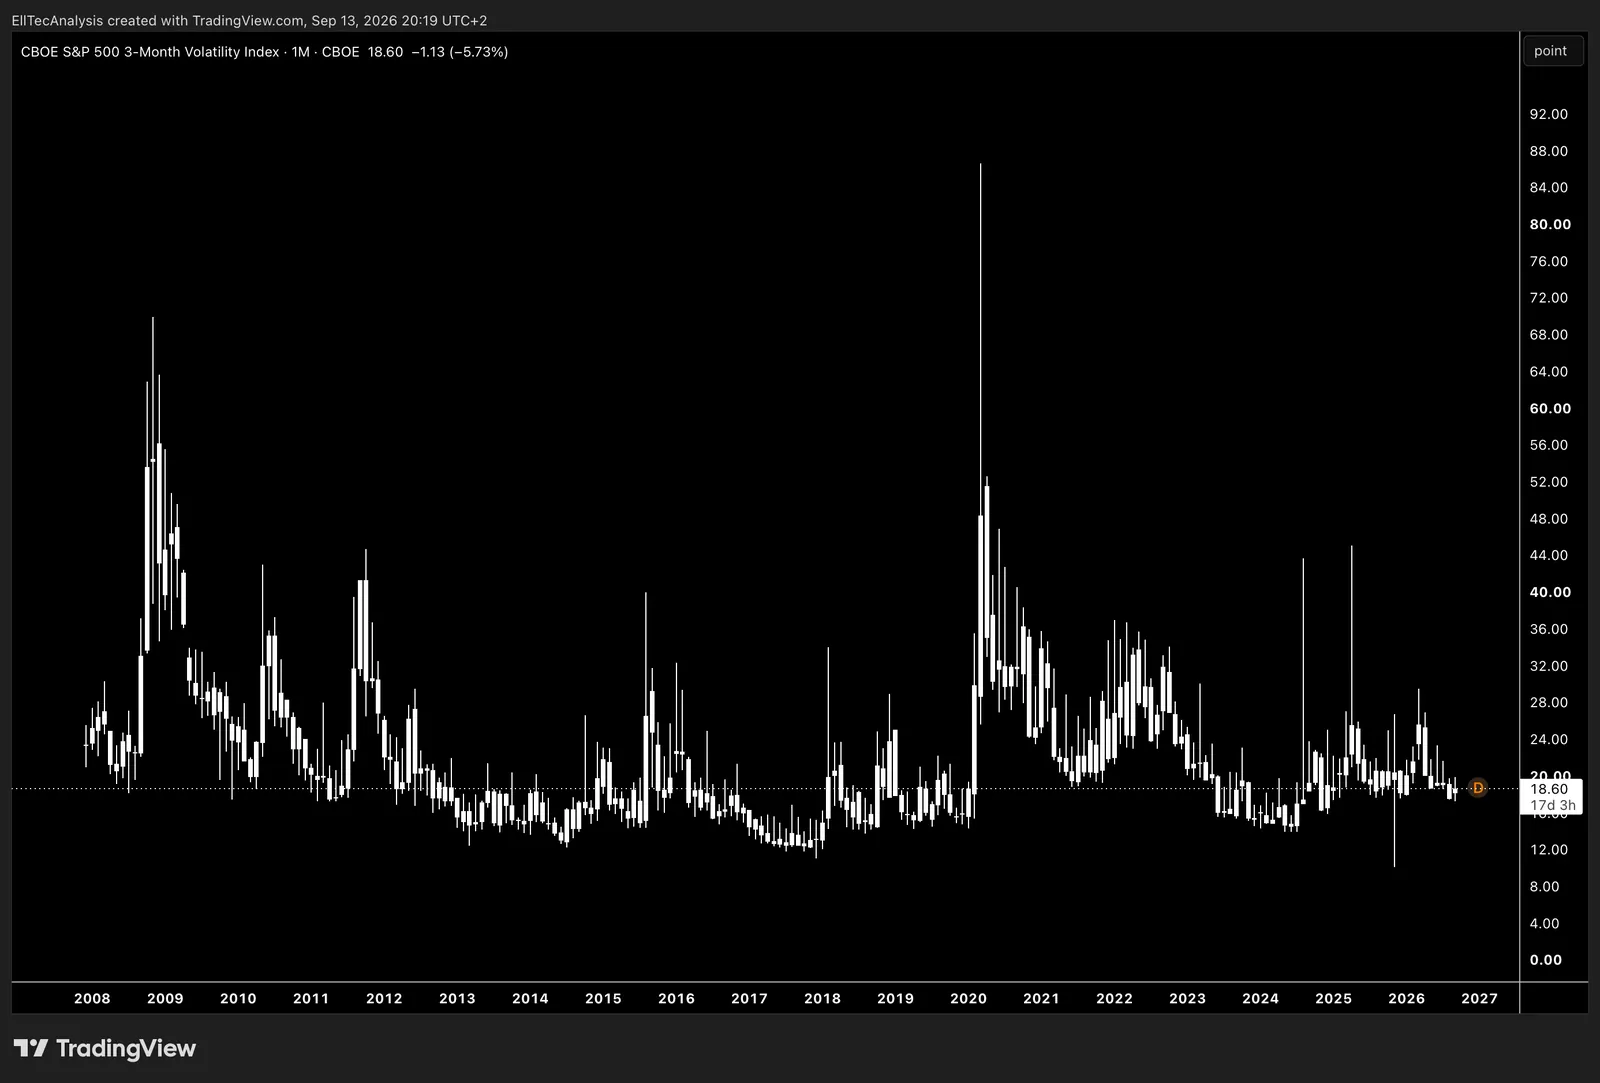
Reflects expected 3-month market volatility in the S&P 500.
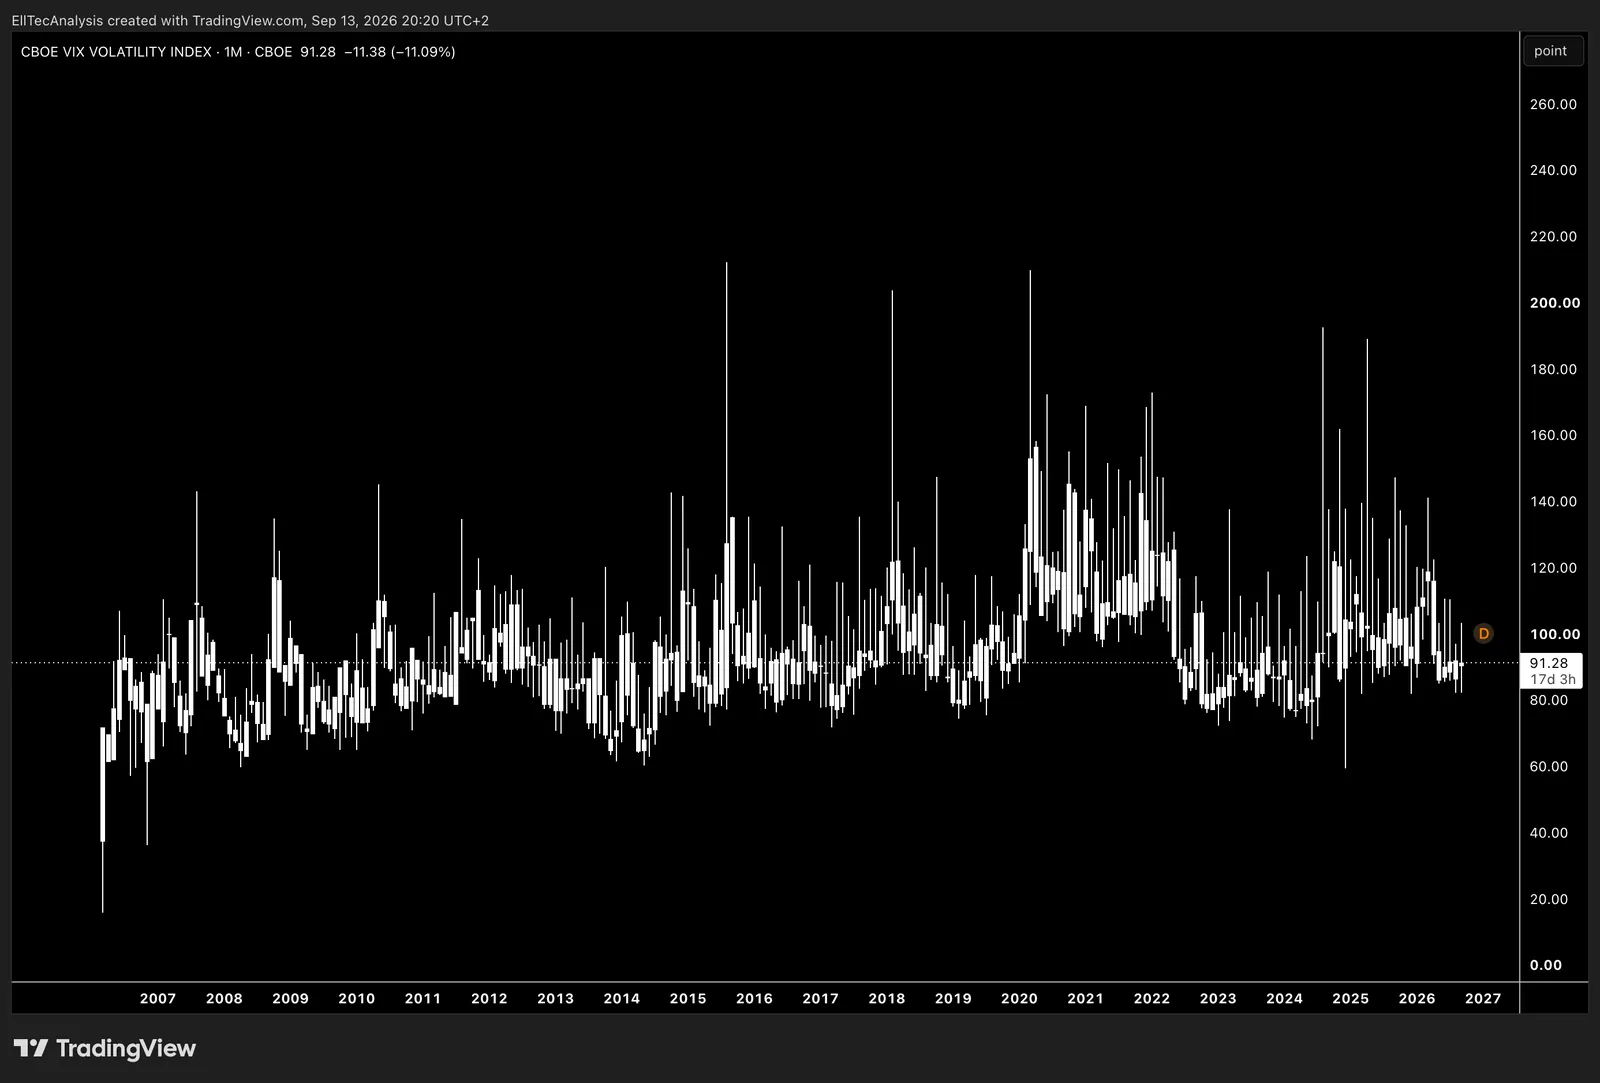
Measures the market´s 30-day implied volatility for the S&P 500 based on option prices.
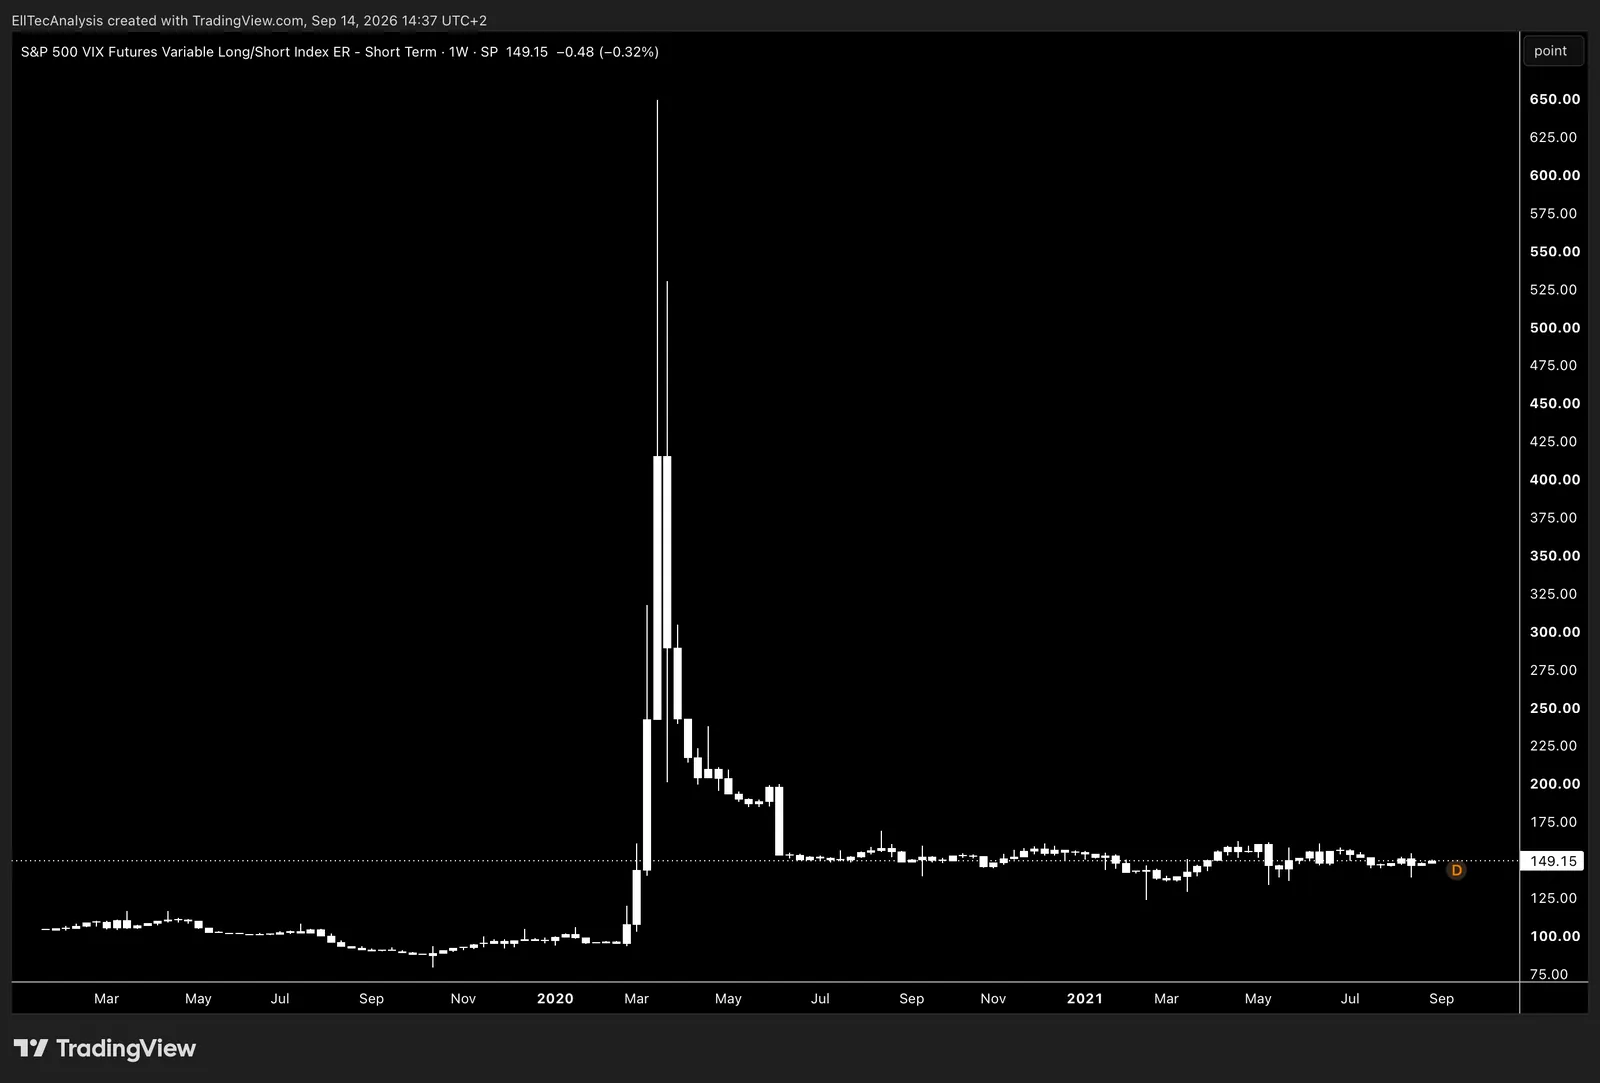
Long/Short derivatives on the S&P 500 volatility.
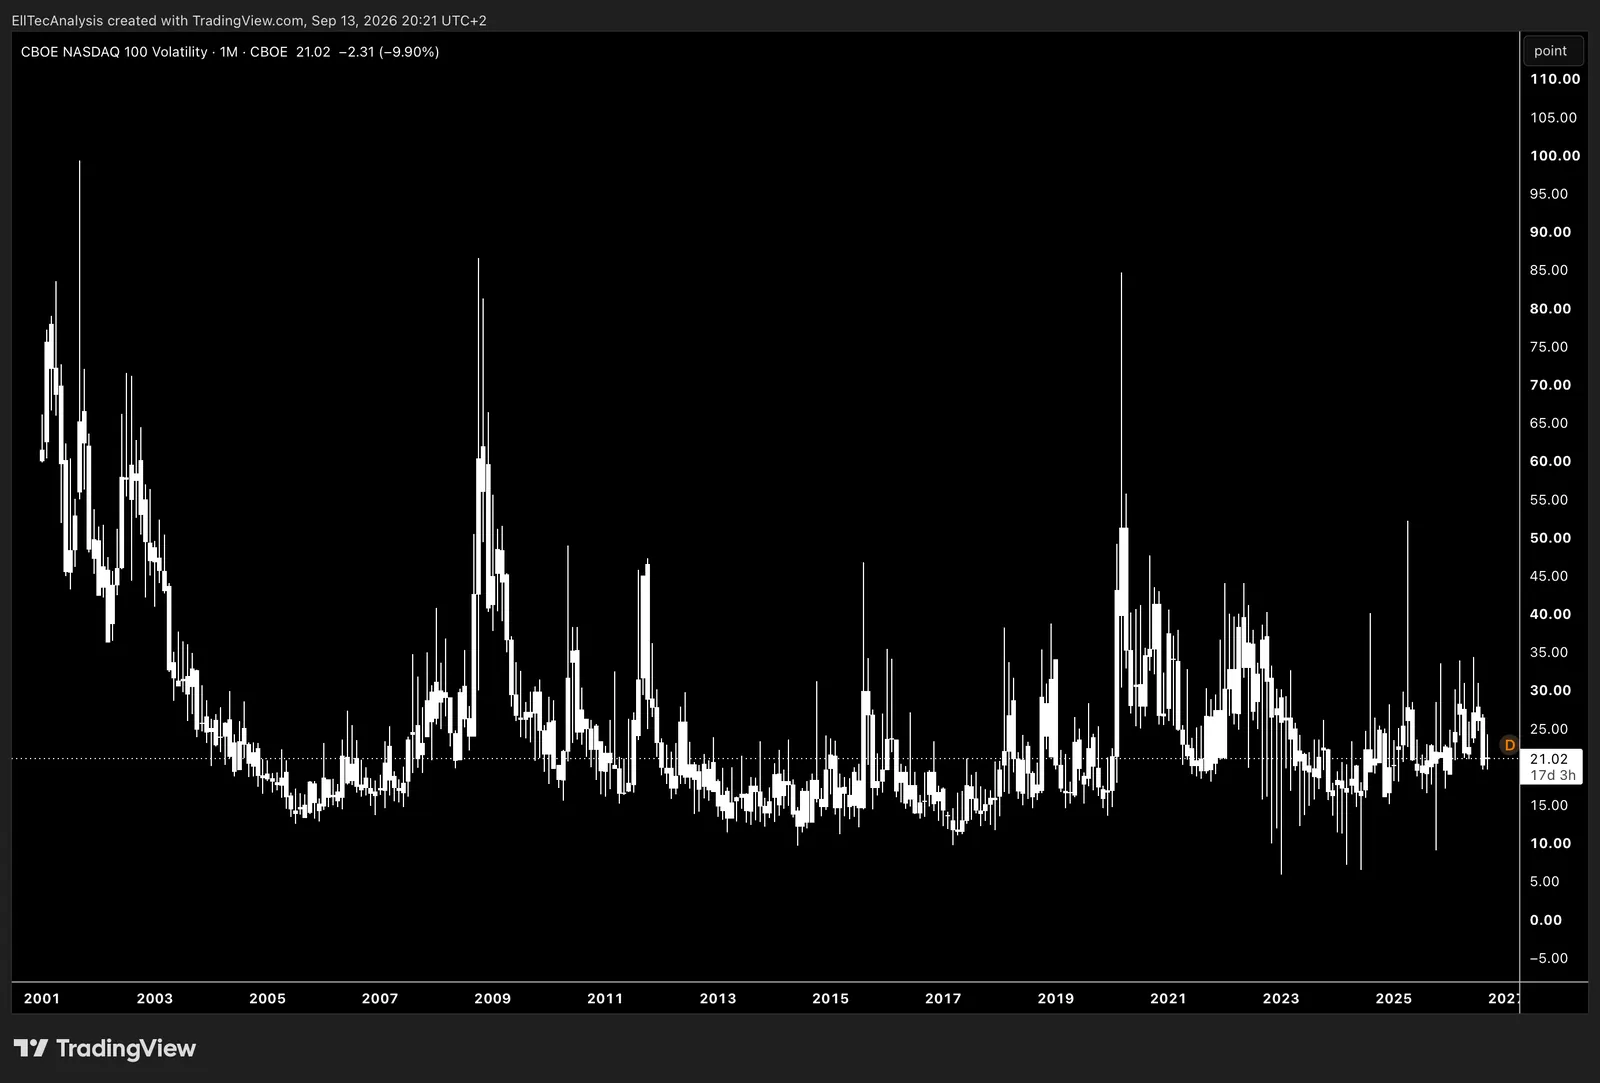
Measures implied 30-day volatility of Nasdaq-100 options, reflecting expected price swings in major tech-heavy stocks.
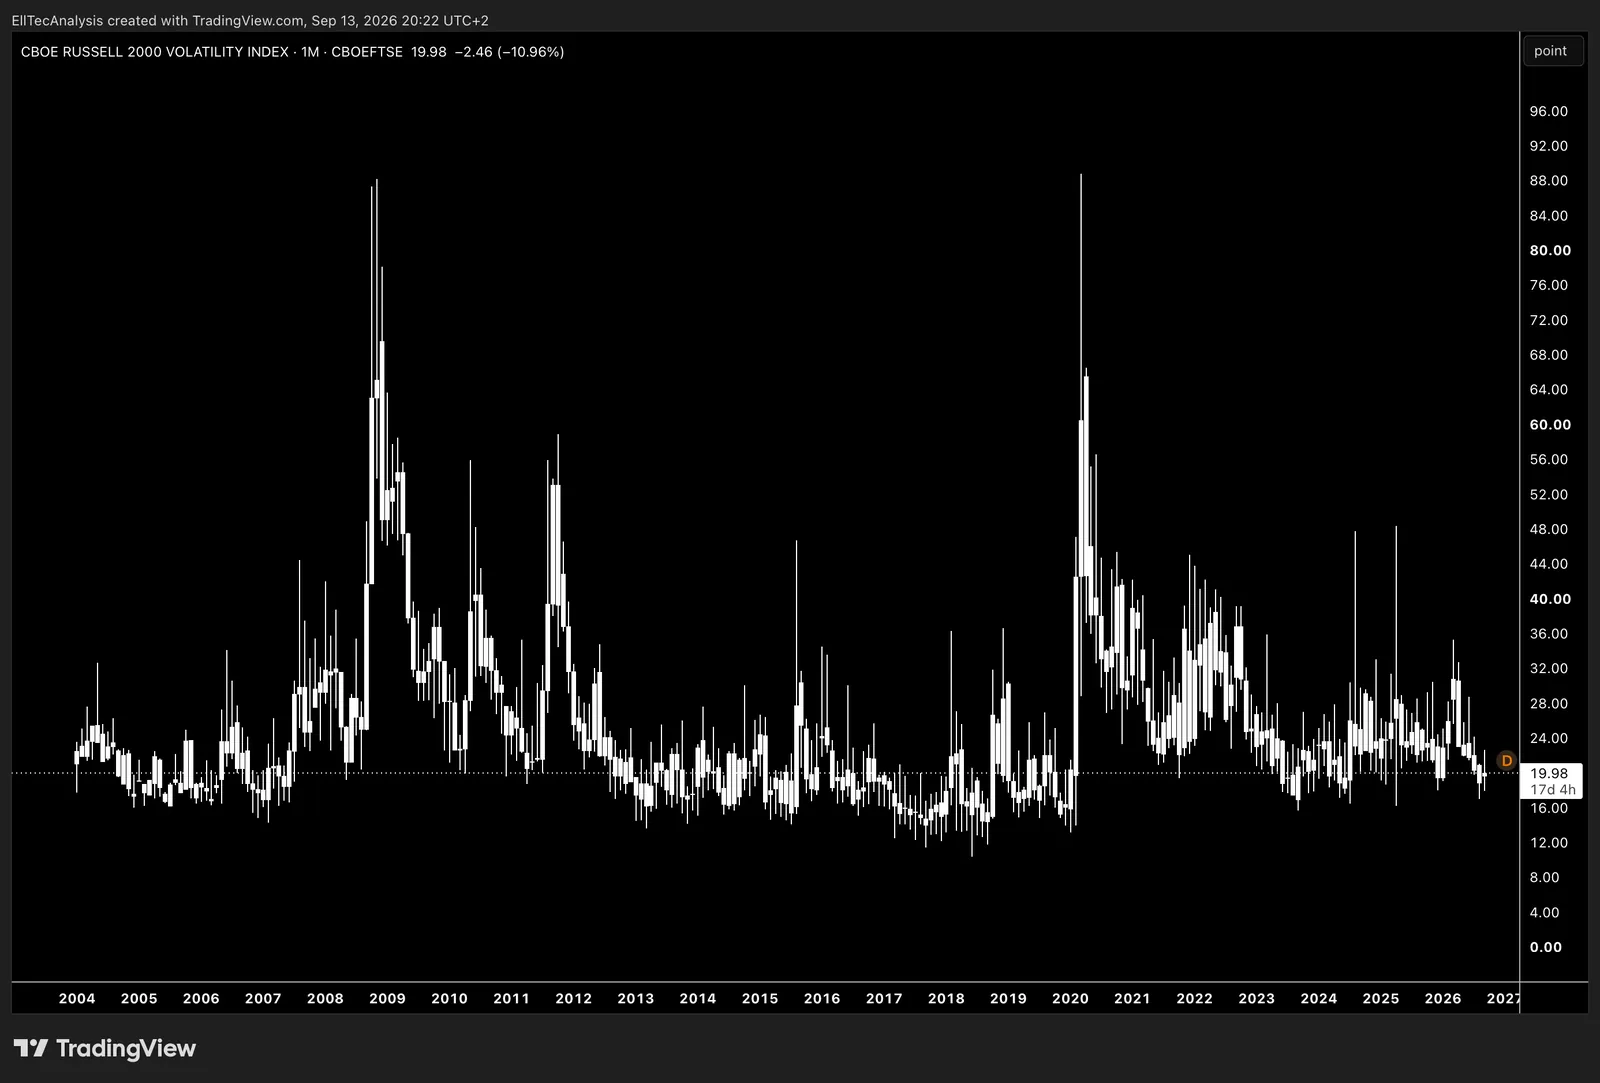
Measures the implied 30-day volatility of Russell 2000 options, refelcting expected price swings in US small-cap stocks.
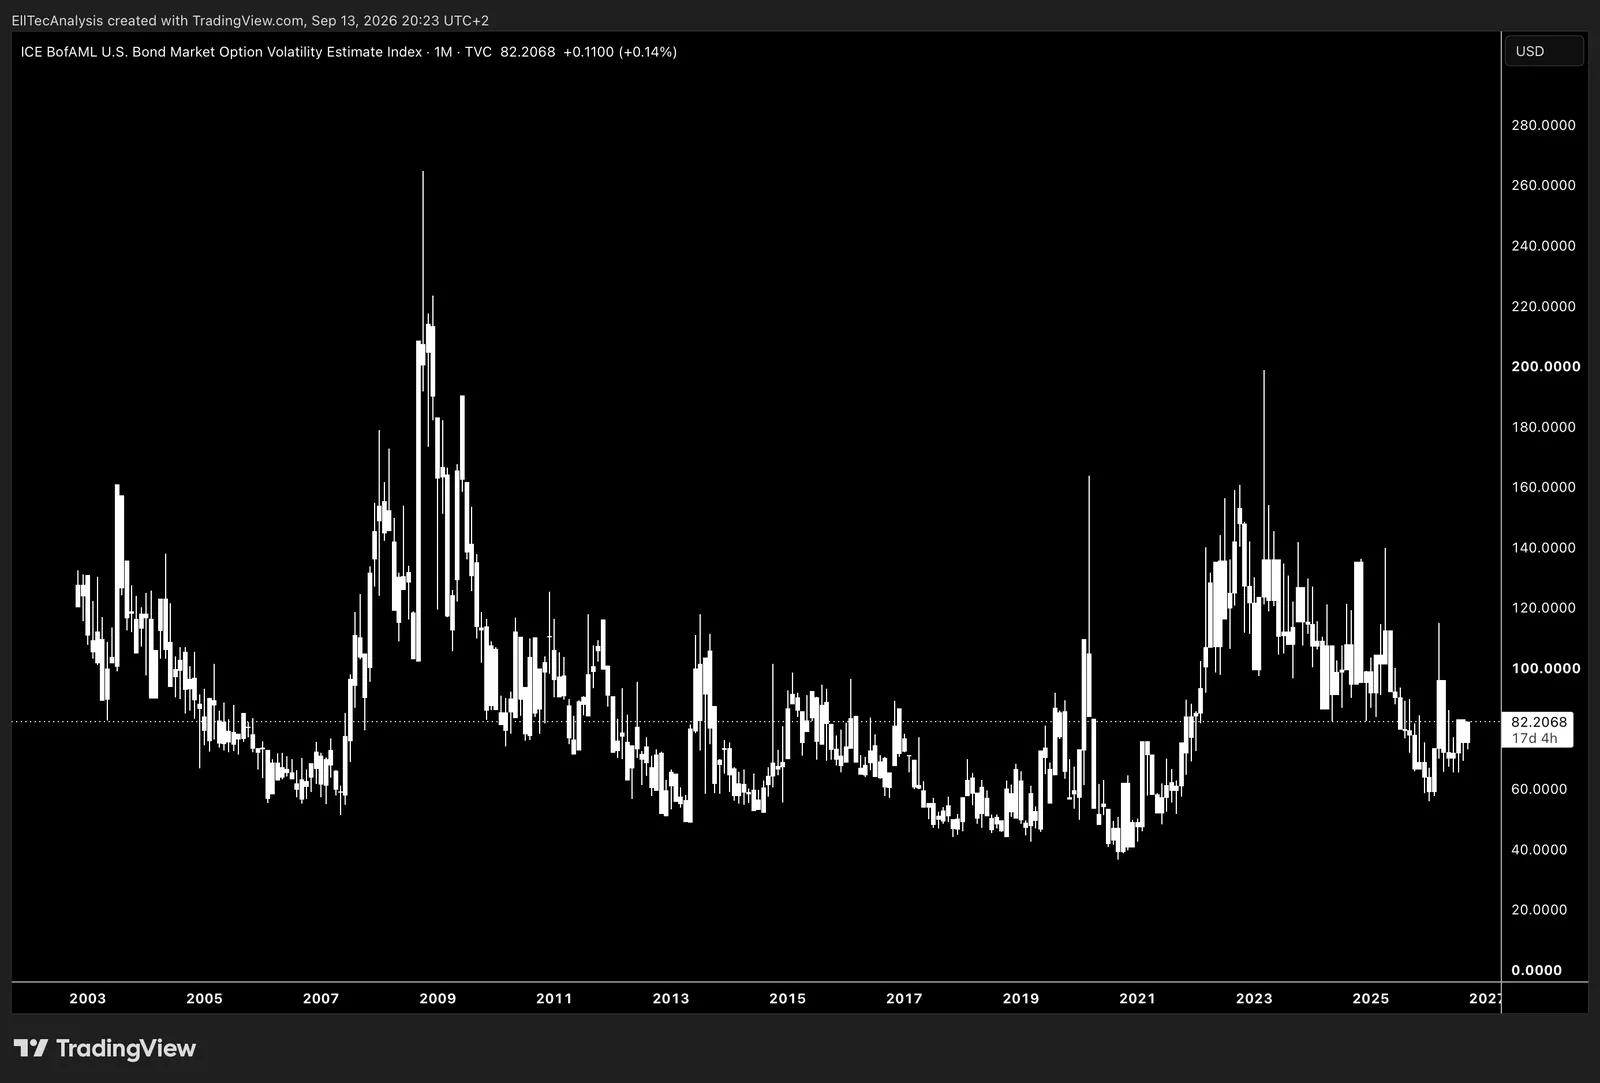
Meassure of implied volatility derived from options on Treasury futures, reflecting expected future interest-rate variability.
Credit Markets
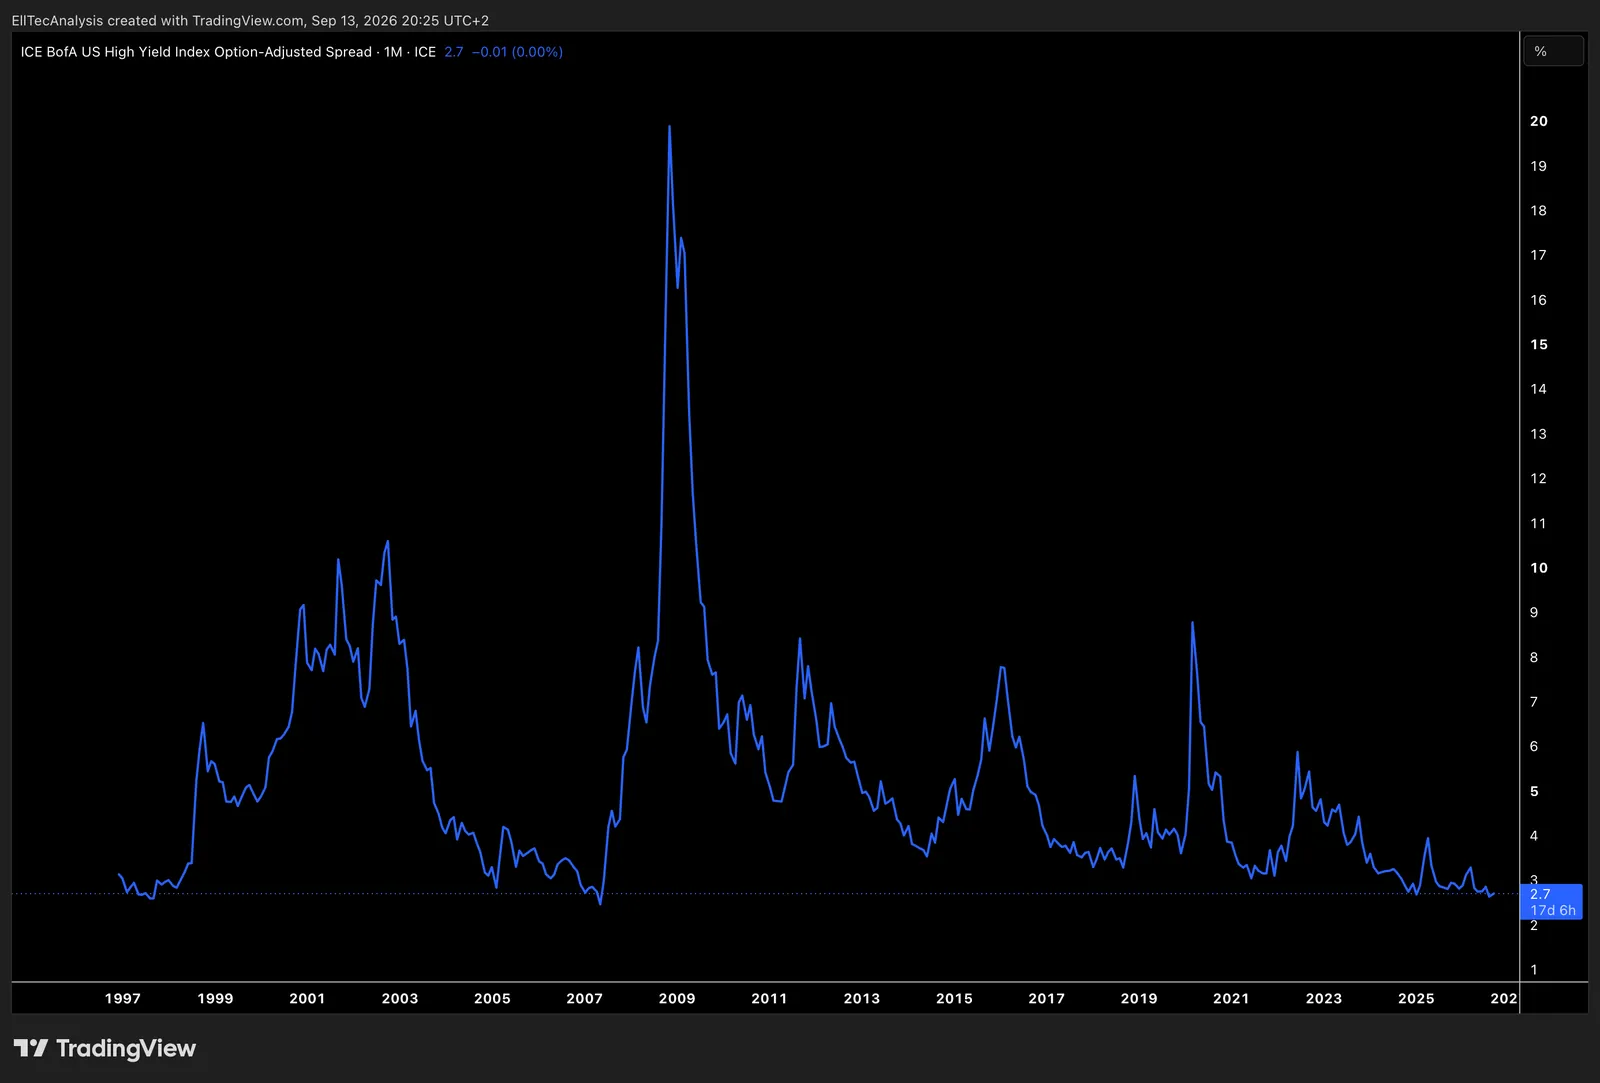
Measures the yield premium investors demand for holding high-yield (junk) bonds over comparable Treasuries after adjusting for embedded options.
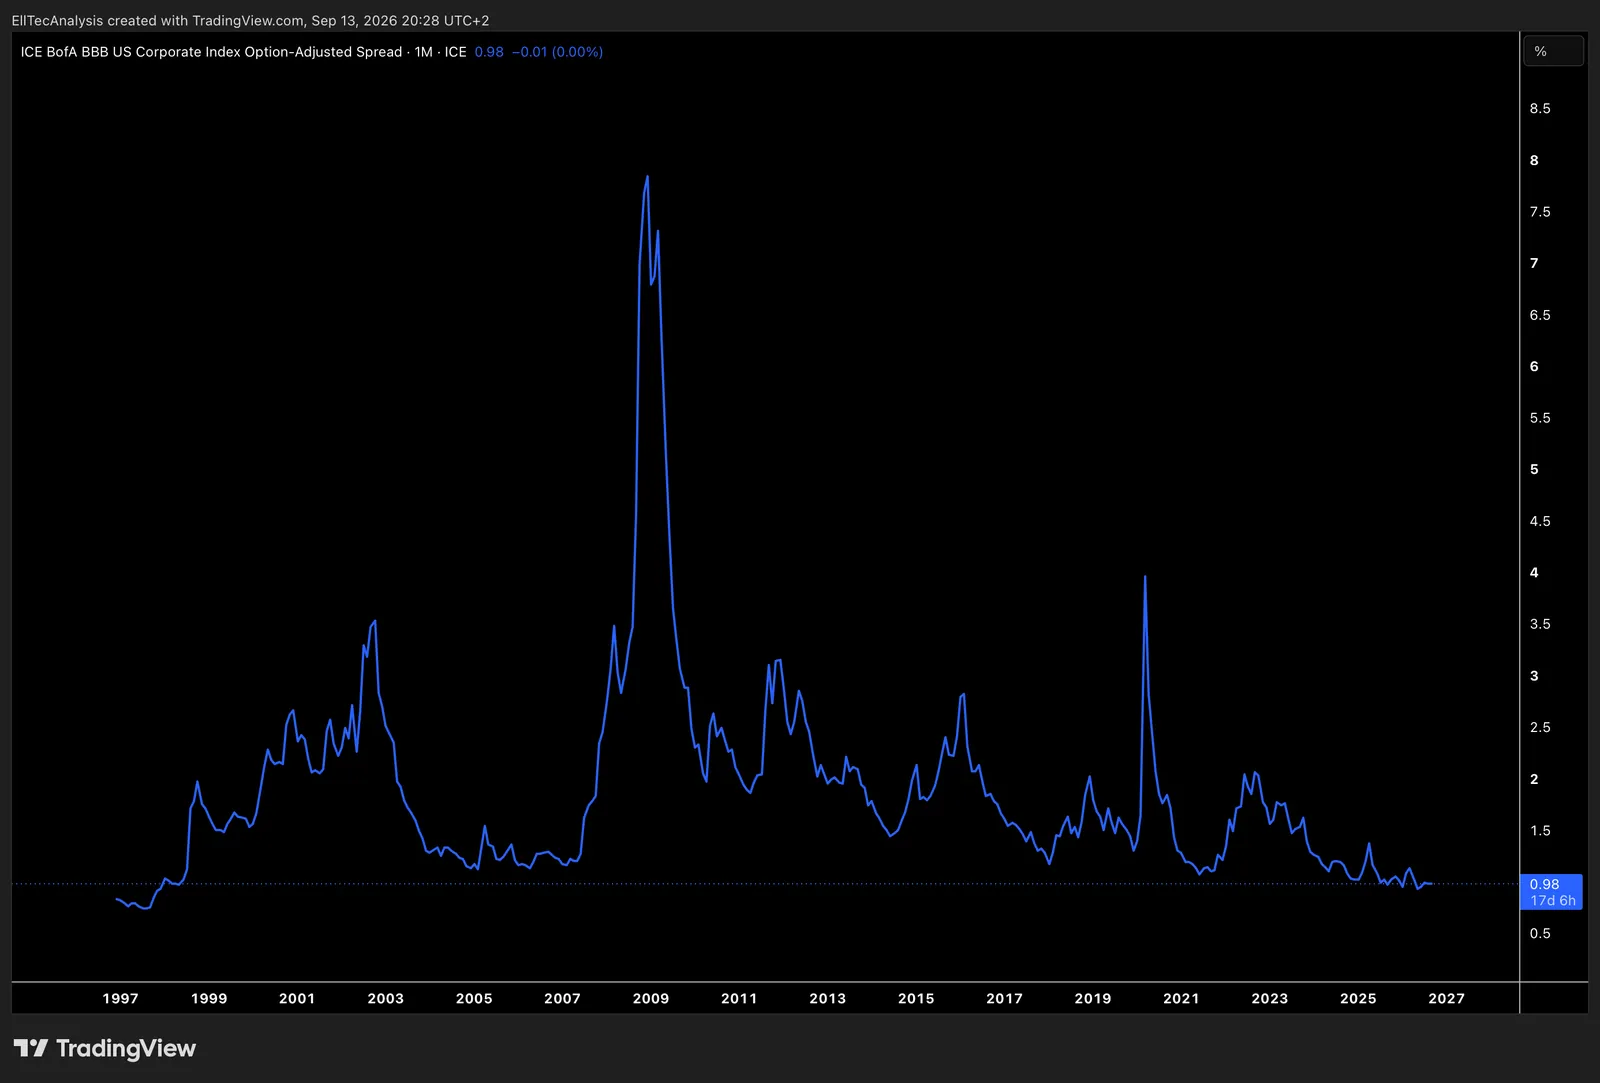
Yield premium BBB-rated corporate bonds offer over Treasuries after adjusting for embedded options.
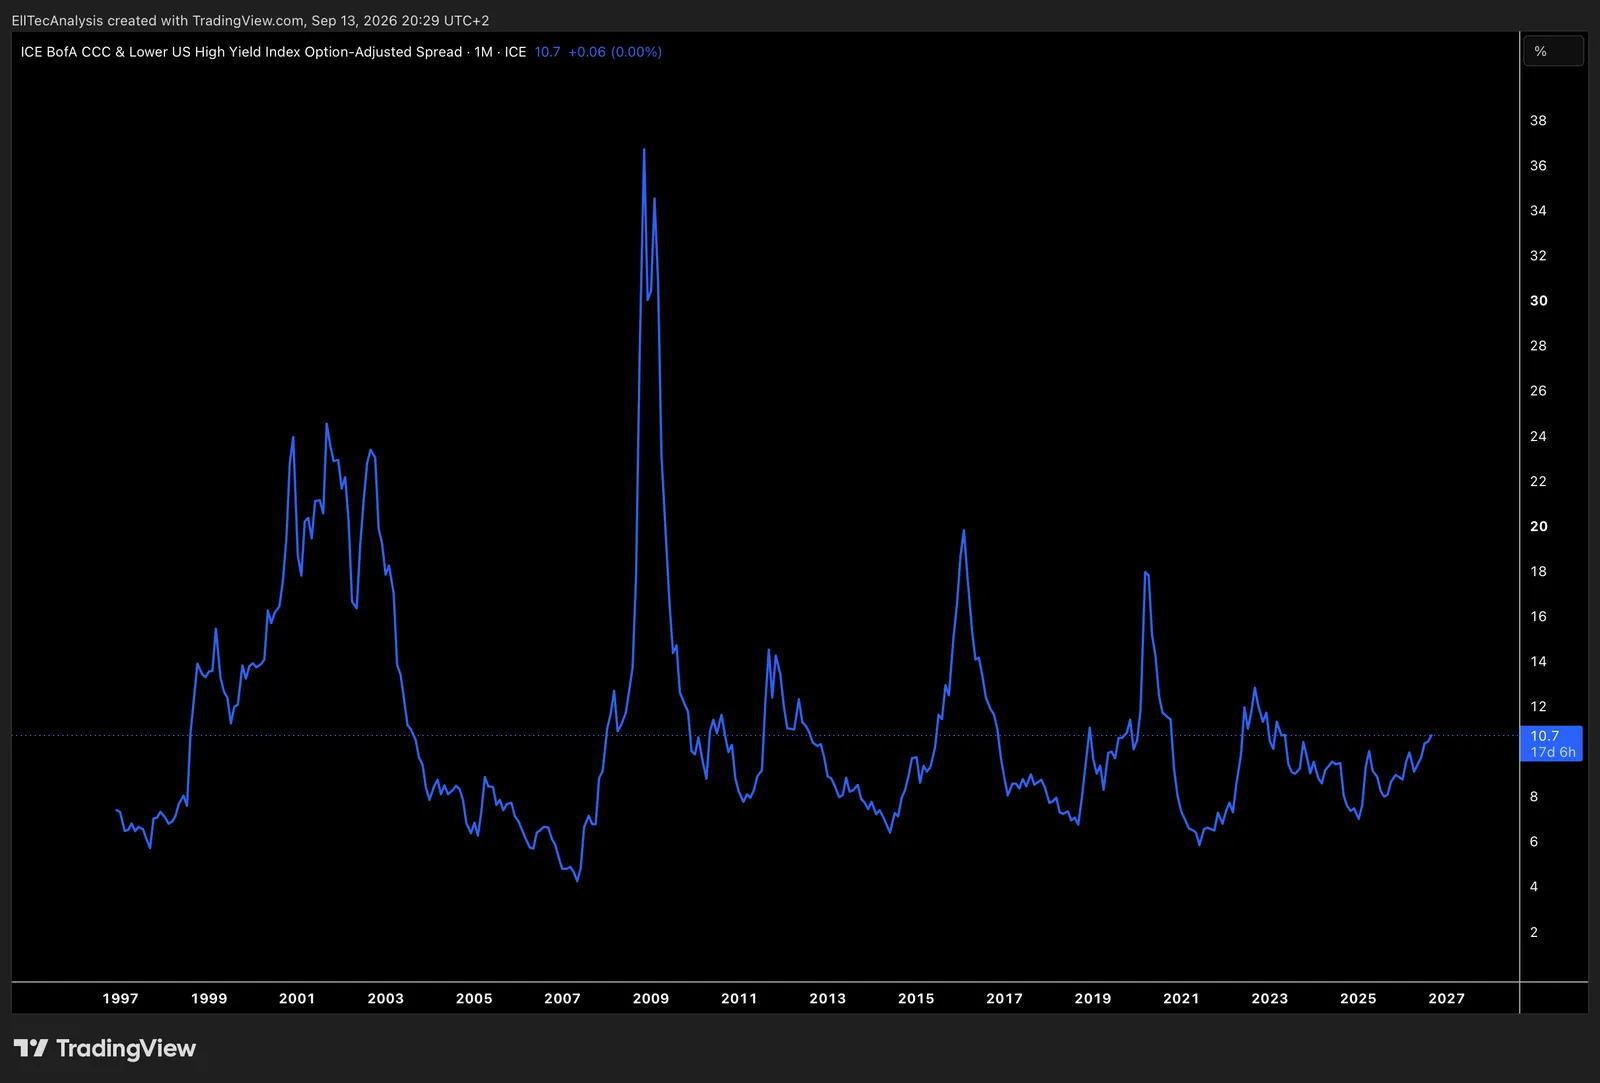
Yield premium the riskiest junk (CCC and below) offer over Treasuries after adjusting for embedded options.
Interest Rates
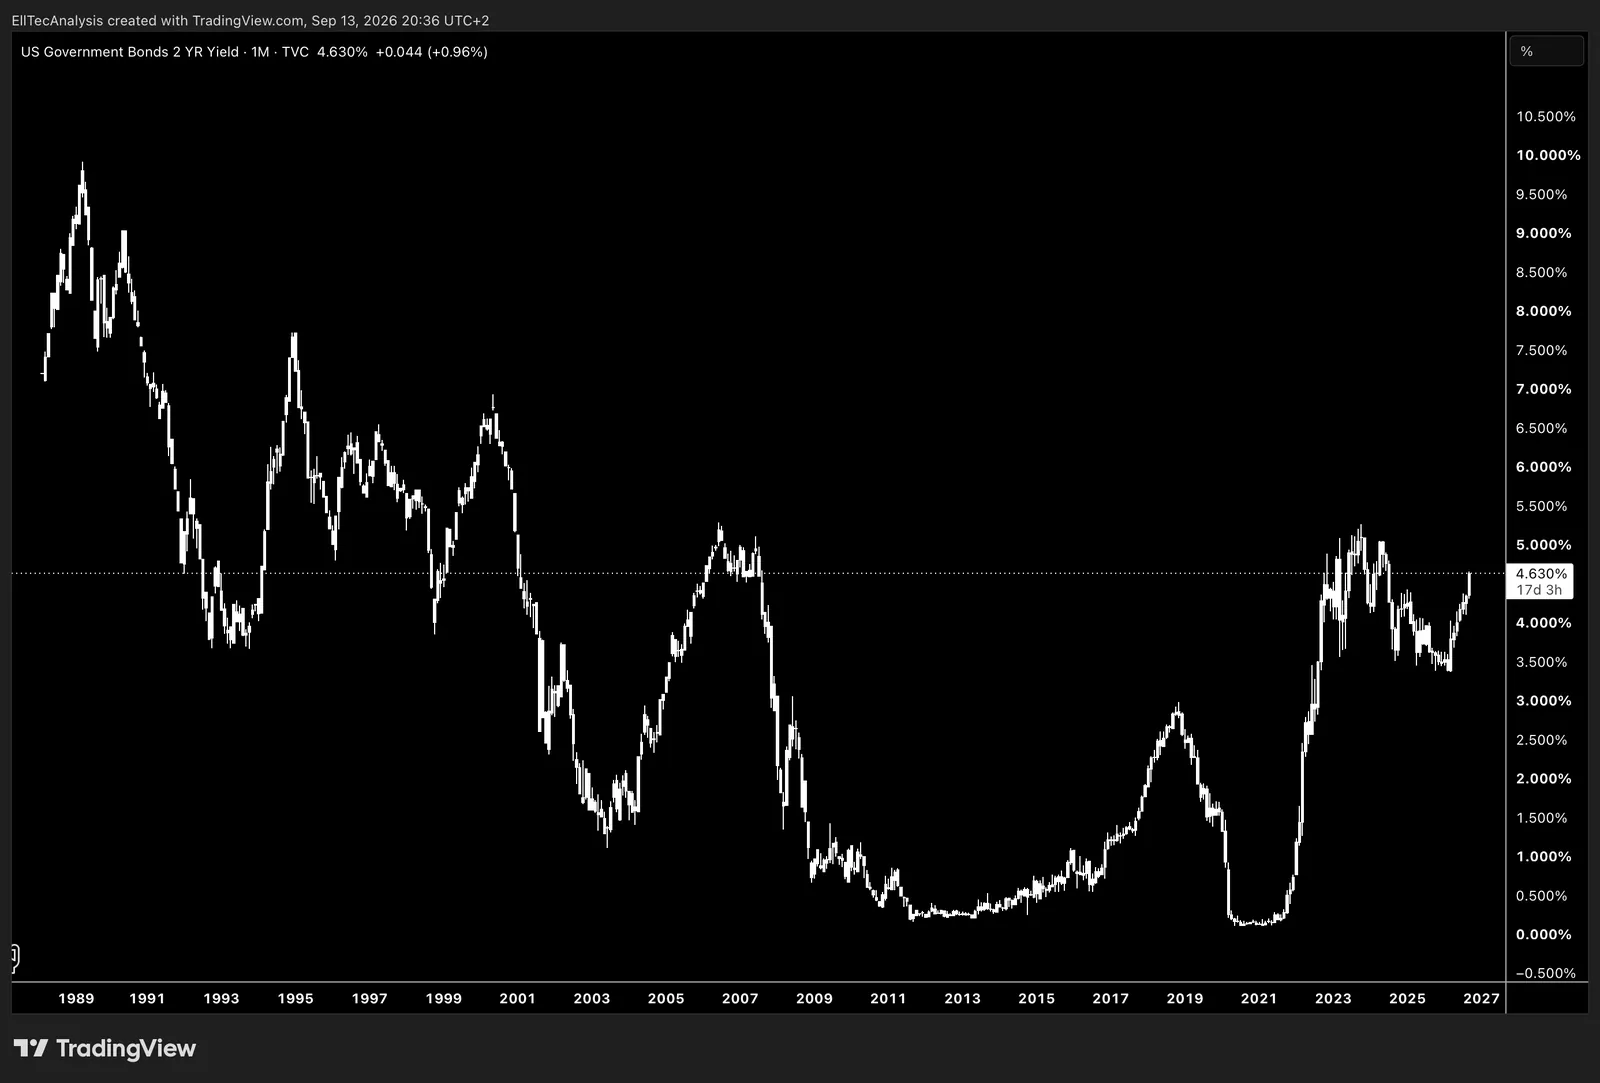
Interest rate investors demand to hold a 2-year US government bond, reflecting short-term rate expectations and FED policy outlook.
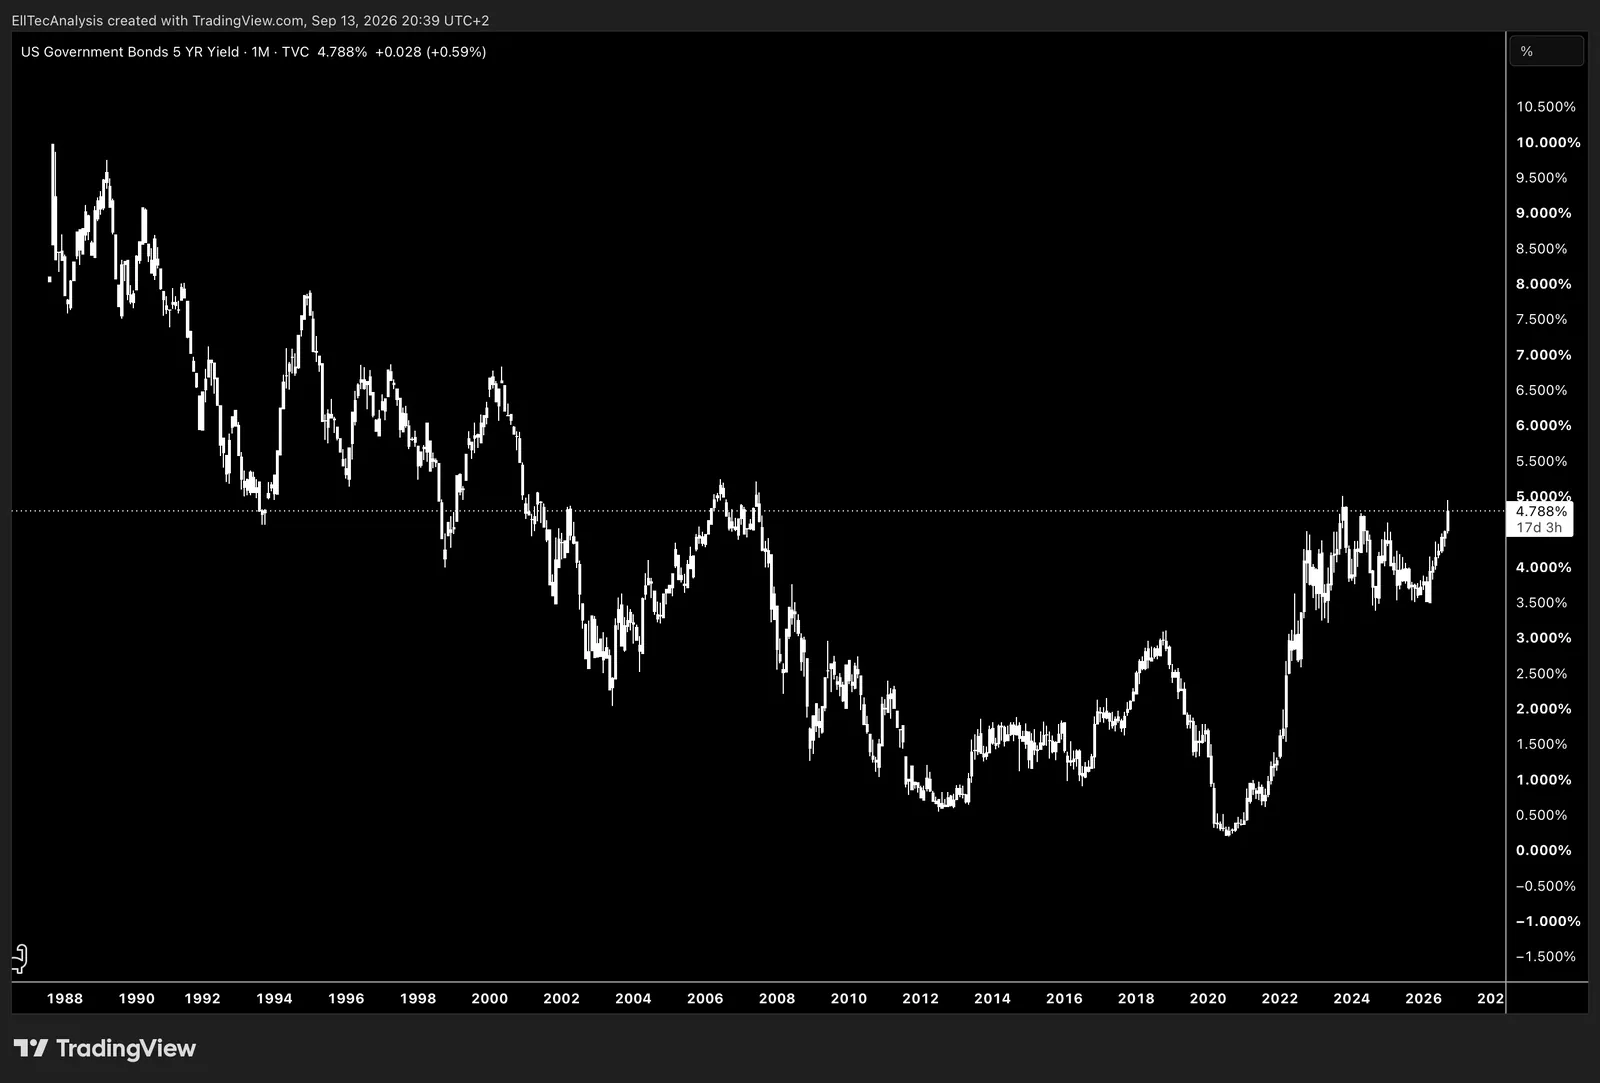
Interest rate investors demand to hold a 5-year US government bond, reflecting short-term rate expectations and FED policy outlook.
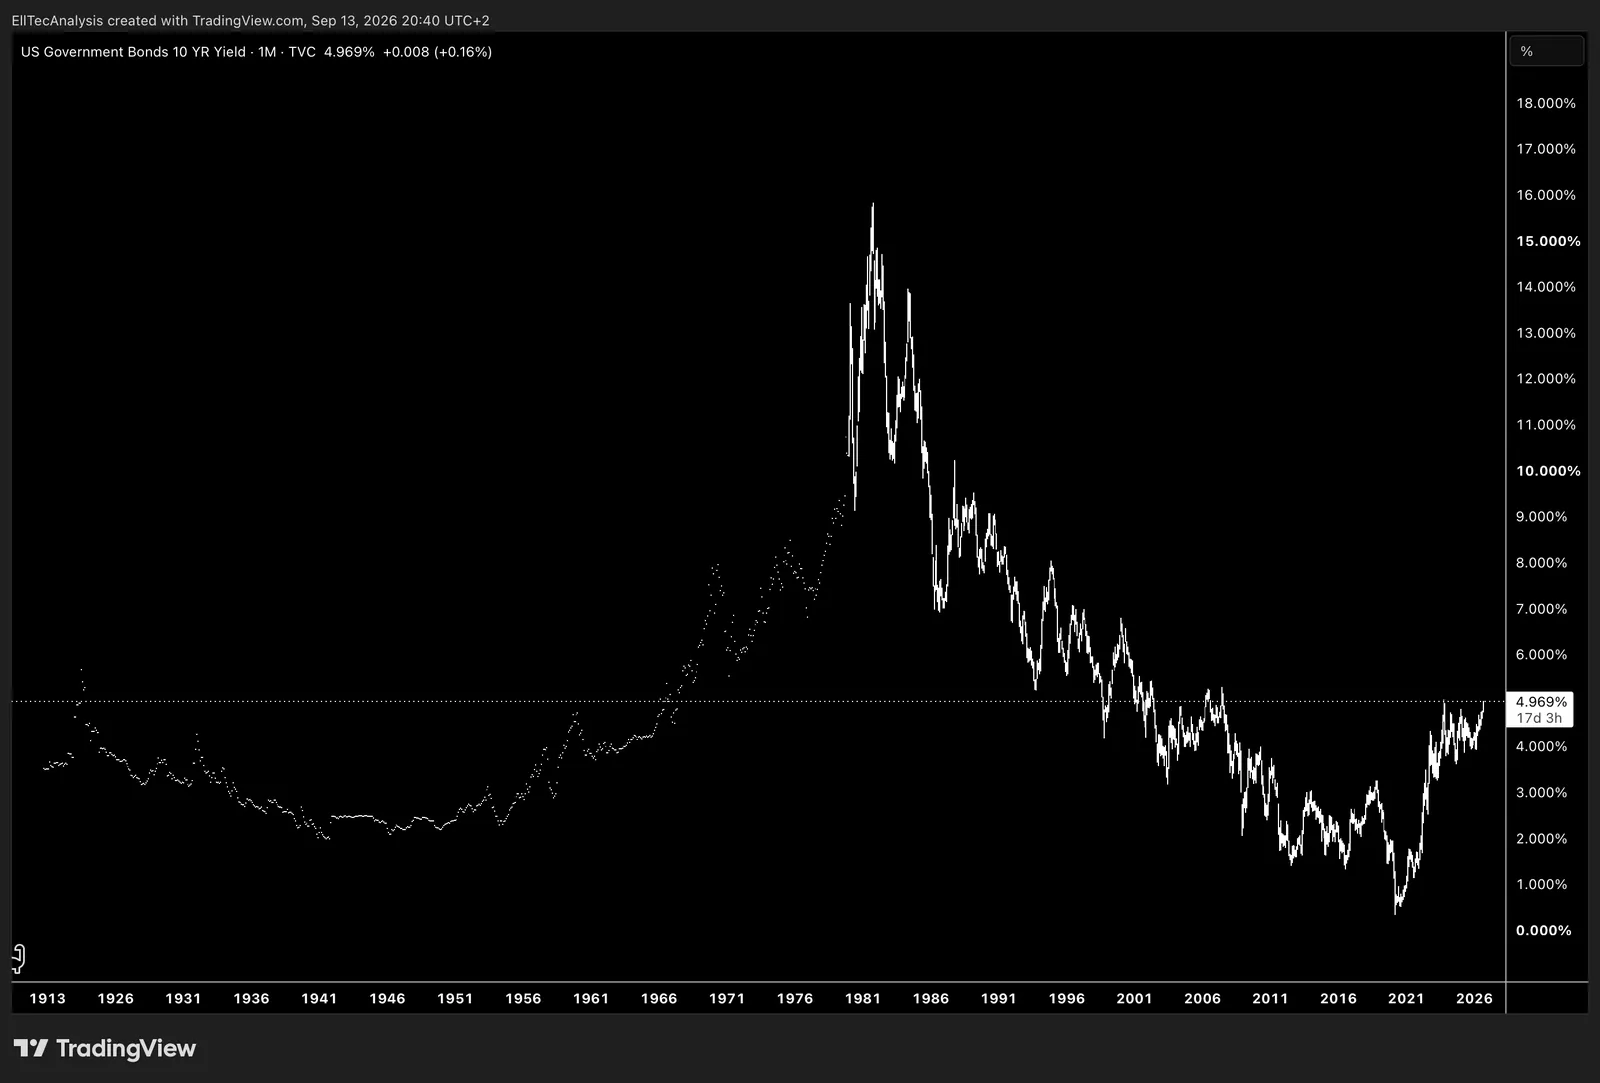
Interest rate investors demand to hold a 10-year US government bond, reflecting short-term rate expectations and FED policy outlook.
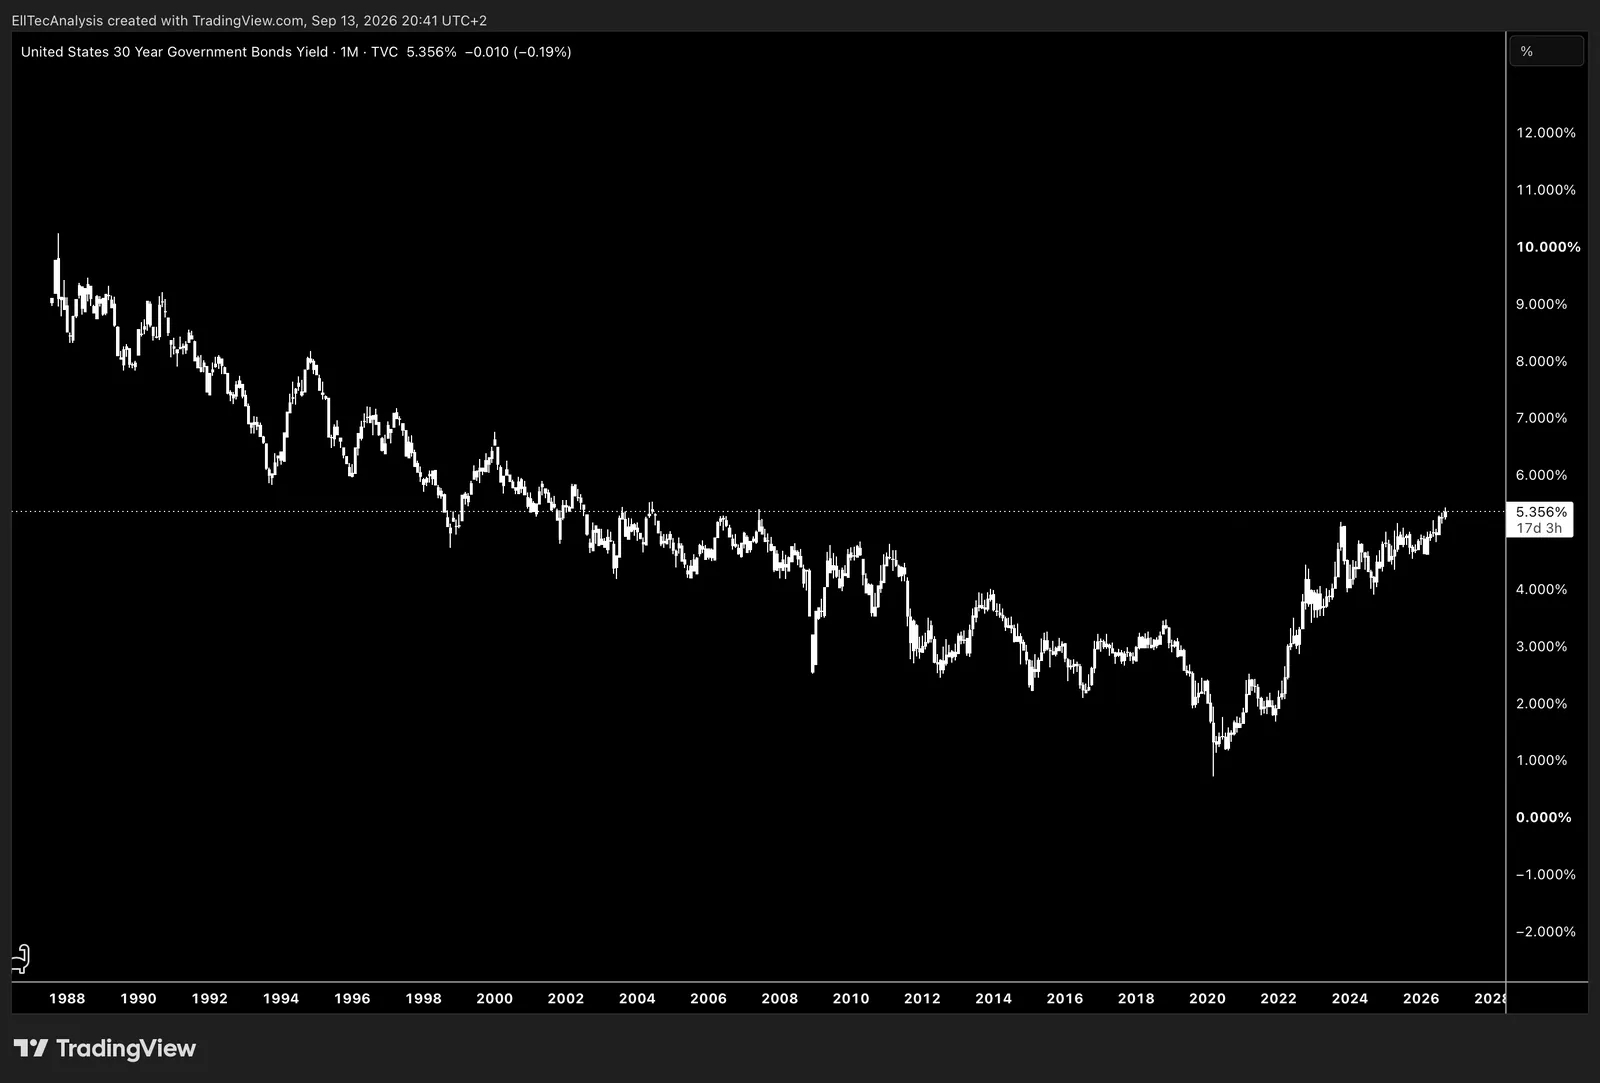
Interest rate investors demand to hold a 30-year US government bond, reflecting short-term rate expectations and FED policy outlook.
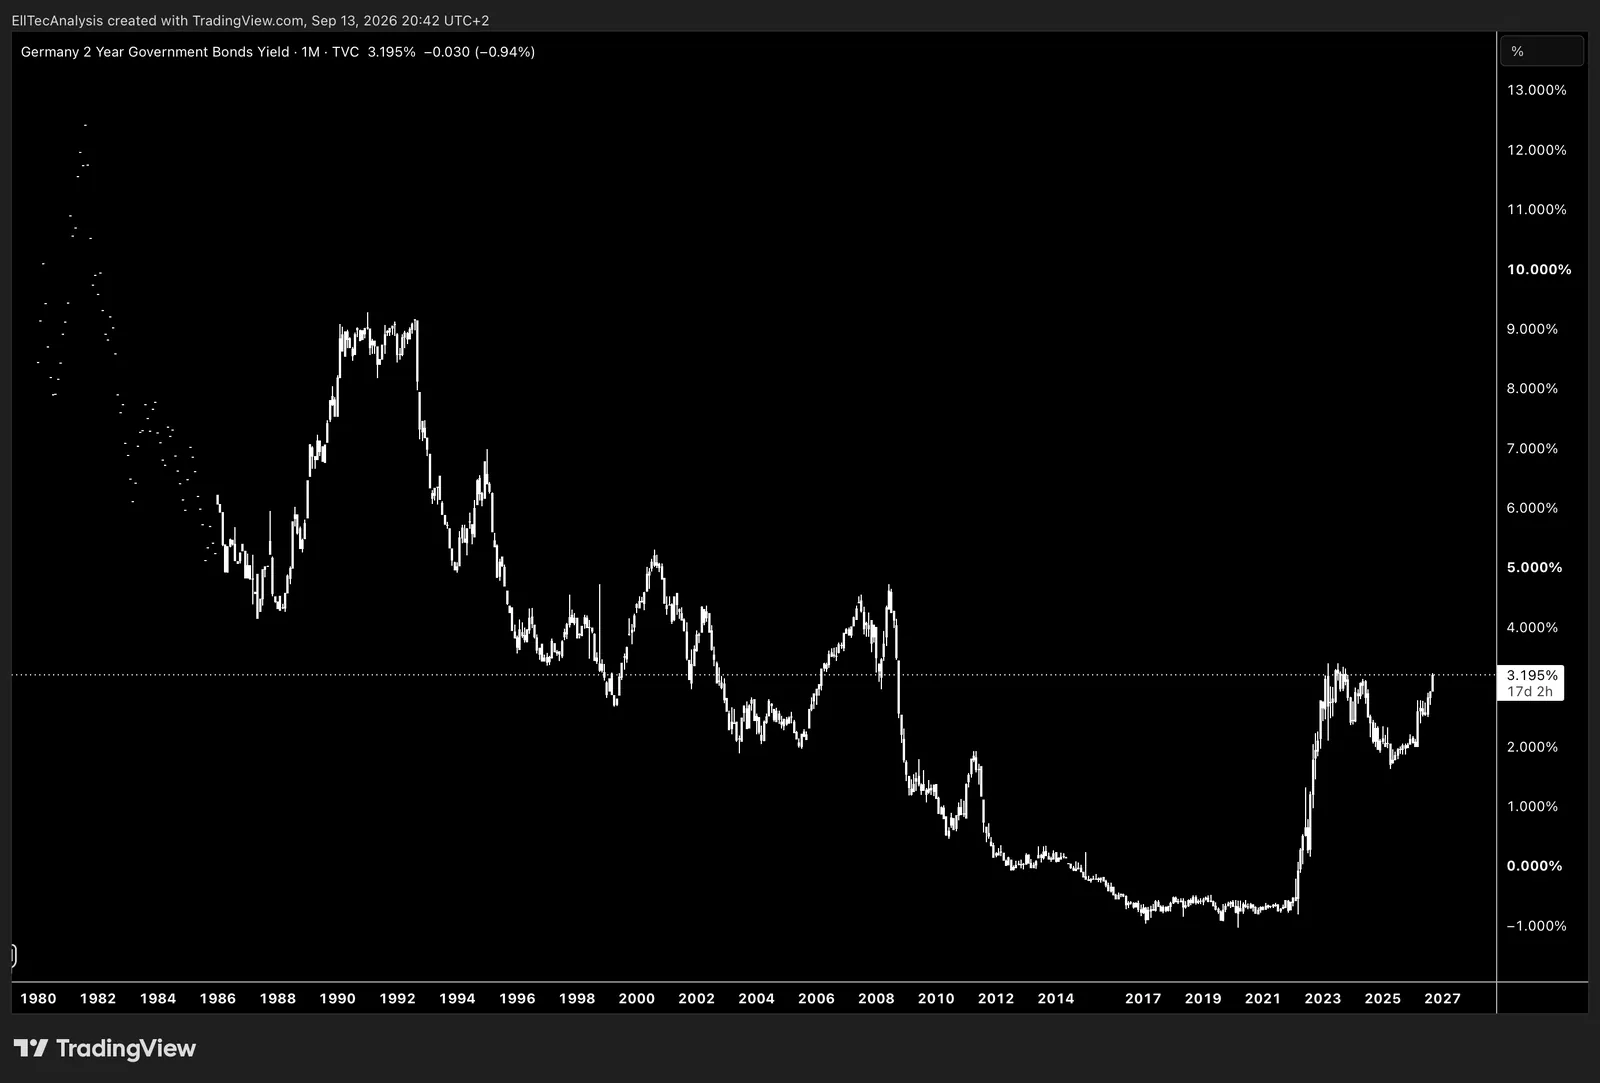
Interest rate investors demand to hold a 2-year Bund, reflecting ECB policy expectations and short-term euro-area rate sentiment.
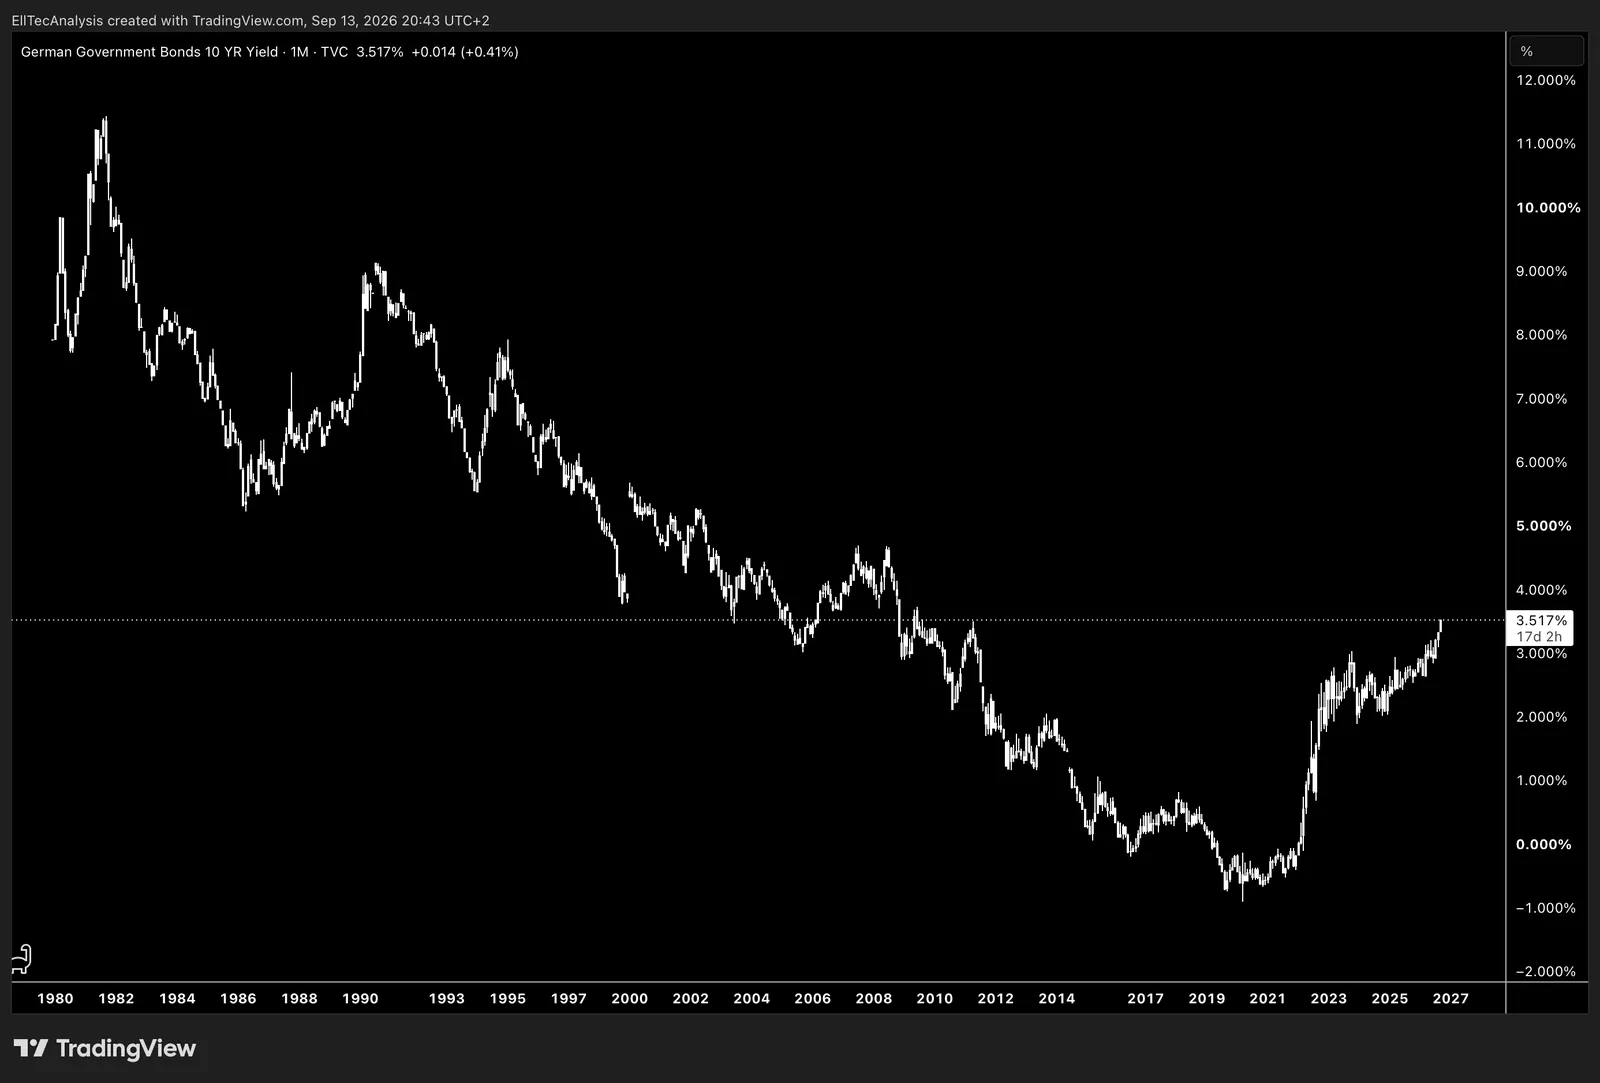
Interest rate investors demand to hold a 10-year Bund, reflecting ECB policy expectations and short-term euro-area rate sentiment.
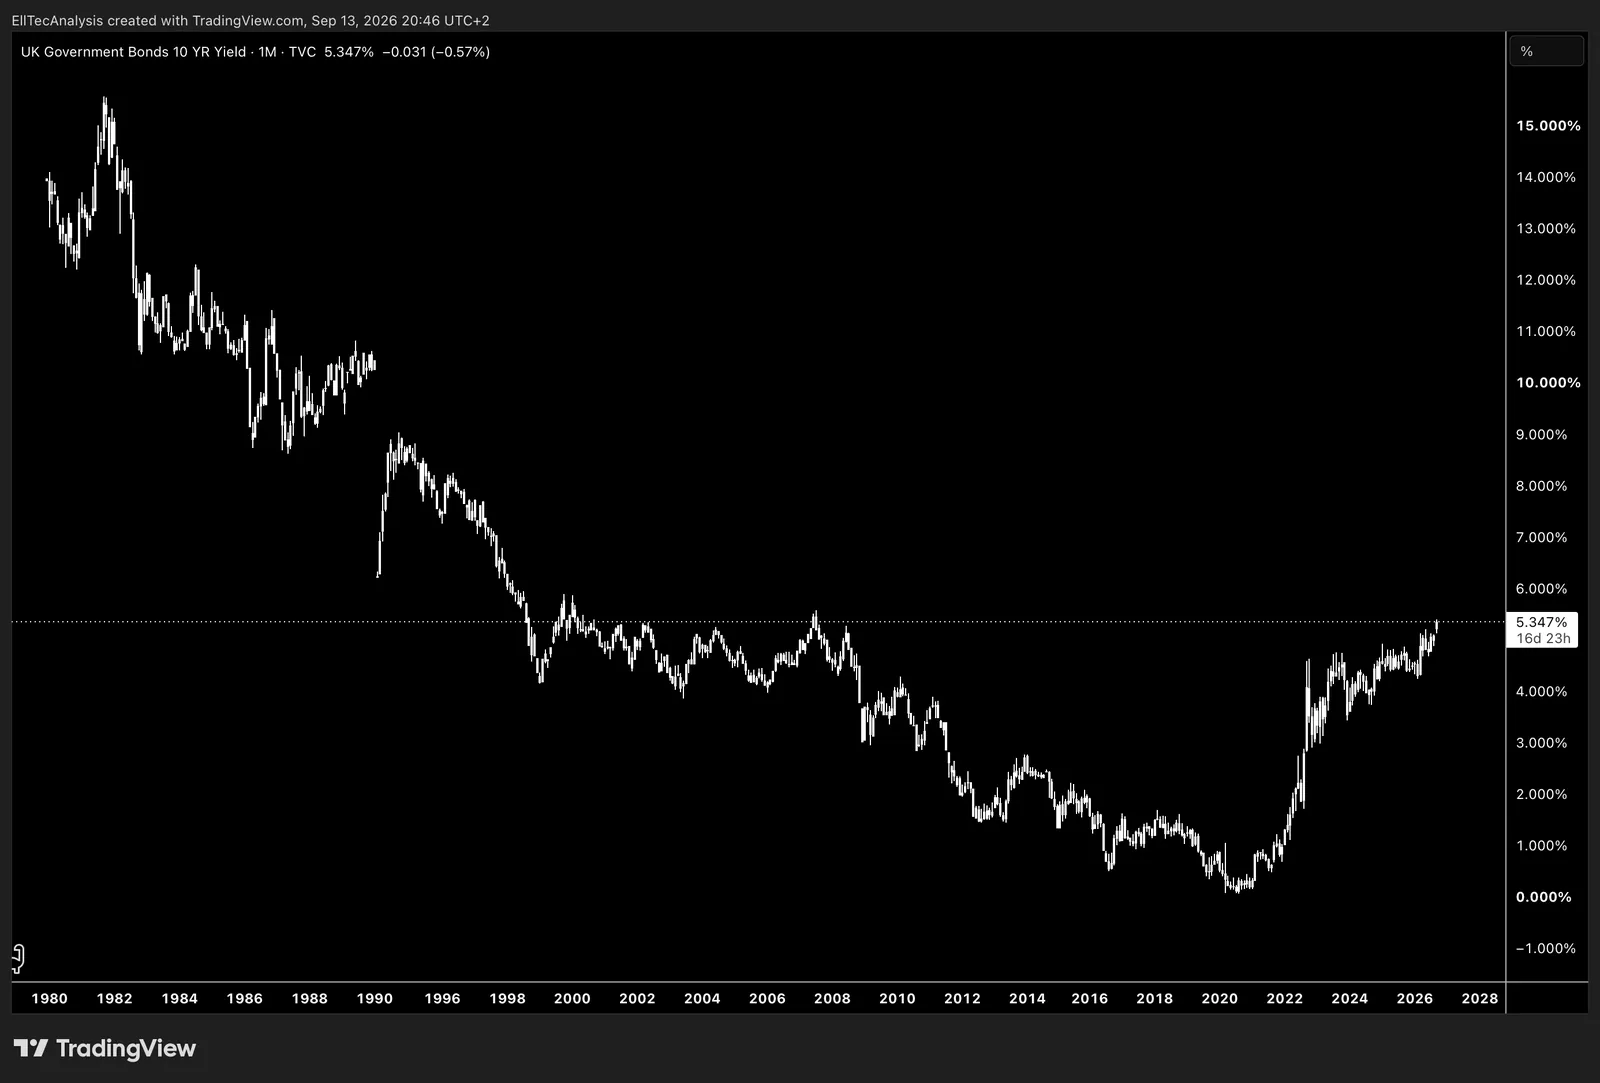
Interest rate investors demand to hold a 10-year gilt, reflecting long-term expectations for Bank of England policy, inflation and economic growth.
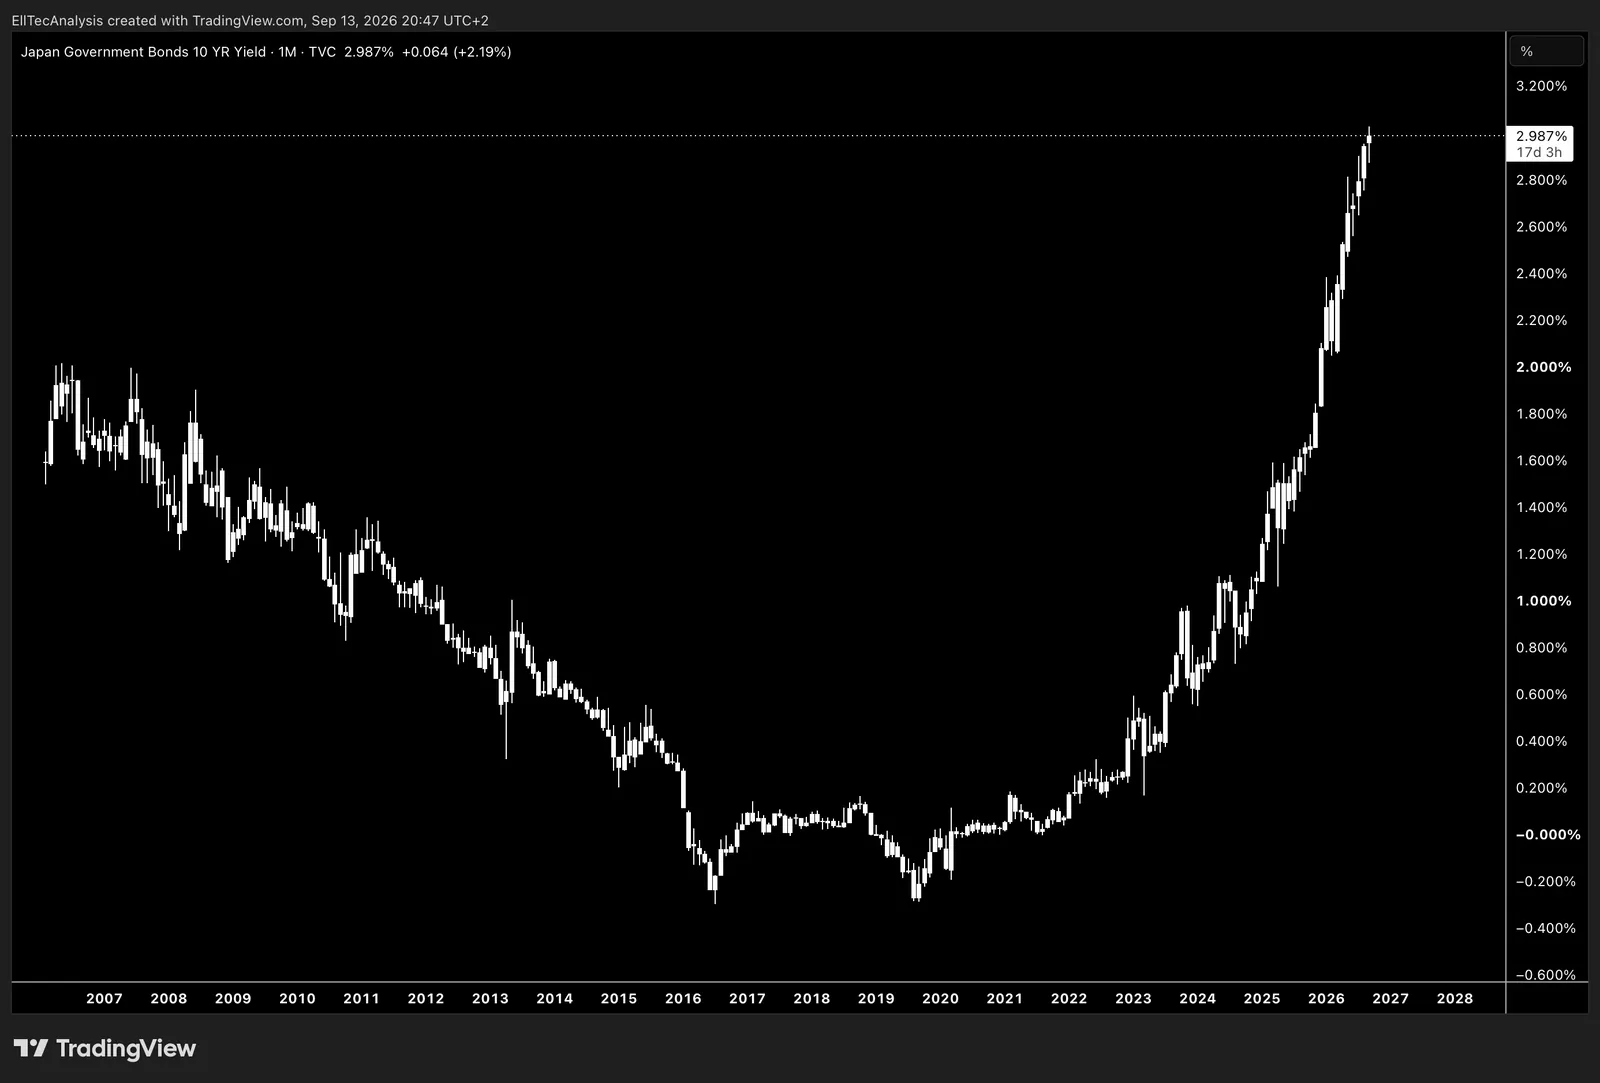
Interest rate investors require to hold a 10-year JGB, reflecting Bank of Japan policy stance and long-term inflation expectations.
Yield Curve
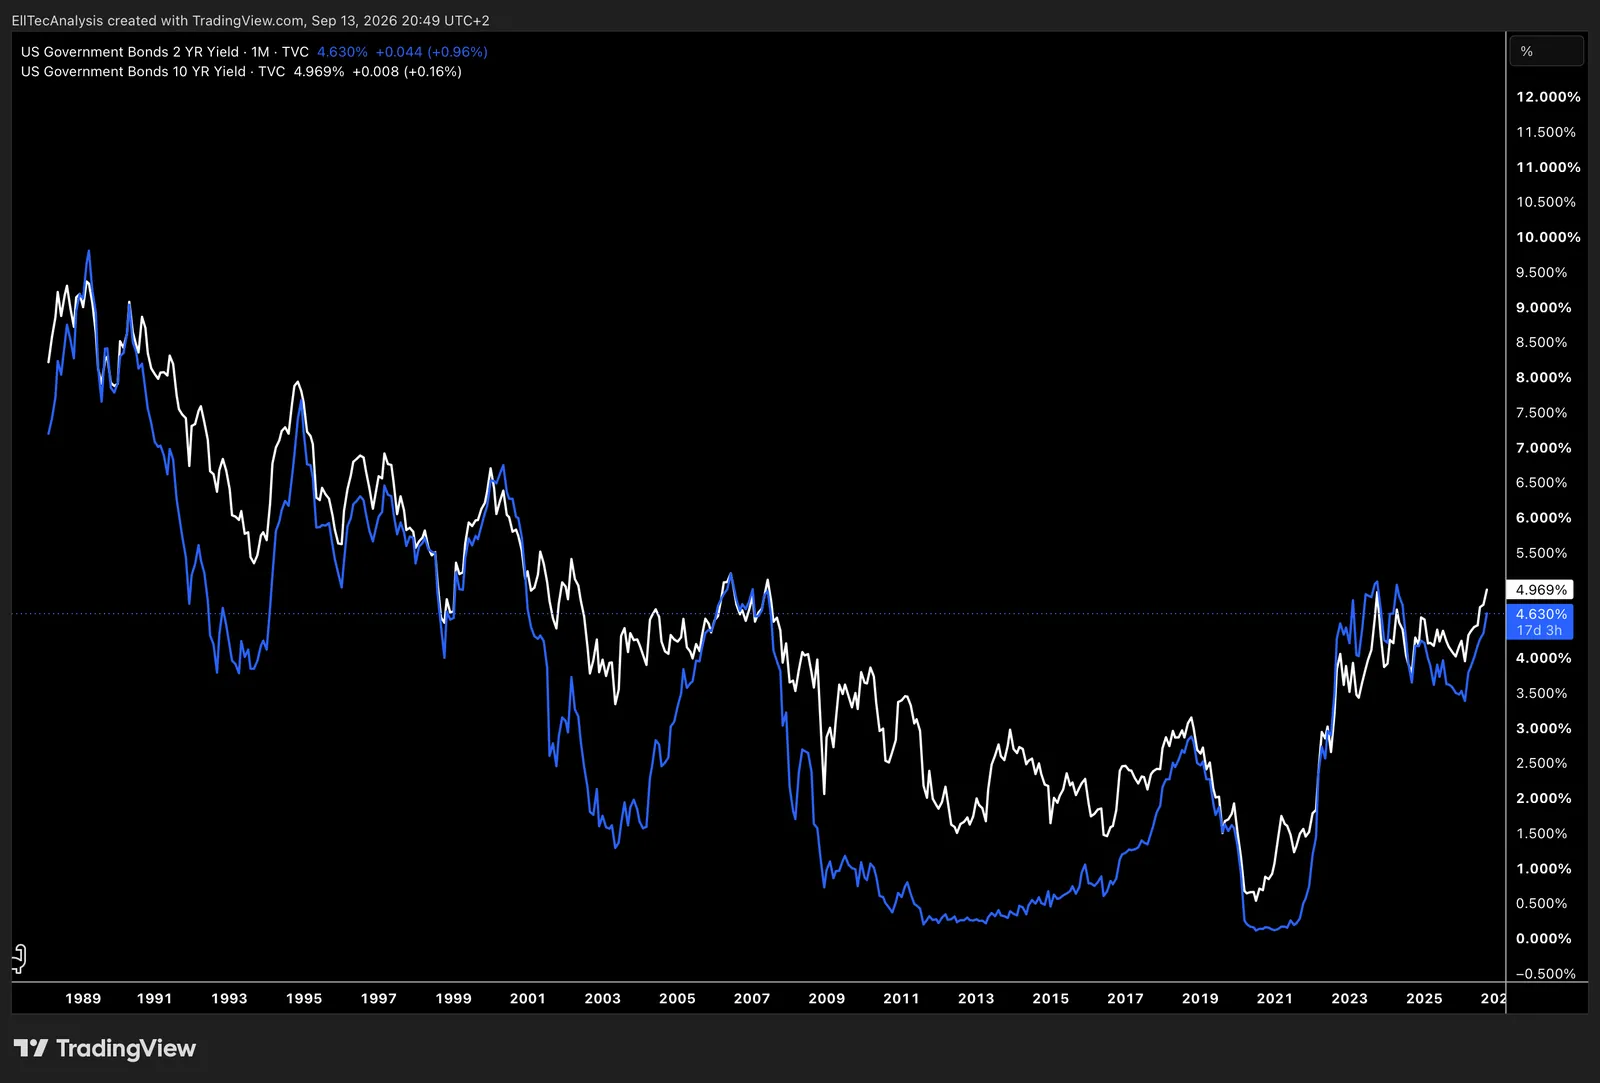
Shows the Treasury spread between 2-year and 10-year government bonds, widely used to gauge curve steepness and recession risk.
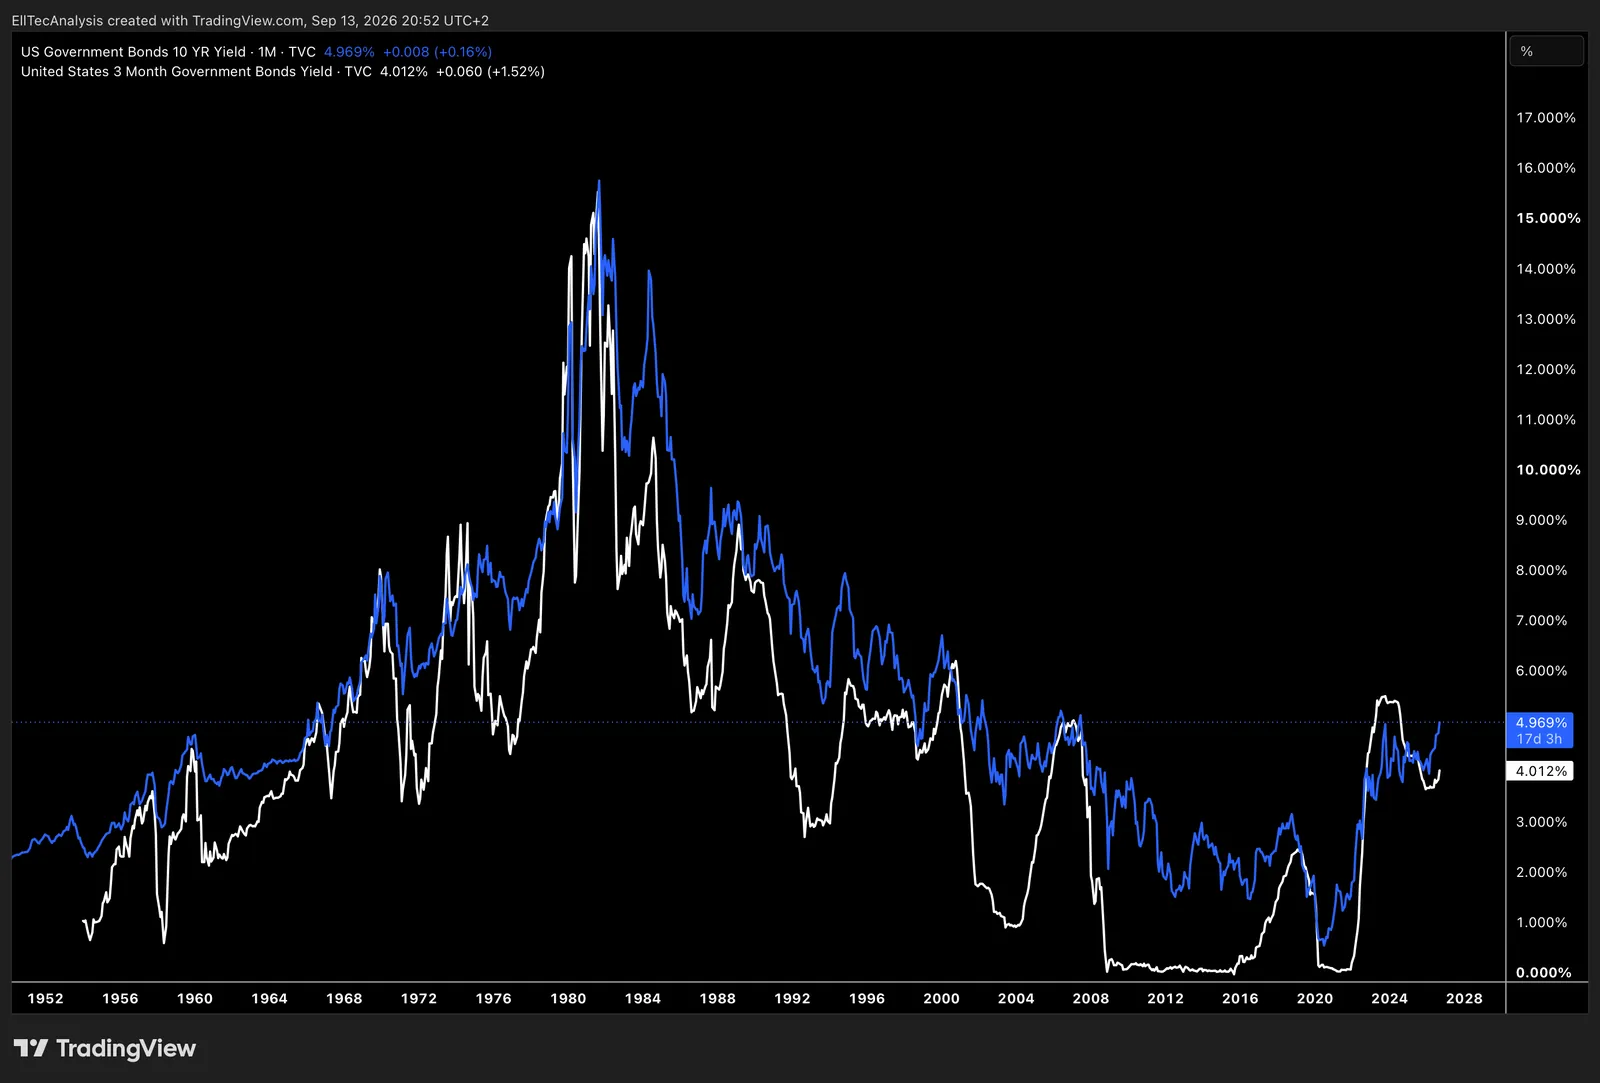
Shows the Treassury spread between long-term (10 years) and ultra-short-term (3 months) government bonds, widely used as the strongest recession-signal curve indicator.
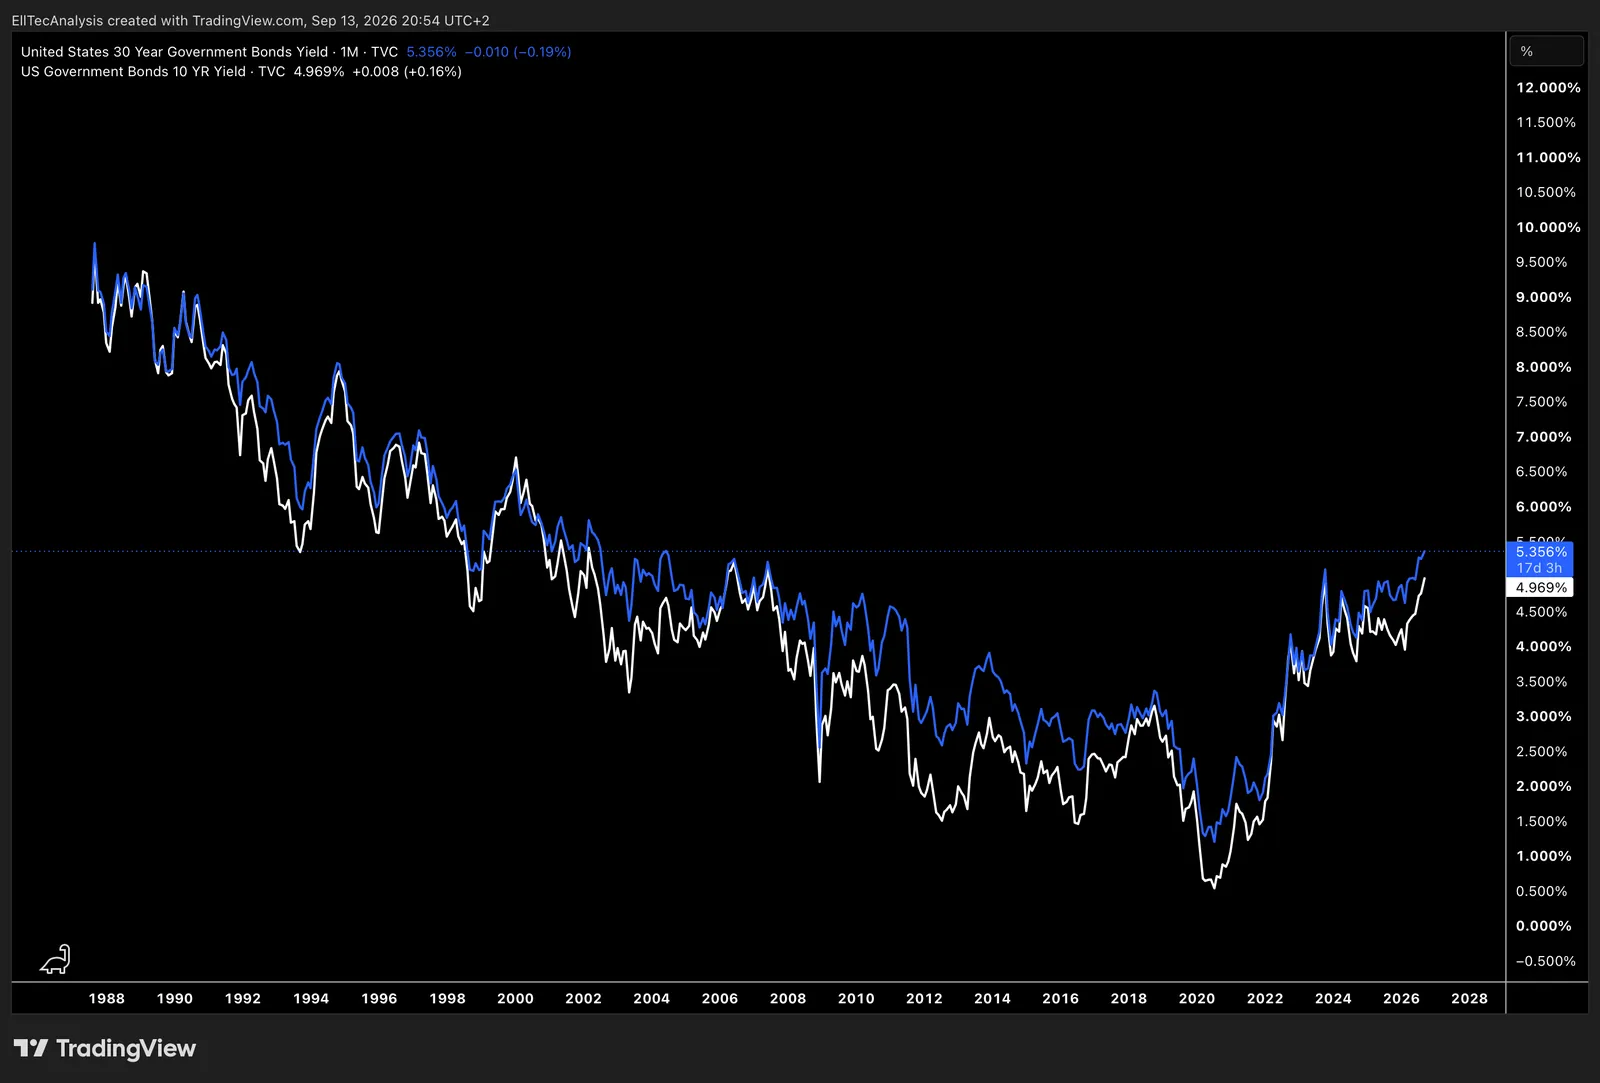
Spread difference between 30 years and 10 years government bonds, used to assess the very long-end steepness of the yield curve.
Inflation
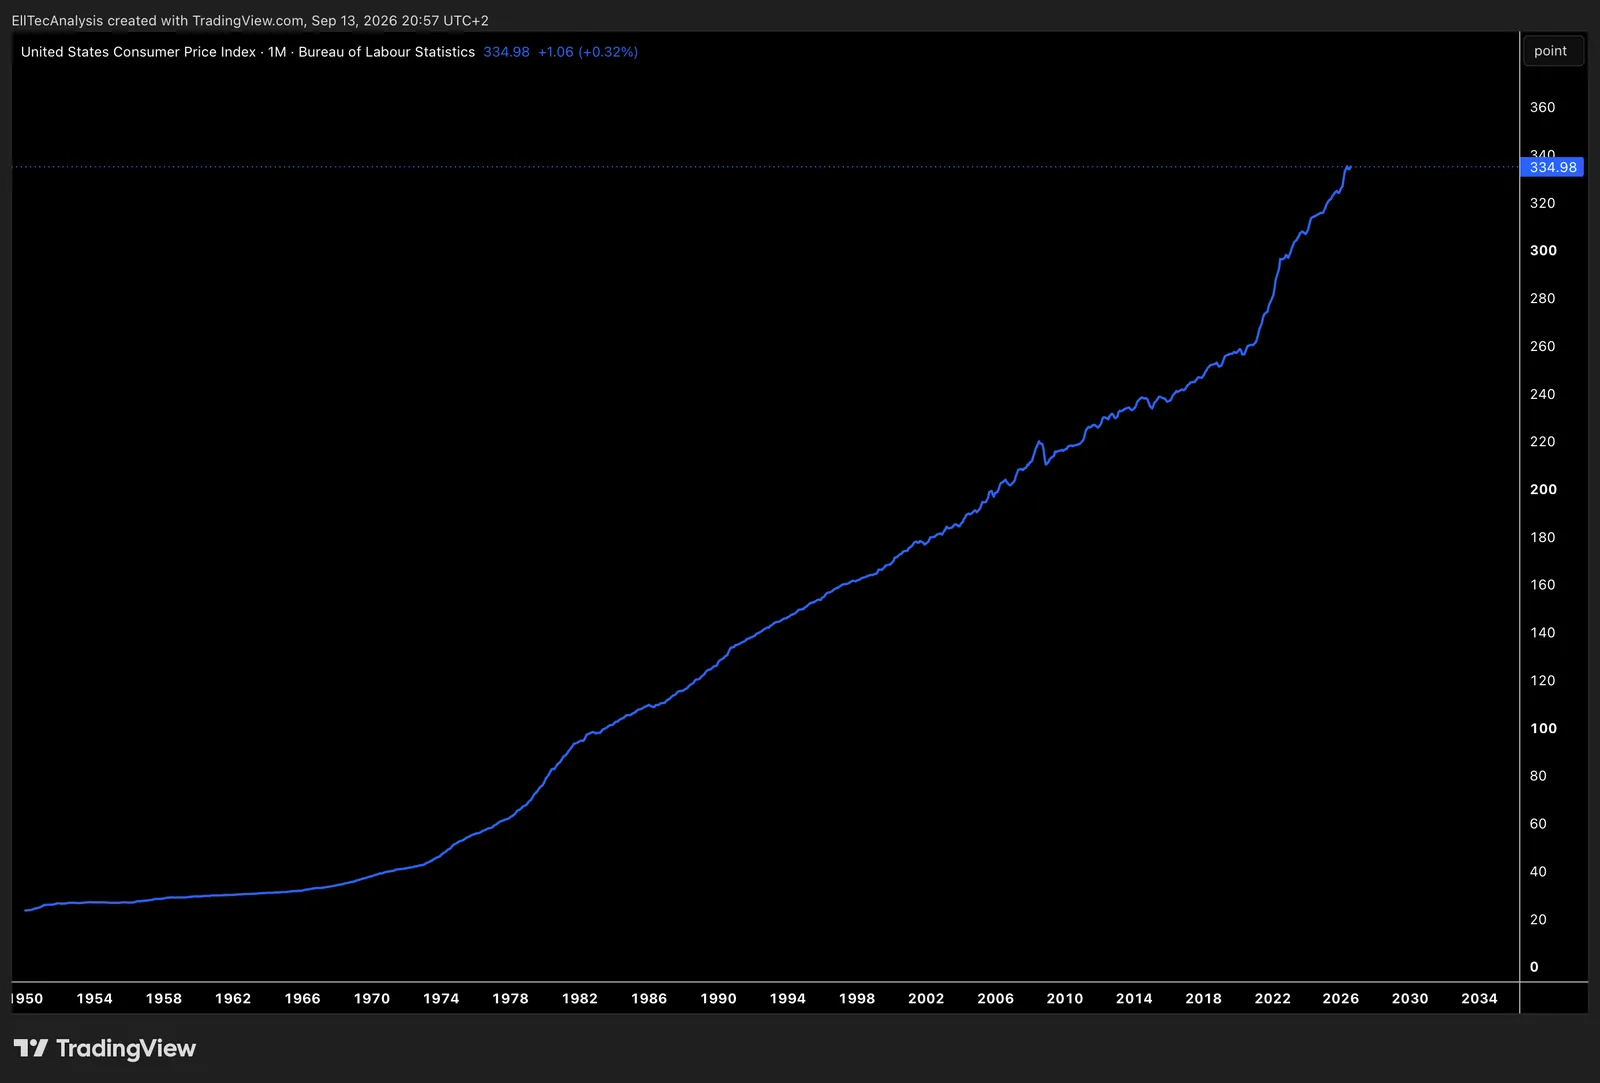
Measures average price change of goods and services purchased by urban consumern; key gauge of consumer inflation in the US.
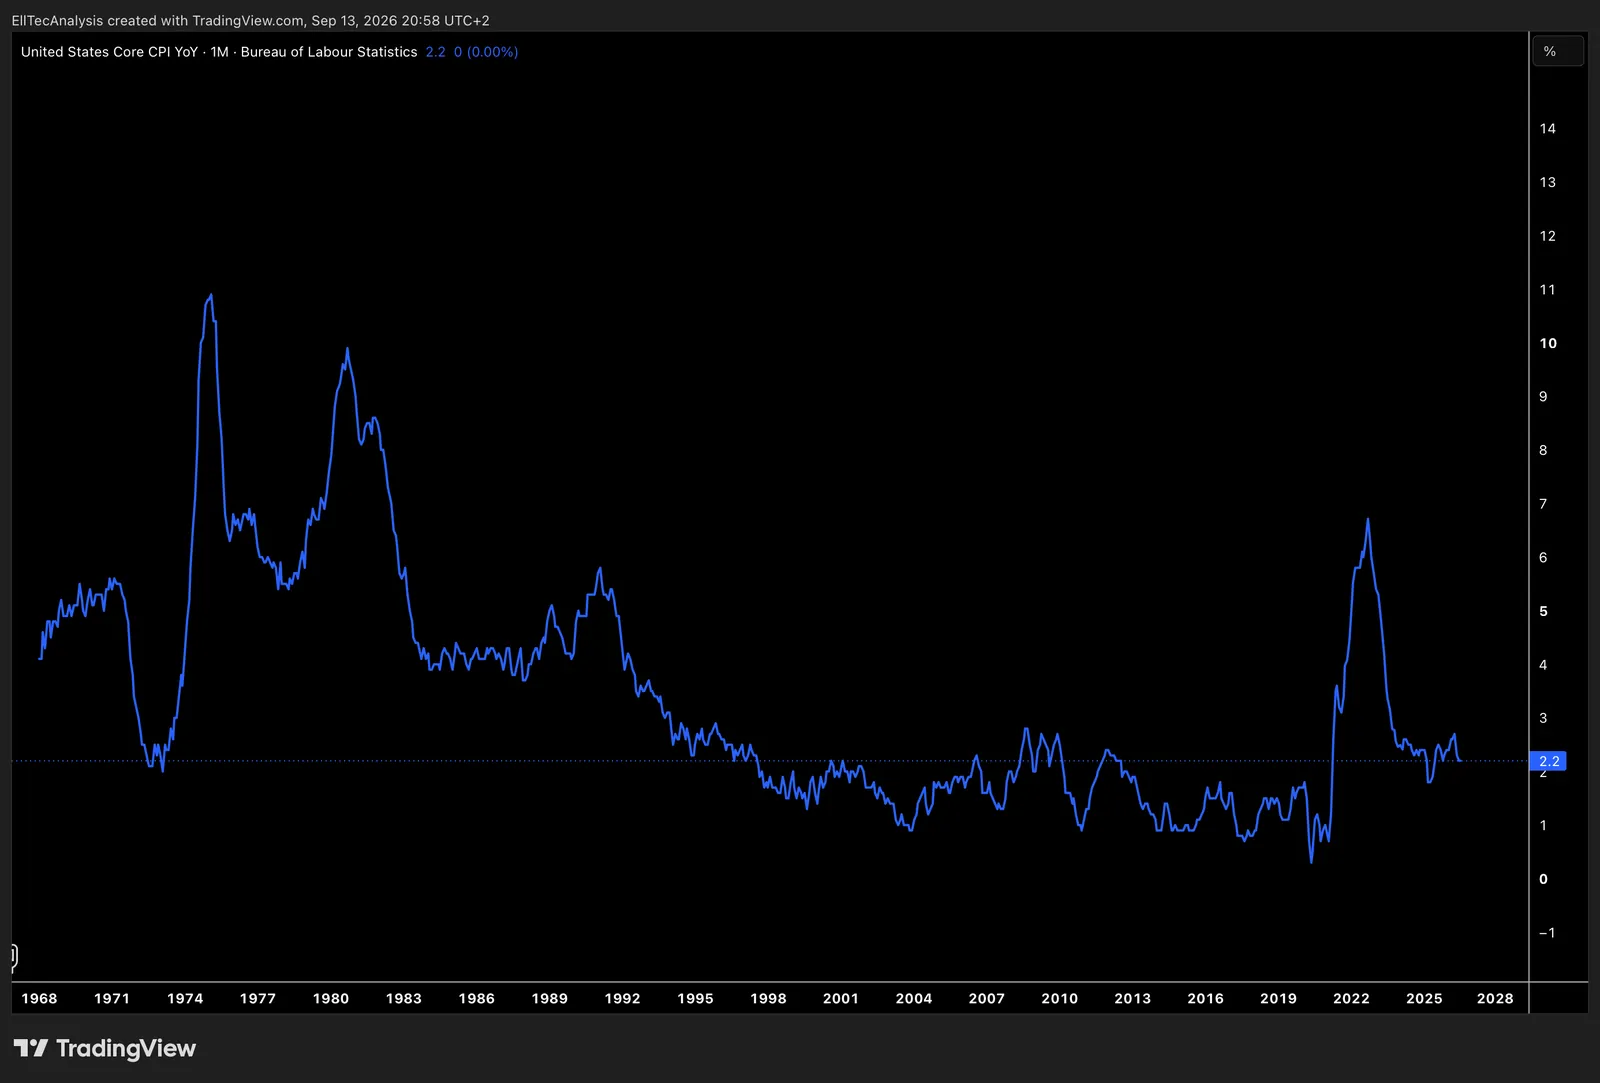
Measures the average price change of consumer goods and services excluding food and energy, providing a cleaner view of underlying inflation trends.
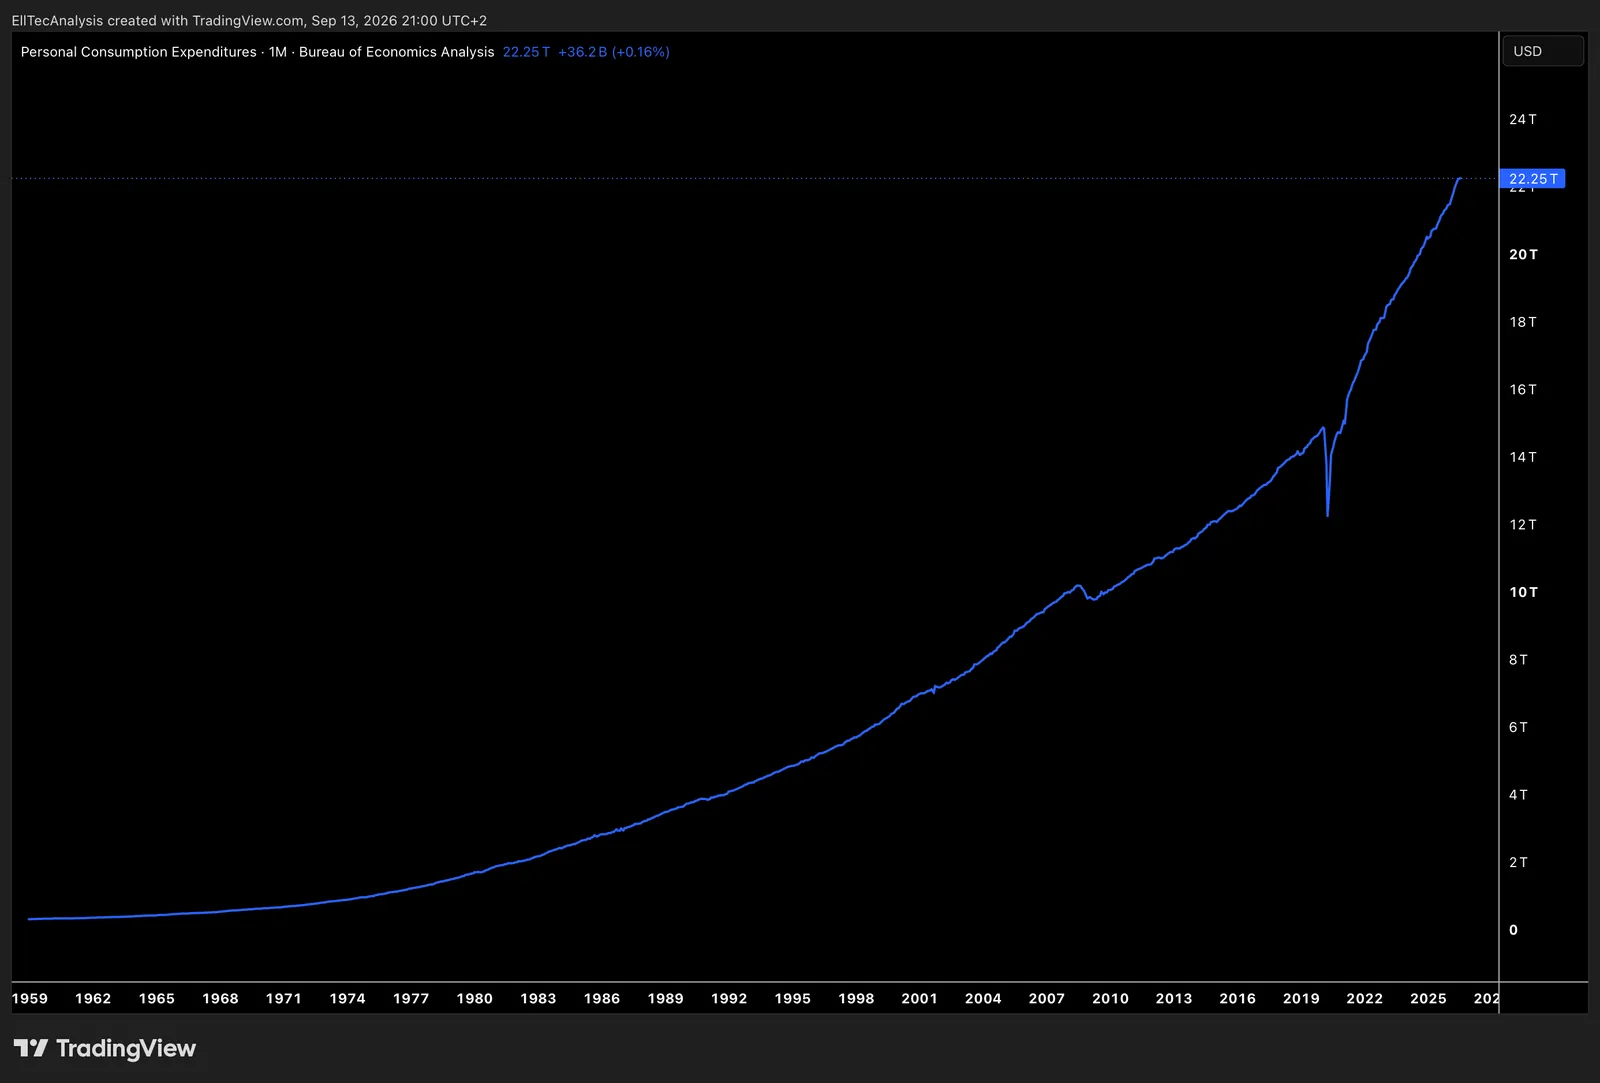
Measures the average price change of goods and services consumed by households, and is the Federal Reserve`s preferred inflation gauge because it captures broader spending patterns than CPI.
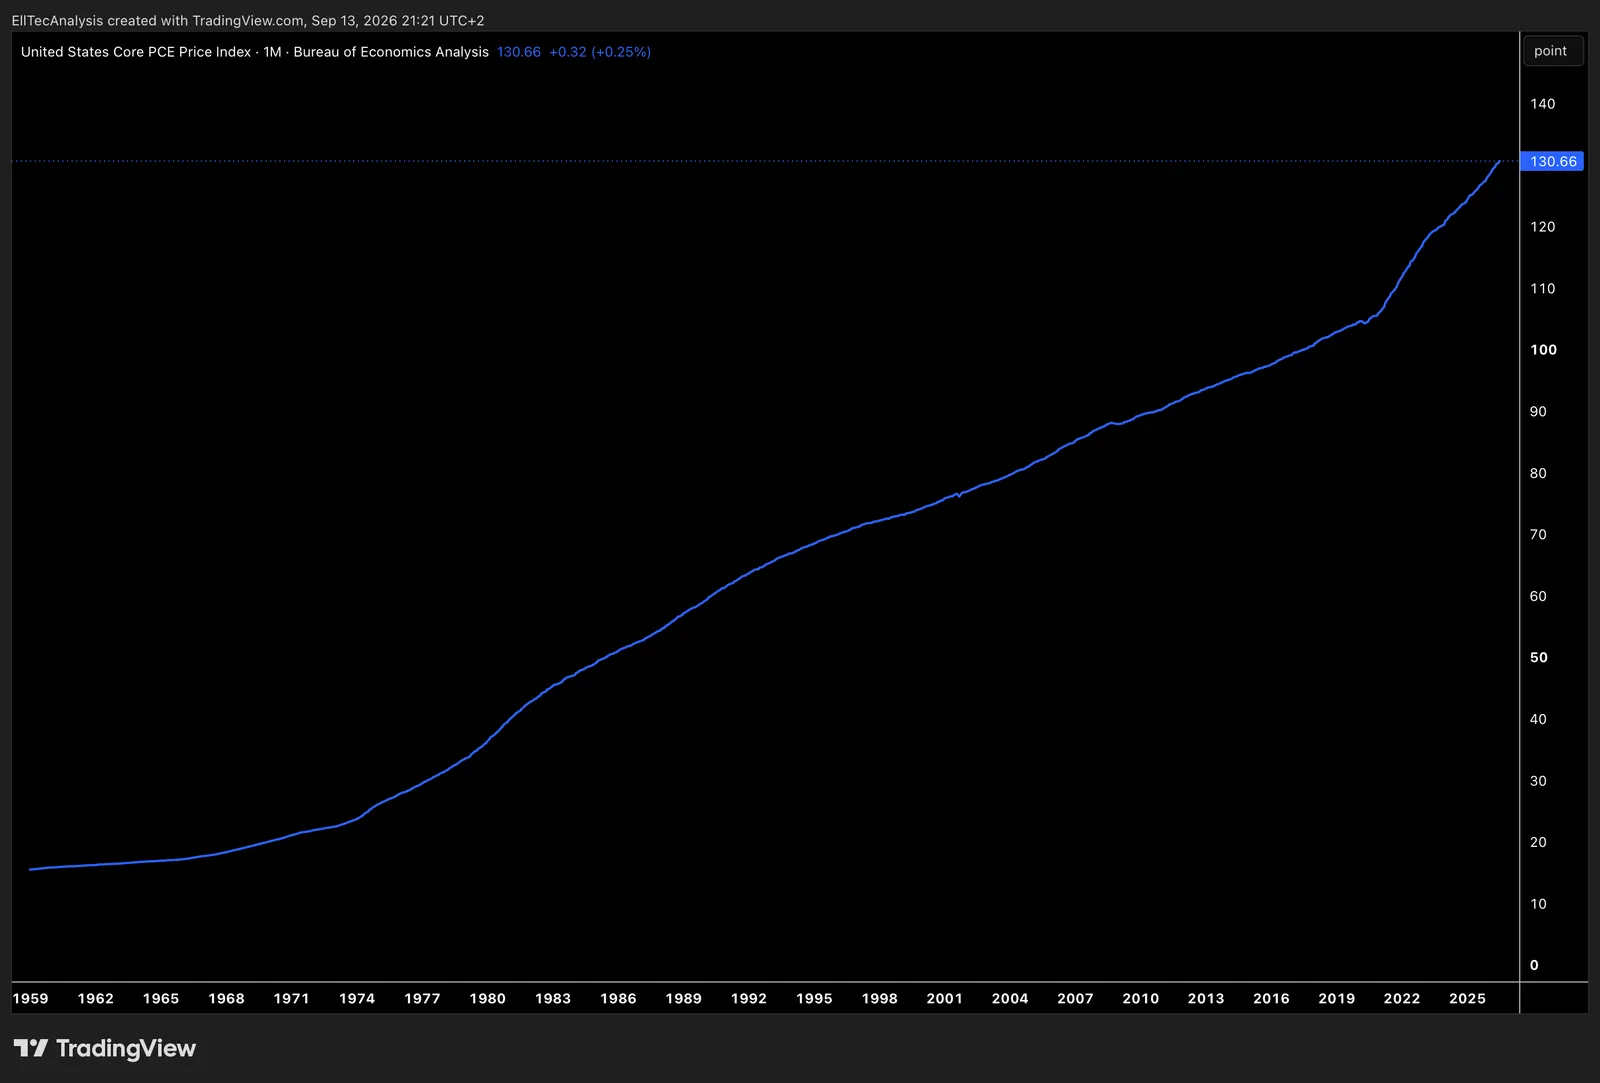
Measures underlying consumer inflation by tracking price changes in goods and services excluding food and energy, and in the Federal Reserve`s most important inflation indicator for policy decisions.
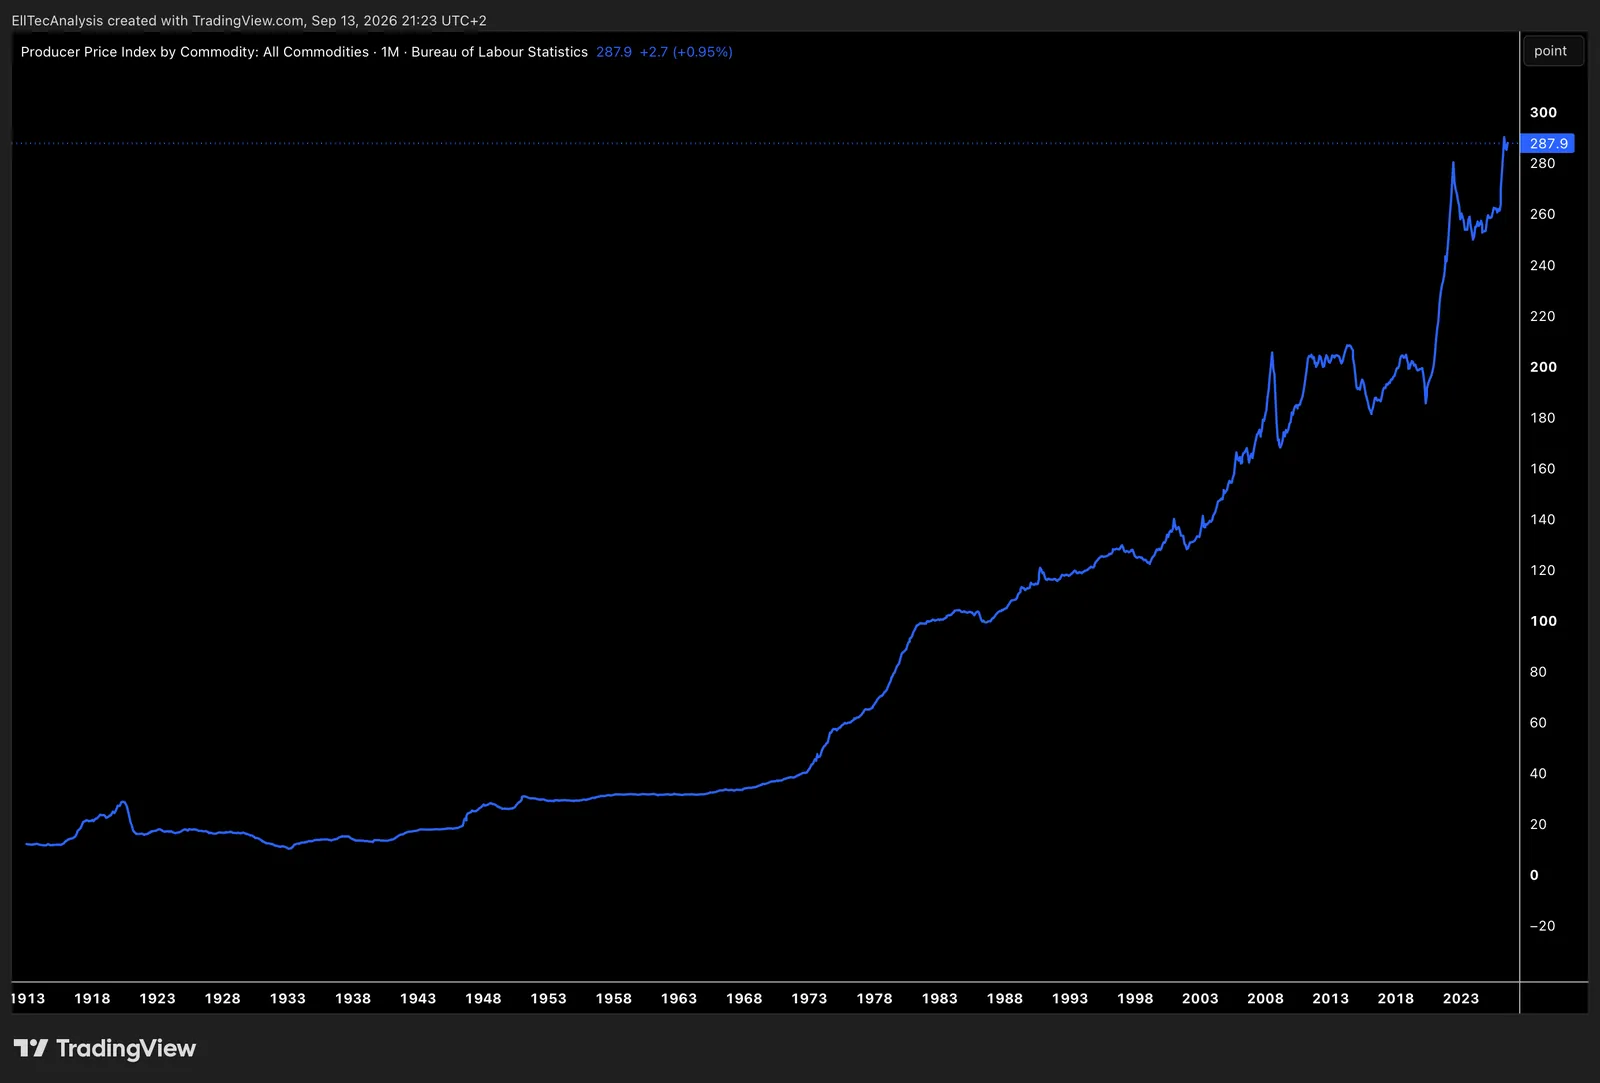
Measures average price changes received by domestic producers for their goods and services; an inflation indicator focused on the production side rather than consumer prices.
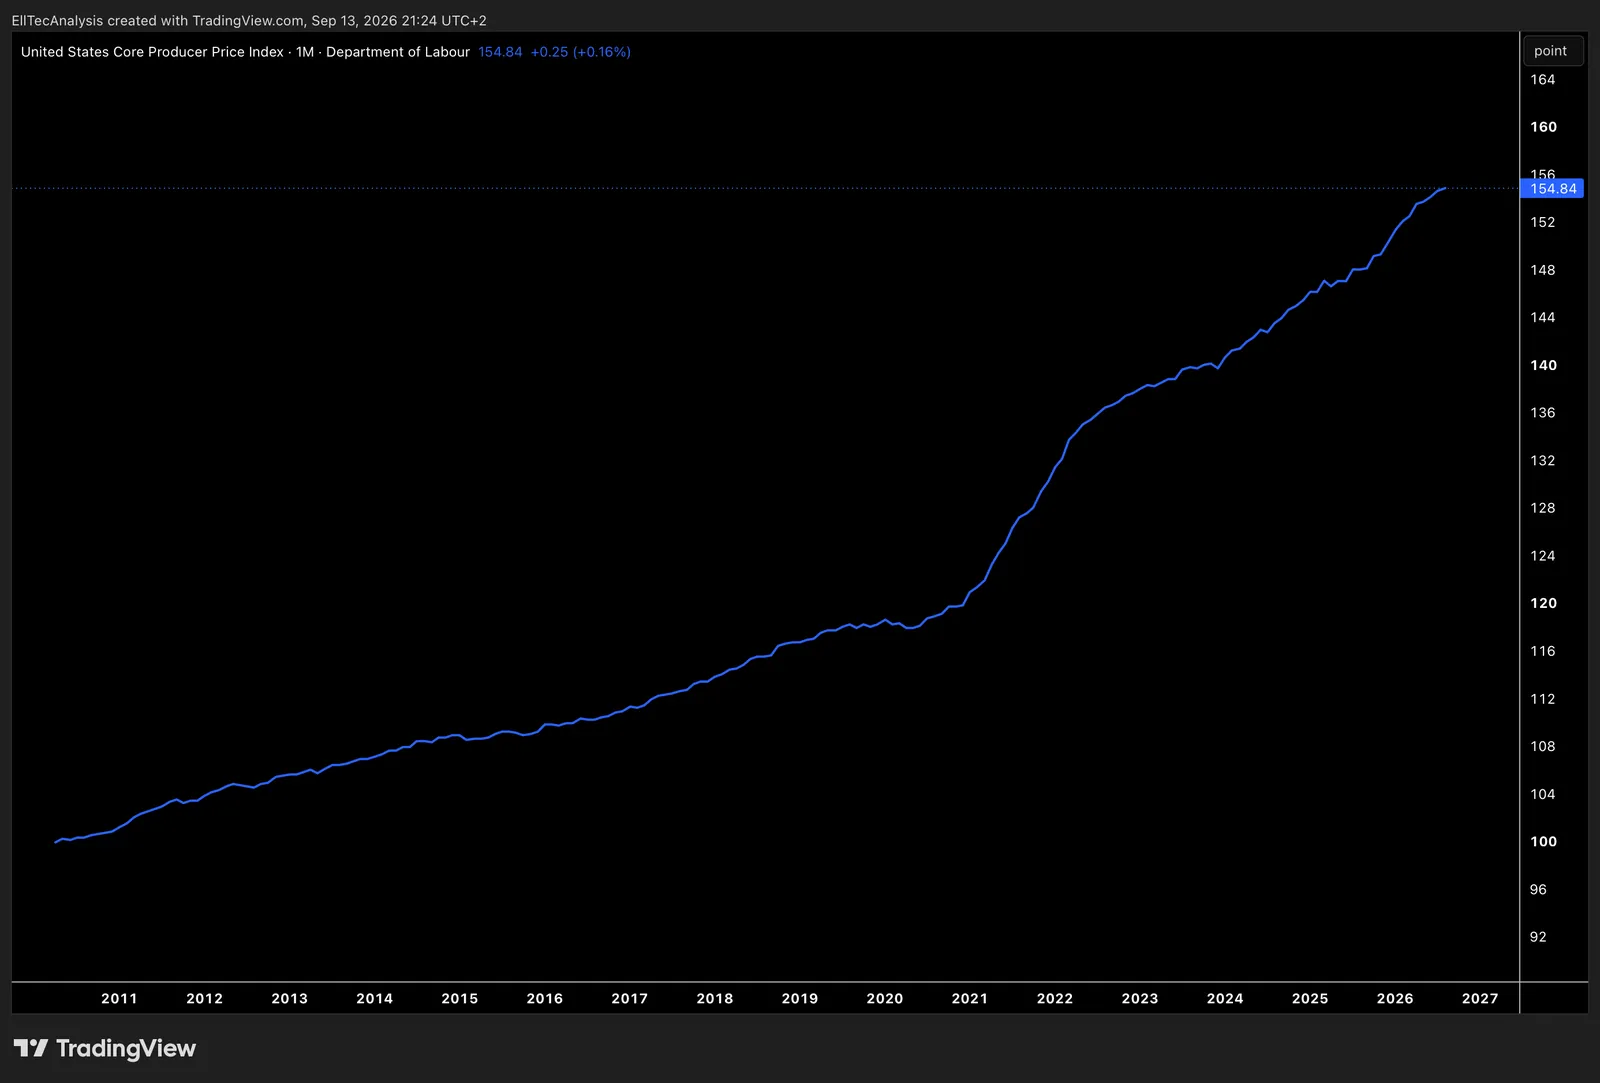
Measures price changes received by domestic producers excluding food and energy, giving a cleaner view of underlying wholesale-level inflation pressures.
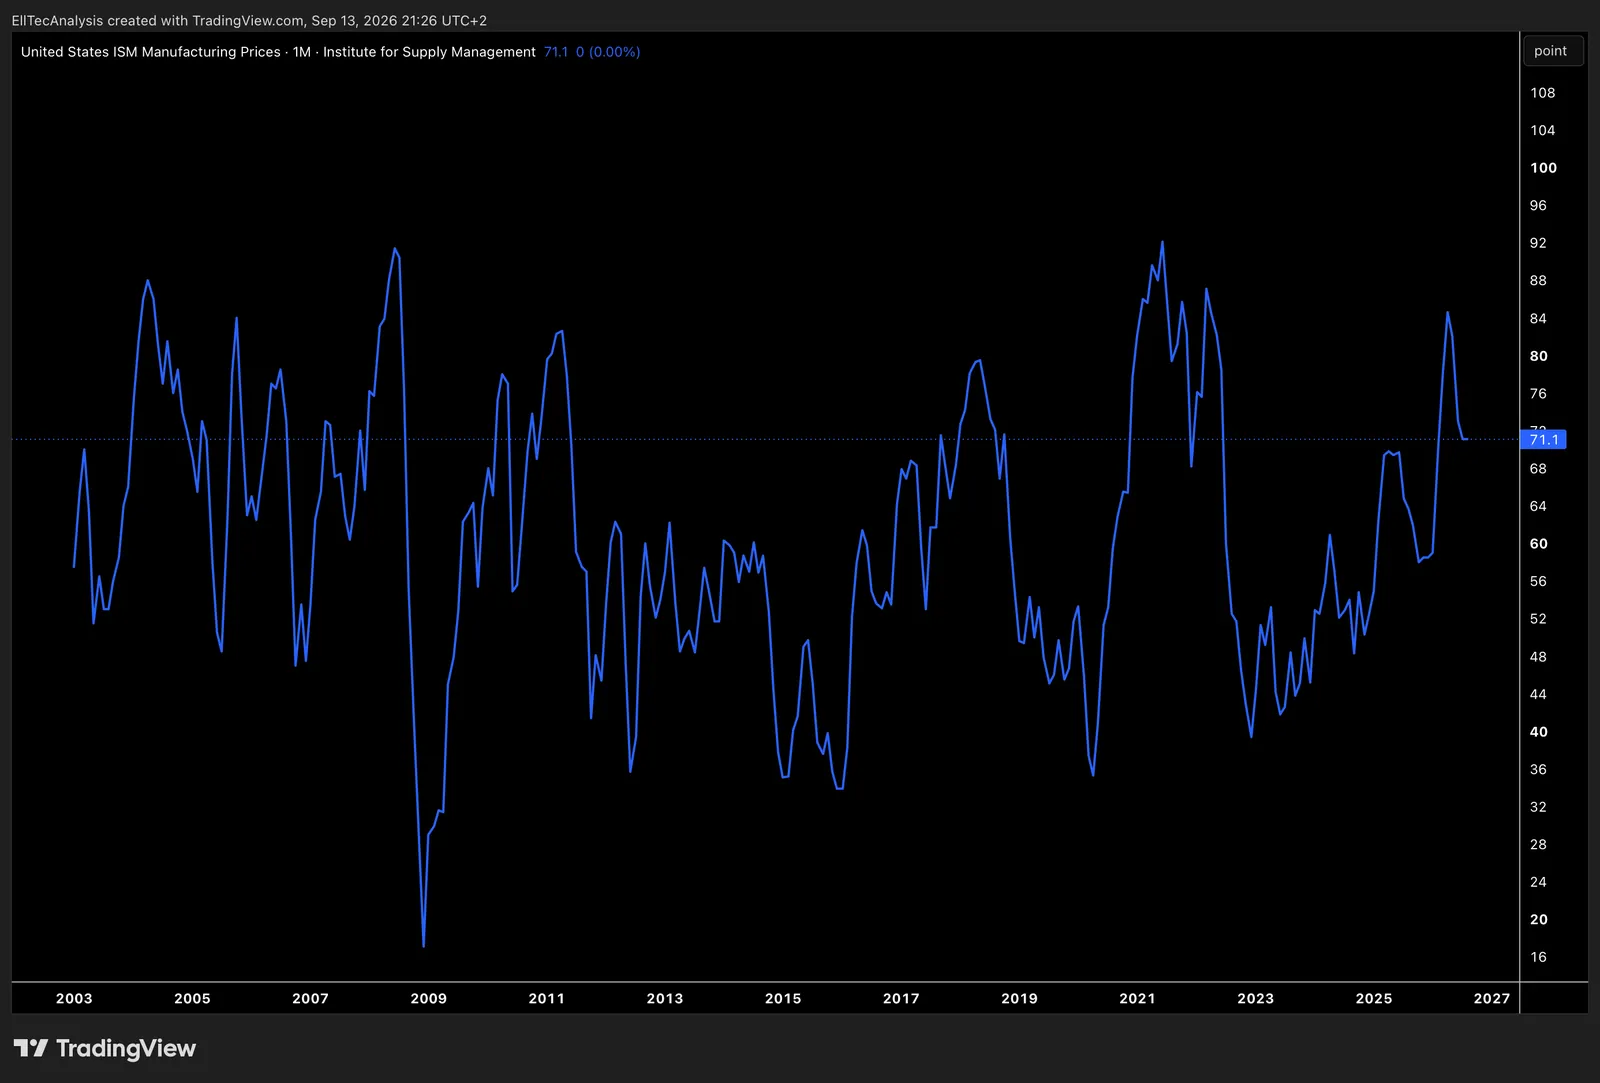
Tracks price changes that American manufactors pay for inputs (like raw materials. components, and intermediate goods), serving as an early indicator pf production-side inflation pressures.
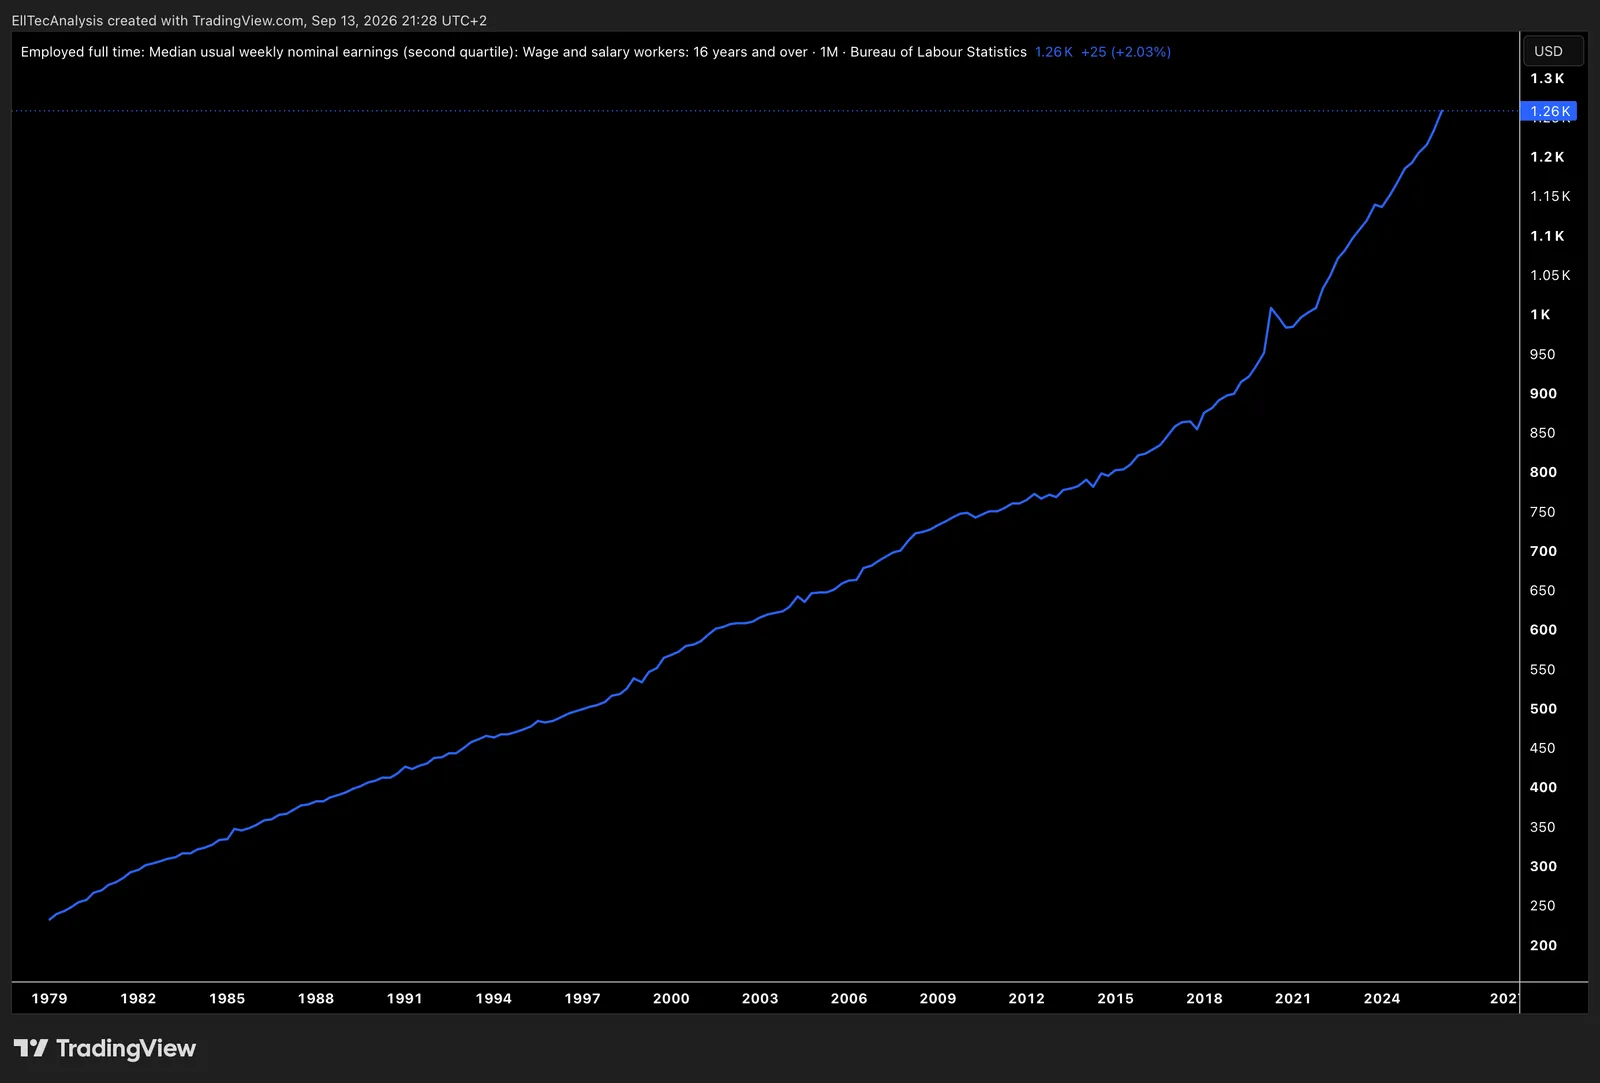
Average dollar income earned by full-time workers before adjusting for inflation, showing how wages are growing in raw nominal terms across the economy.
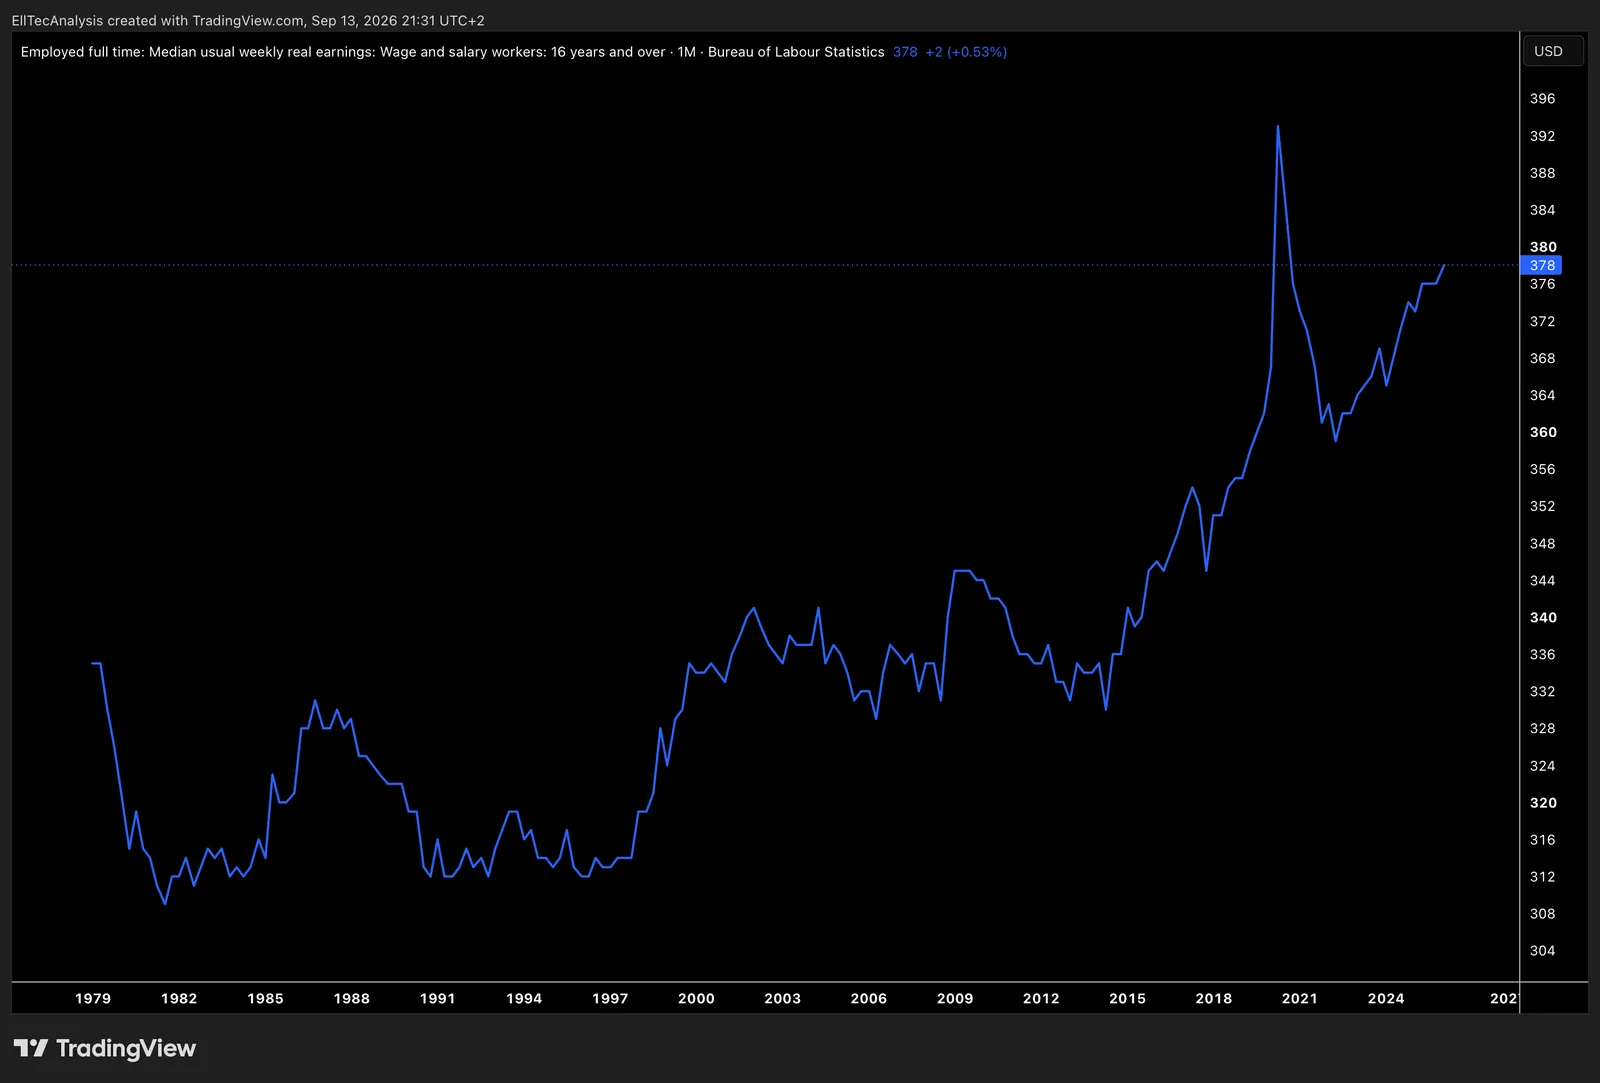
Average dollar income earned by full-time workers after adjusting for inflation, showing how wages are growing in real terms across the economy.
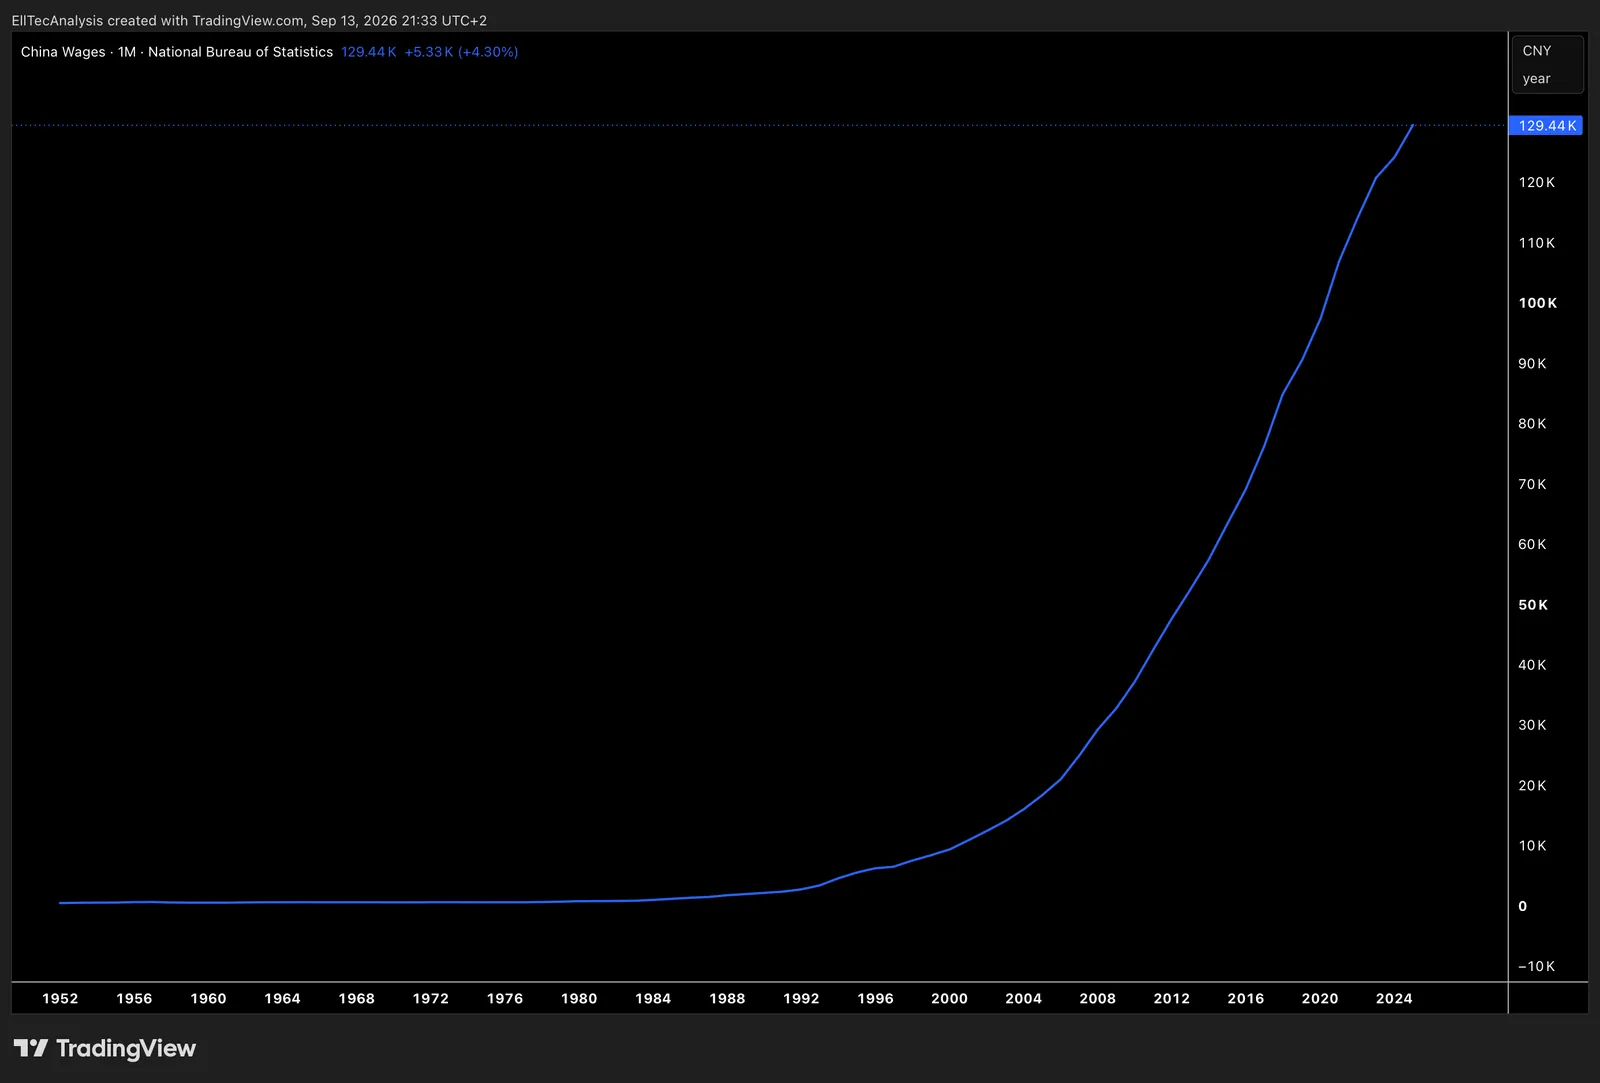
Average worker earnings across China`s economy, indicating labor-cost trends and purchasing power.
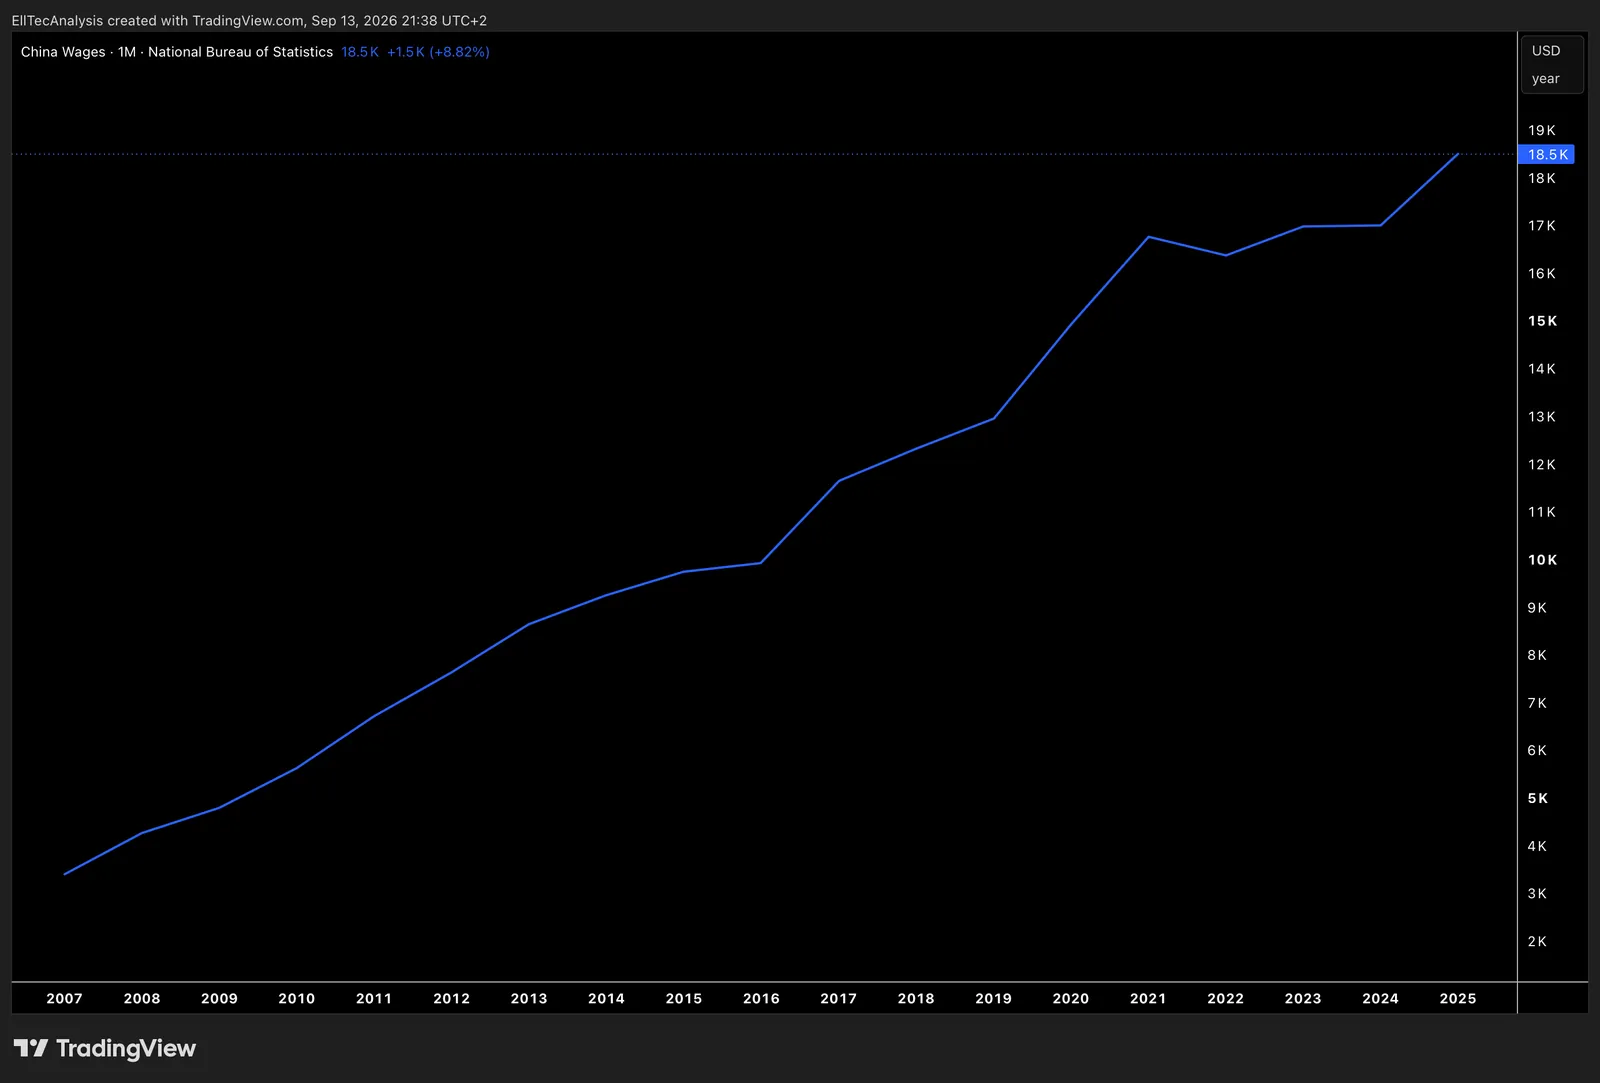
Represents the average earnings of Chinese workers converted into US dollars.
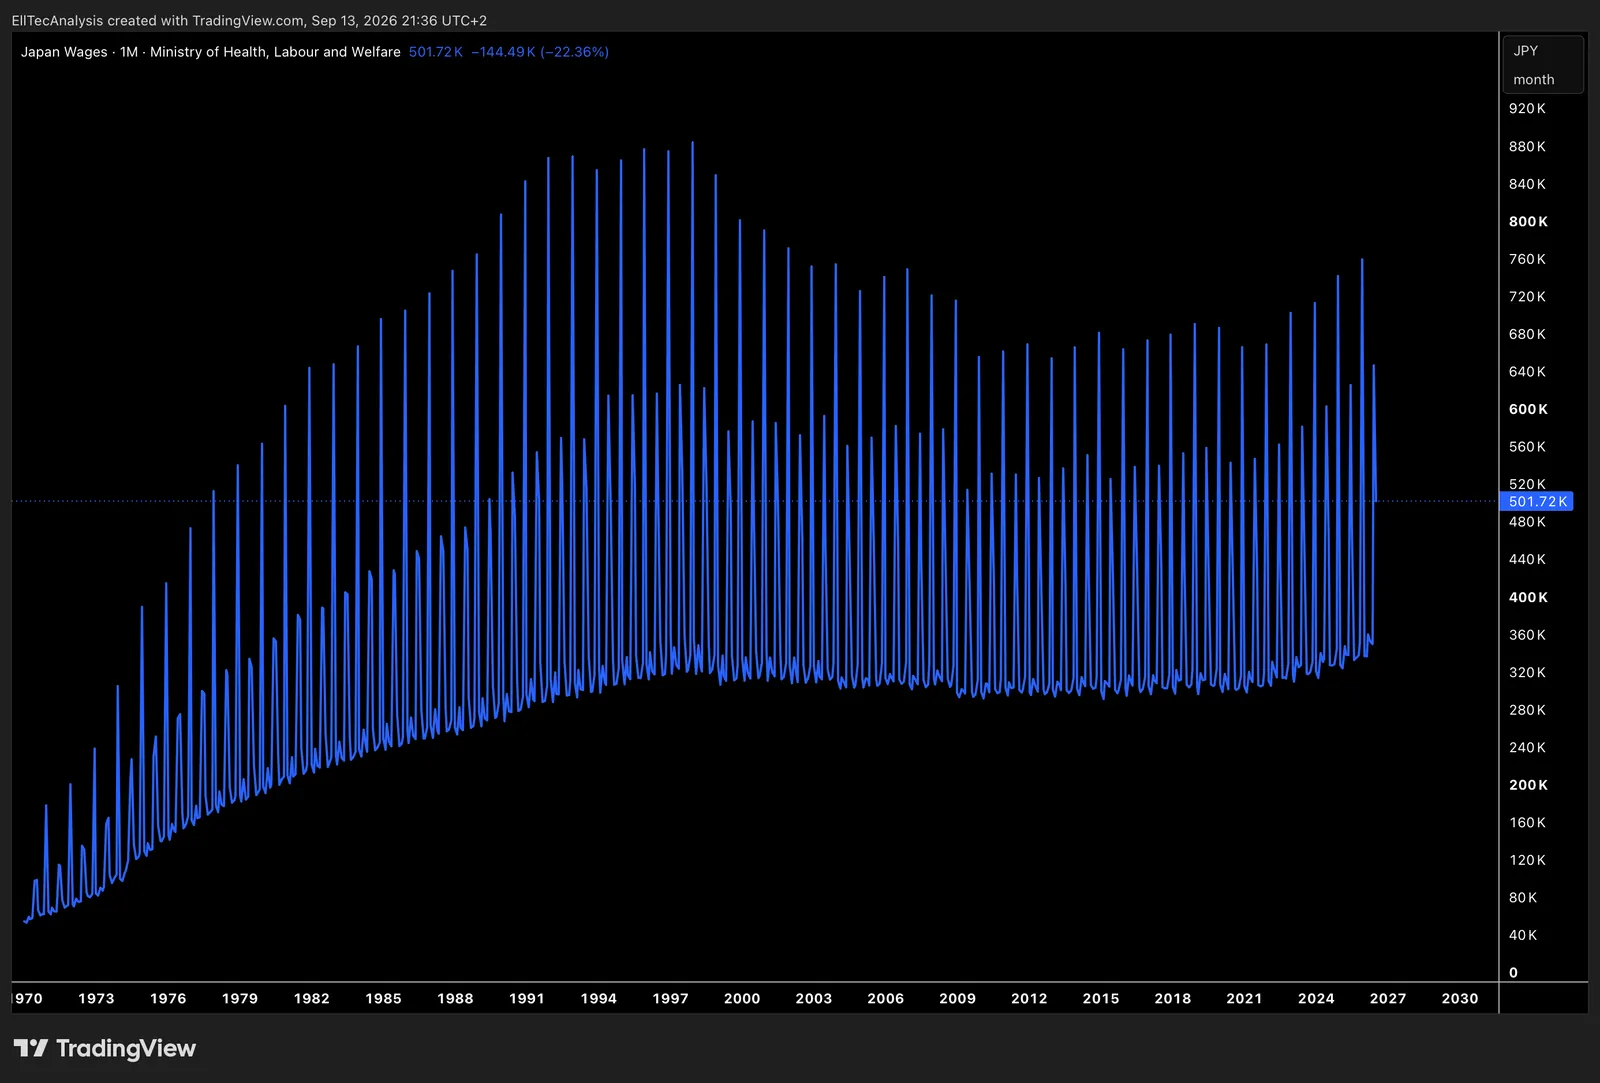
Measures average worker earnings across Japan`s economy, used to track labor-cost trends, purchasing power, and wage-inflation momentum.
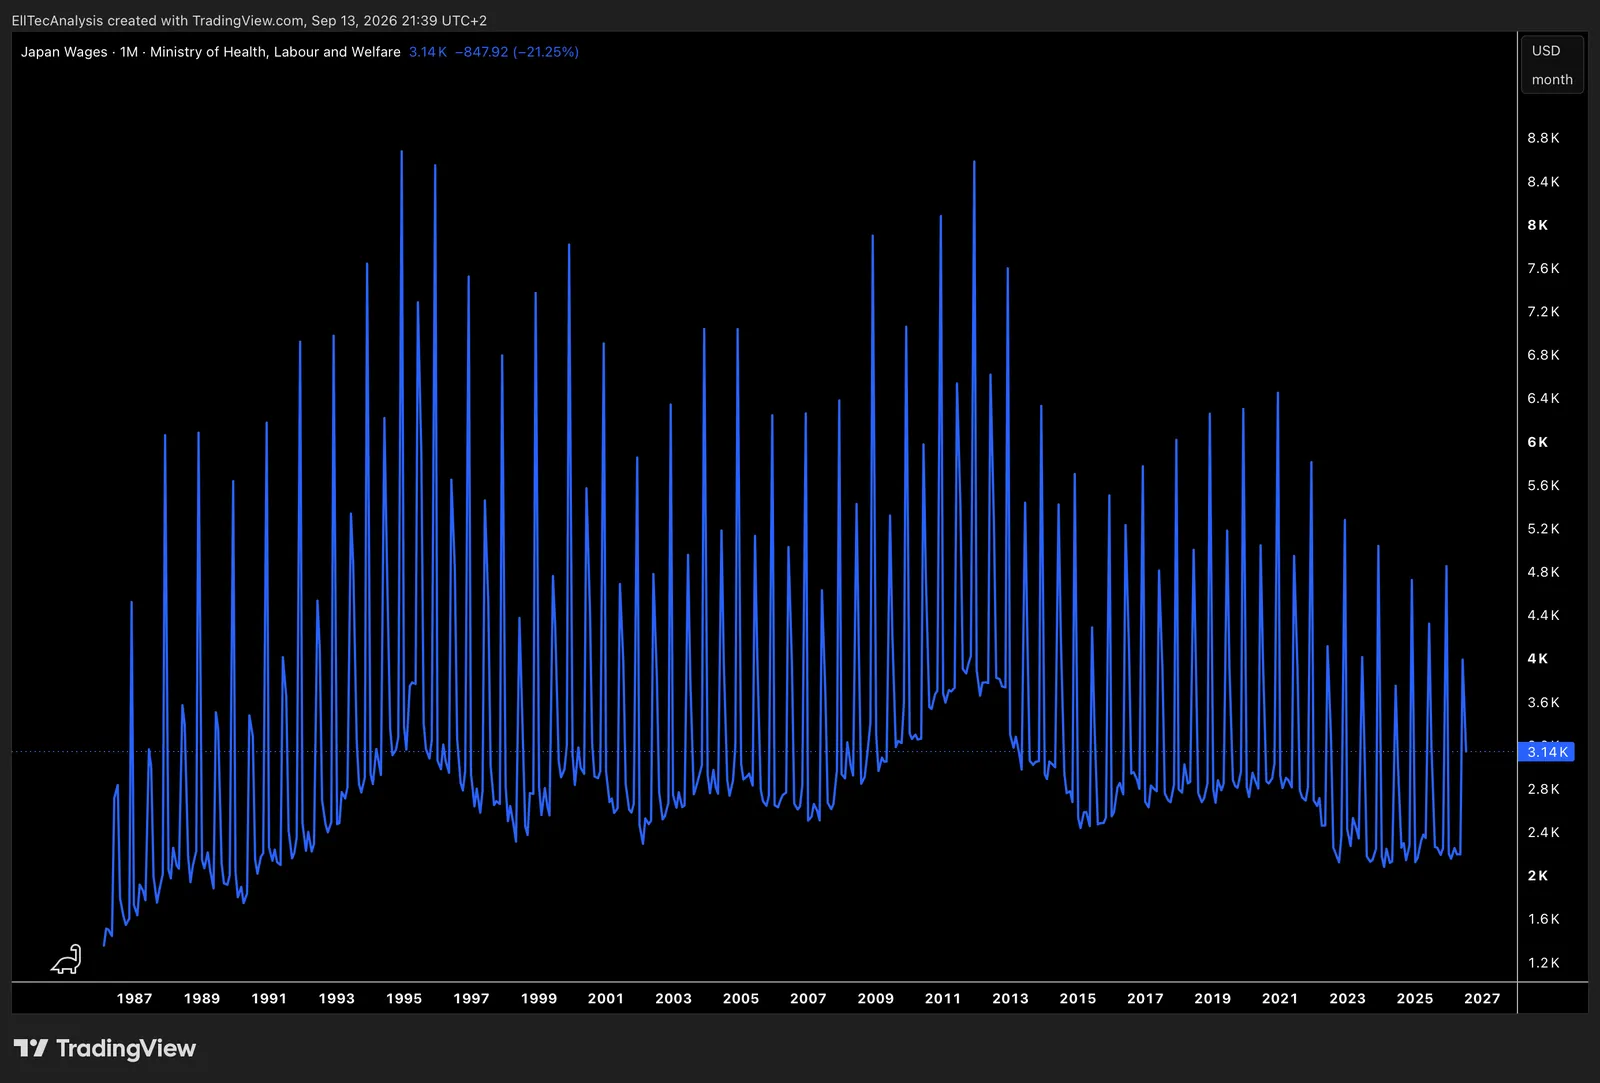
Average workers earnings in Japan converted into US dollars.
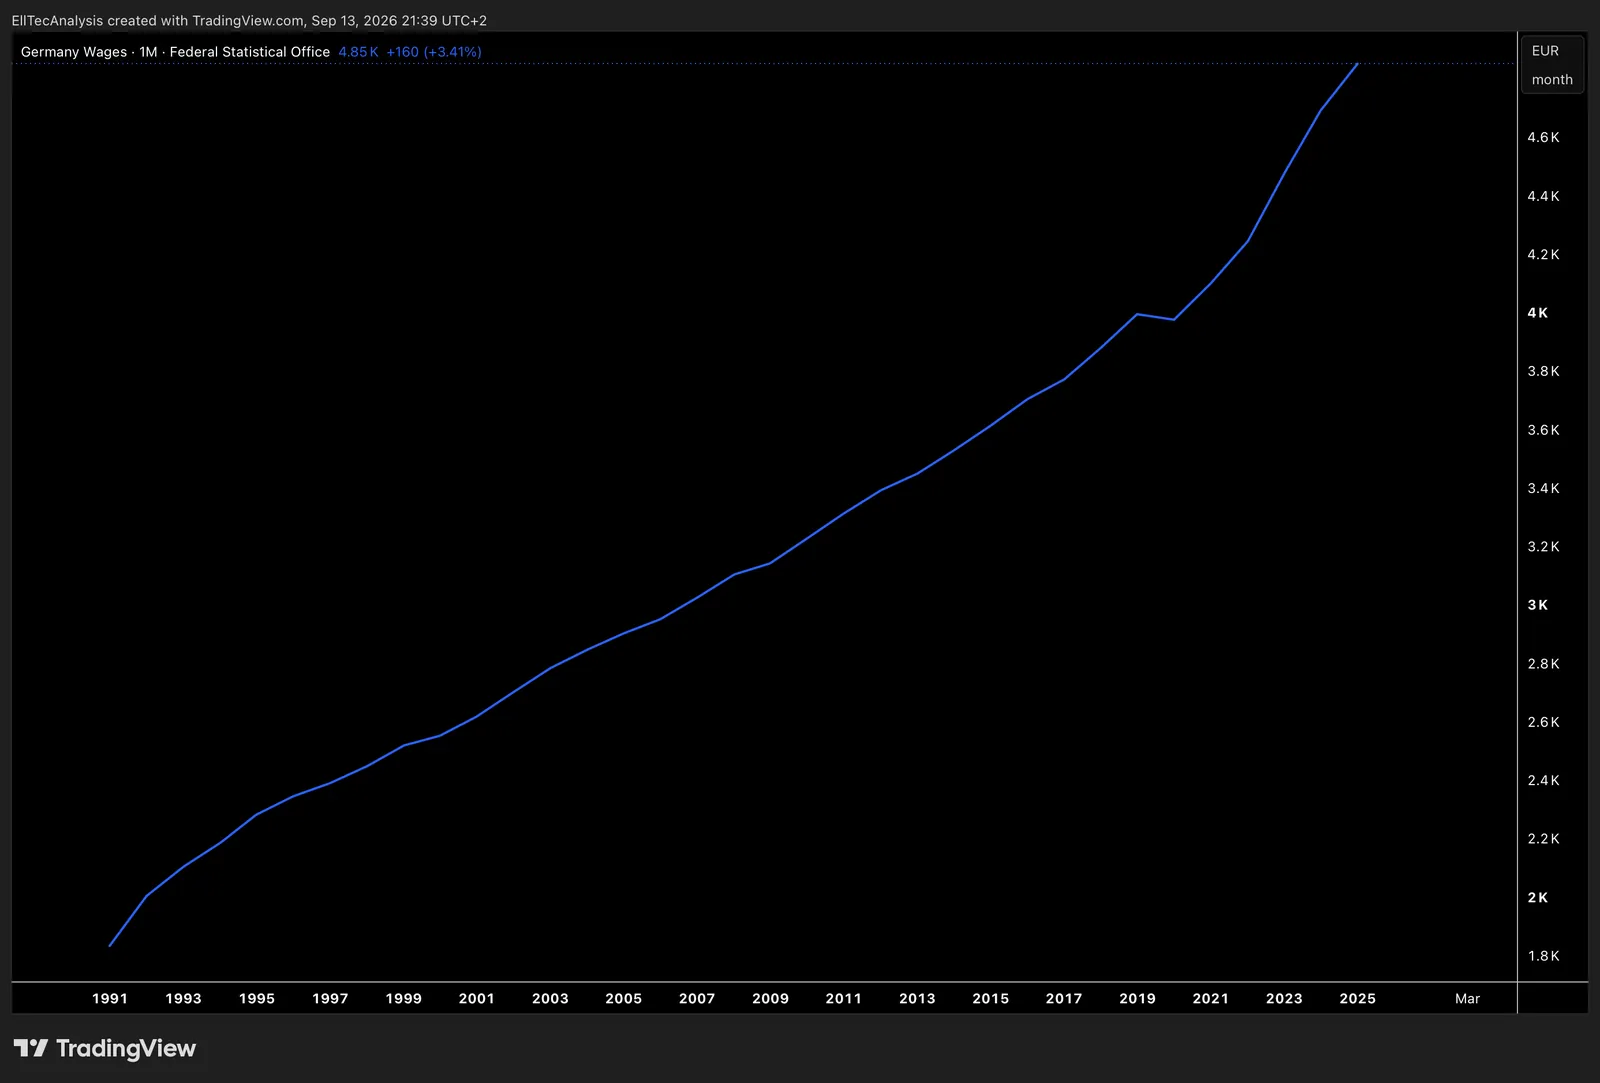
Measures average worker earnings across Germany`s economy, used to track labor-cost trends, purchasing power, and wage-inflation momentum.
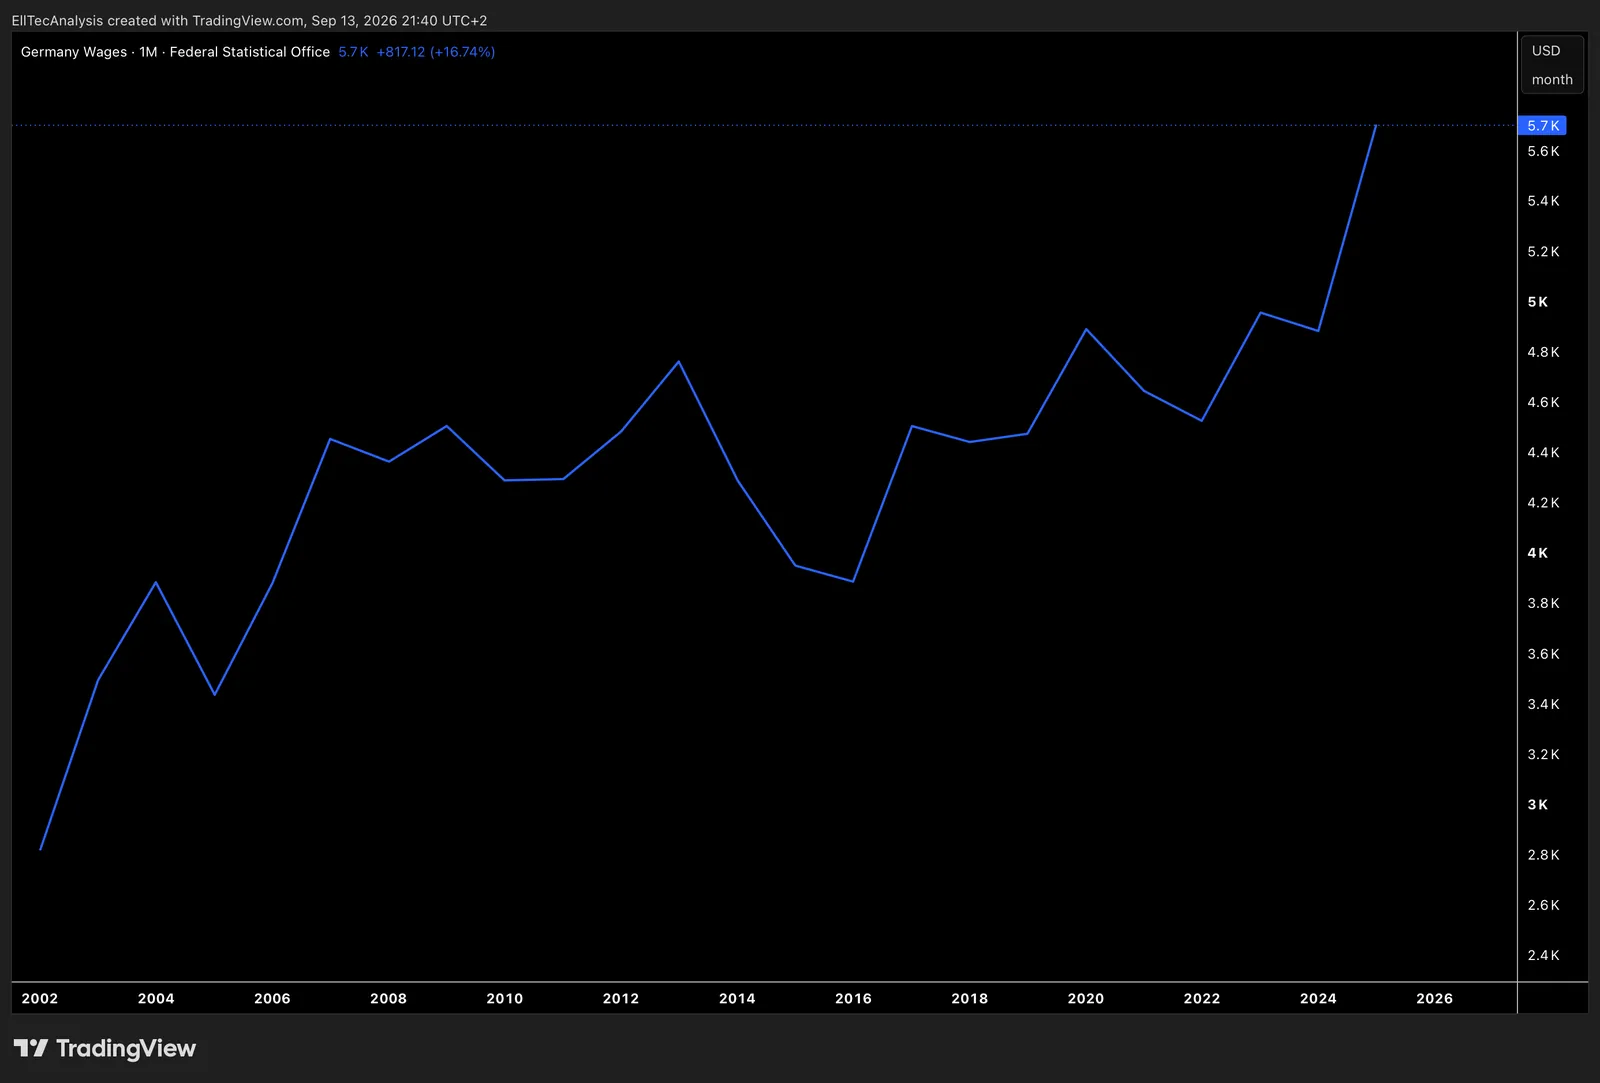
Average workers earnings in Germany converted into US dollars.
Inflation Expectations
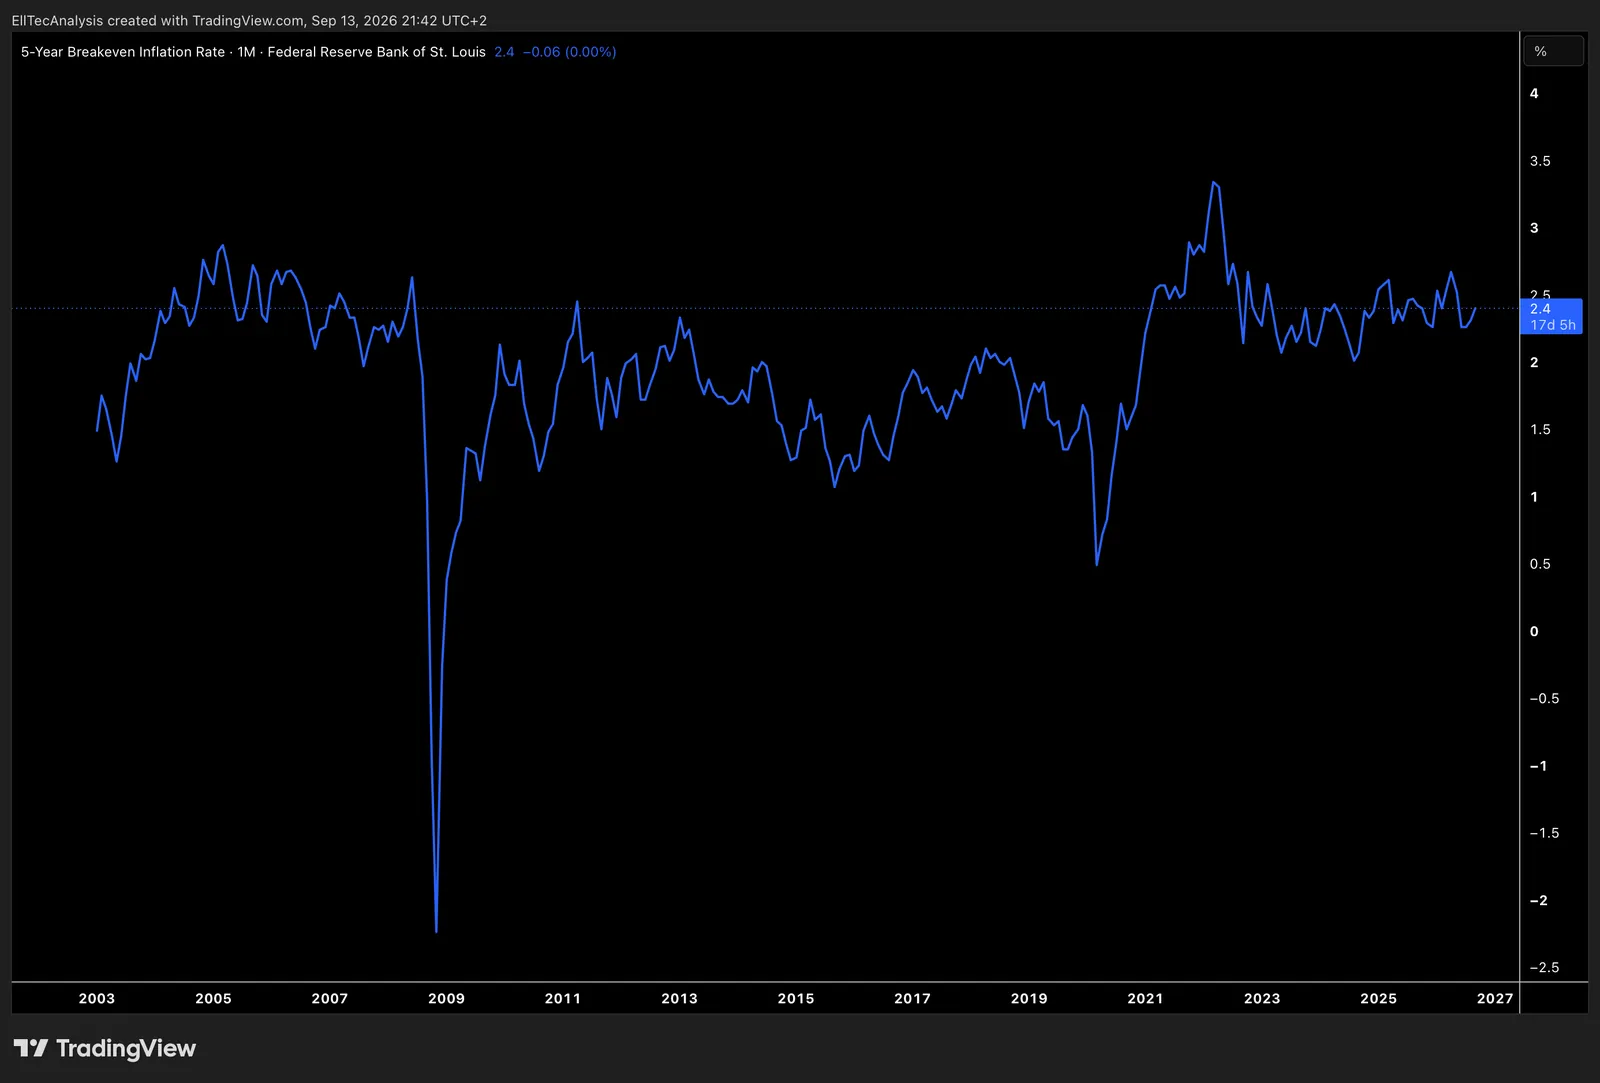
Shows market-based US inflation expectations over the next five years and can be used to assess inflation sentiment and guide investment and monitary decisions.
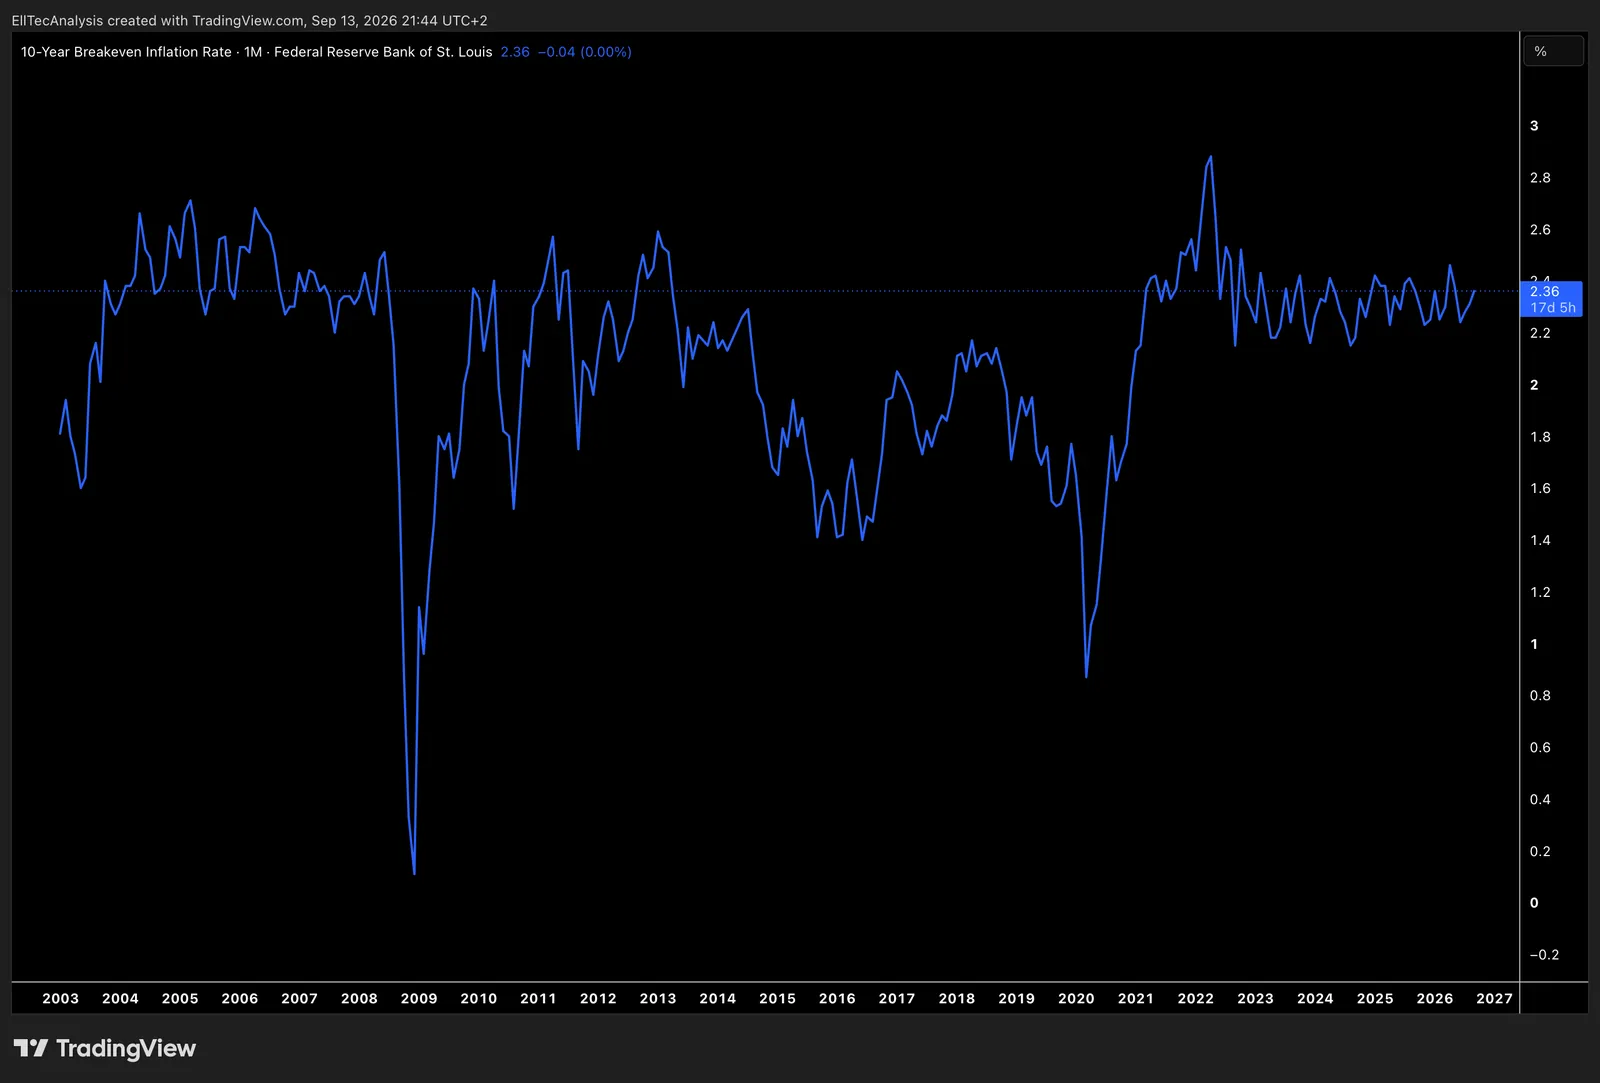
Shows market-based US inflation expectations over the next ten years and can be used to assess inflation sentiment and guide investment and monitary decisions.
Forex
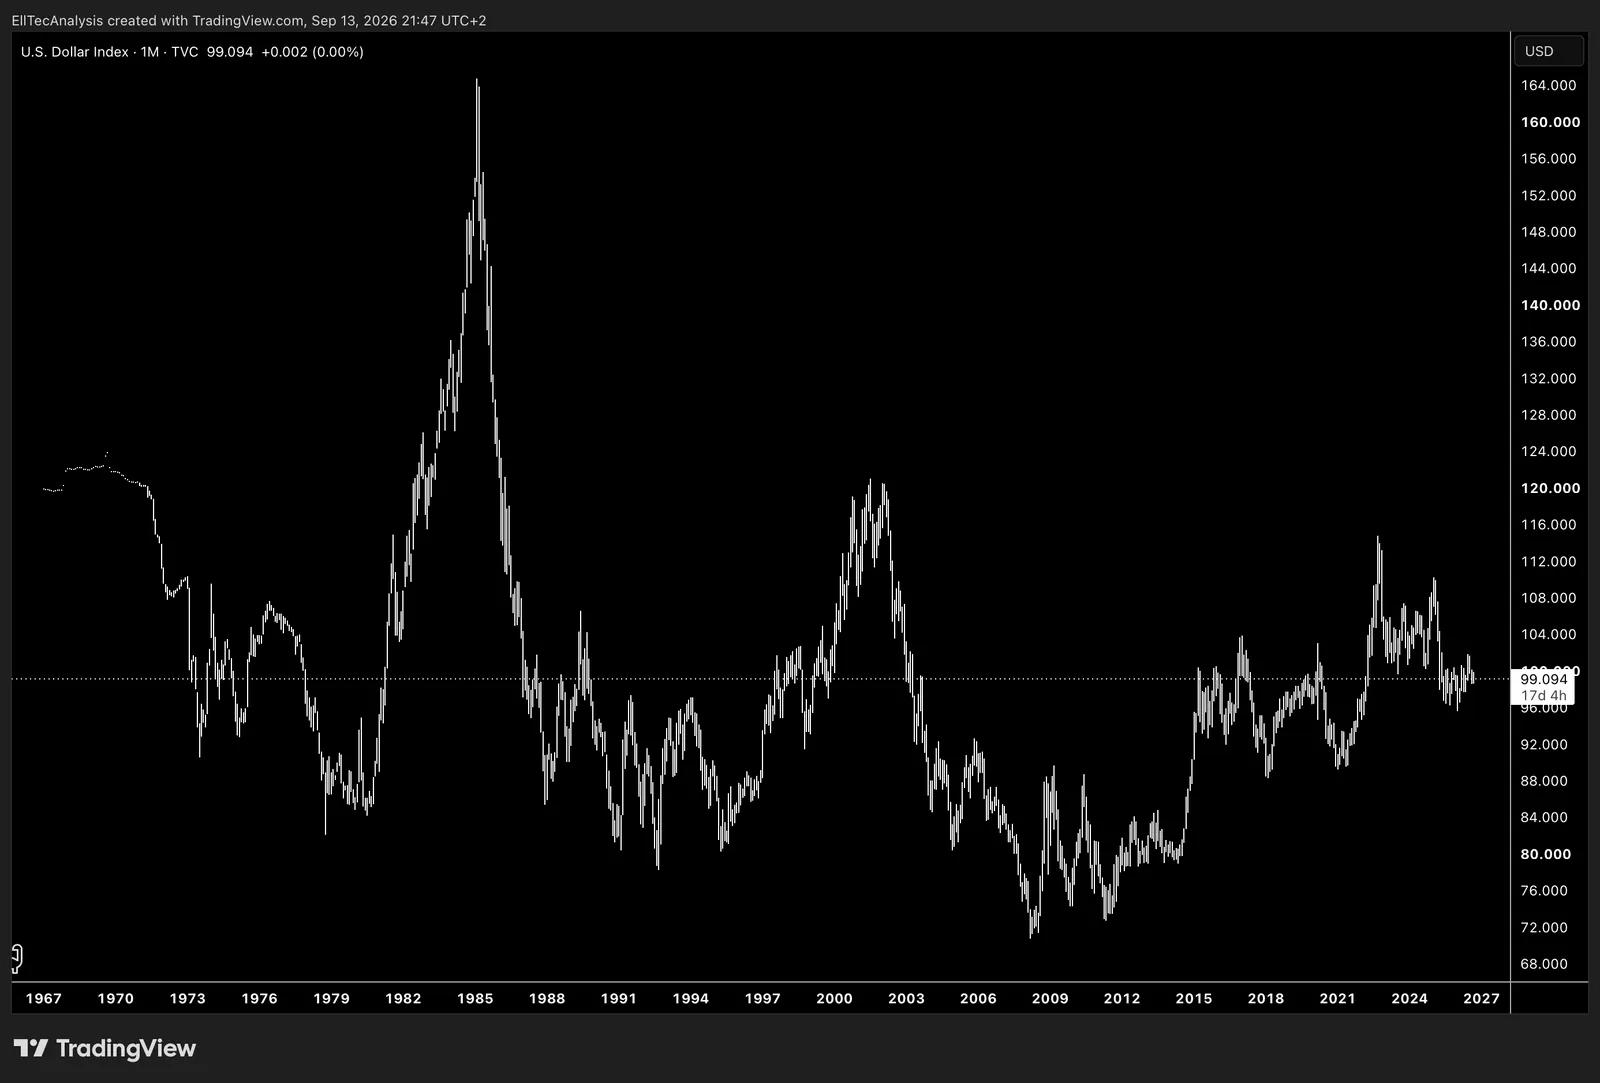
Shows the strength of the US Dollar against a basket of major currencies nad can be used to assess global risk sentiment, currency trends, and their impact on international markets.
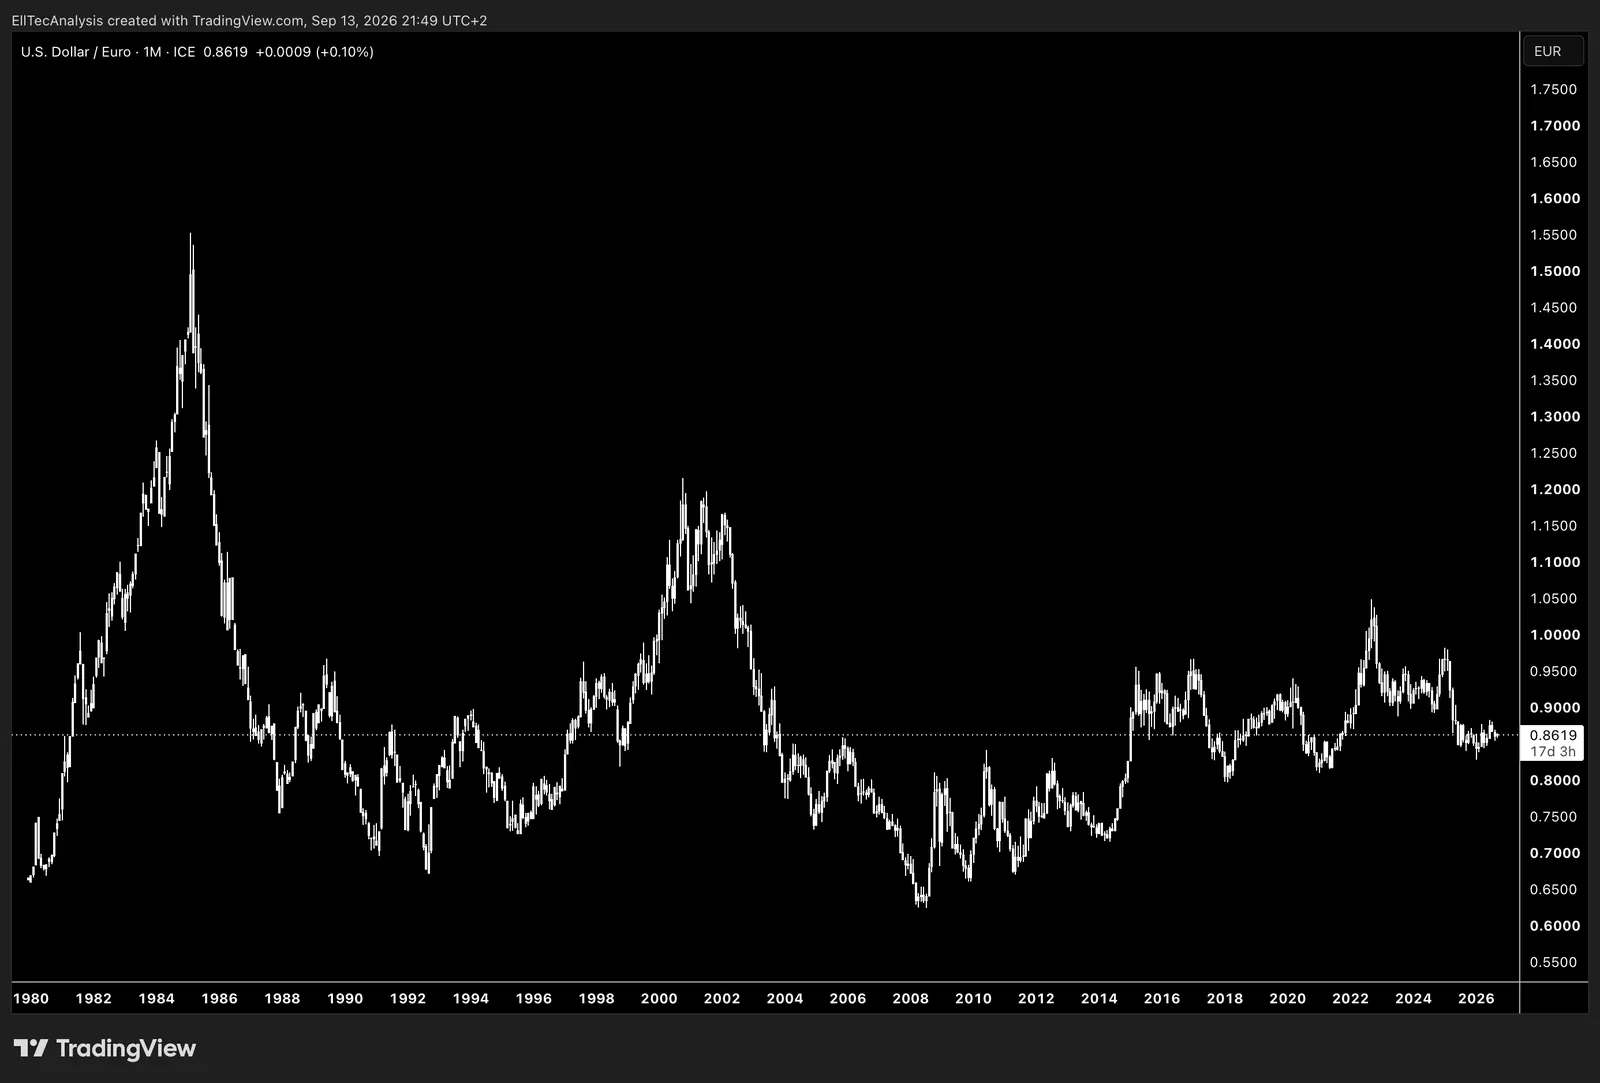
Shows the exchange rate between US dollar and the euro and can be used to track currency market trends, assess relative economic strength, and support international investment decisions.
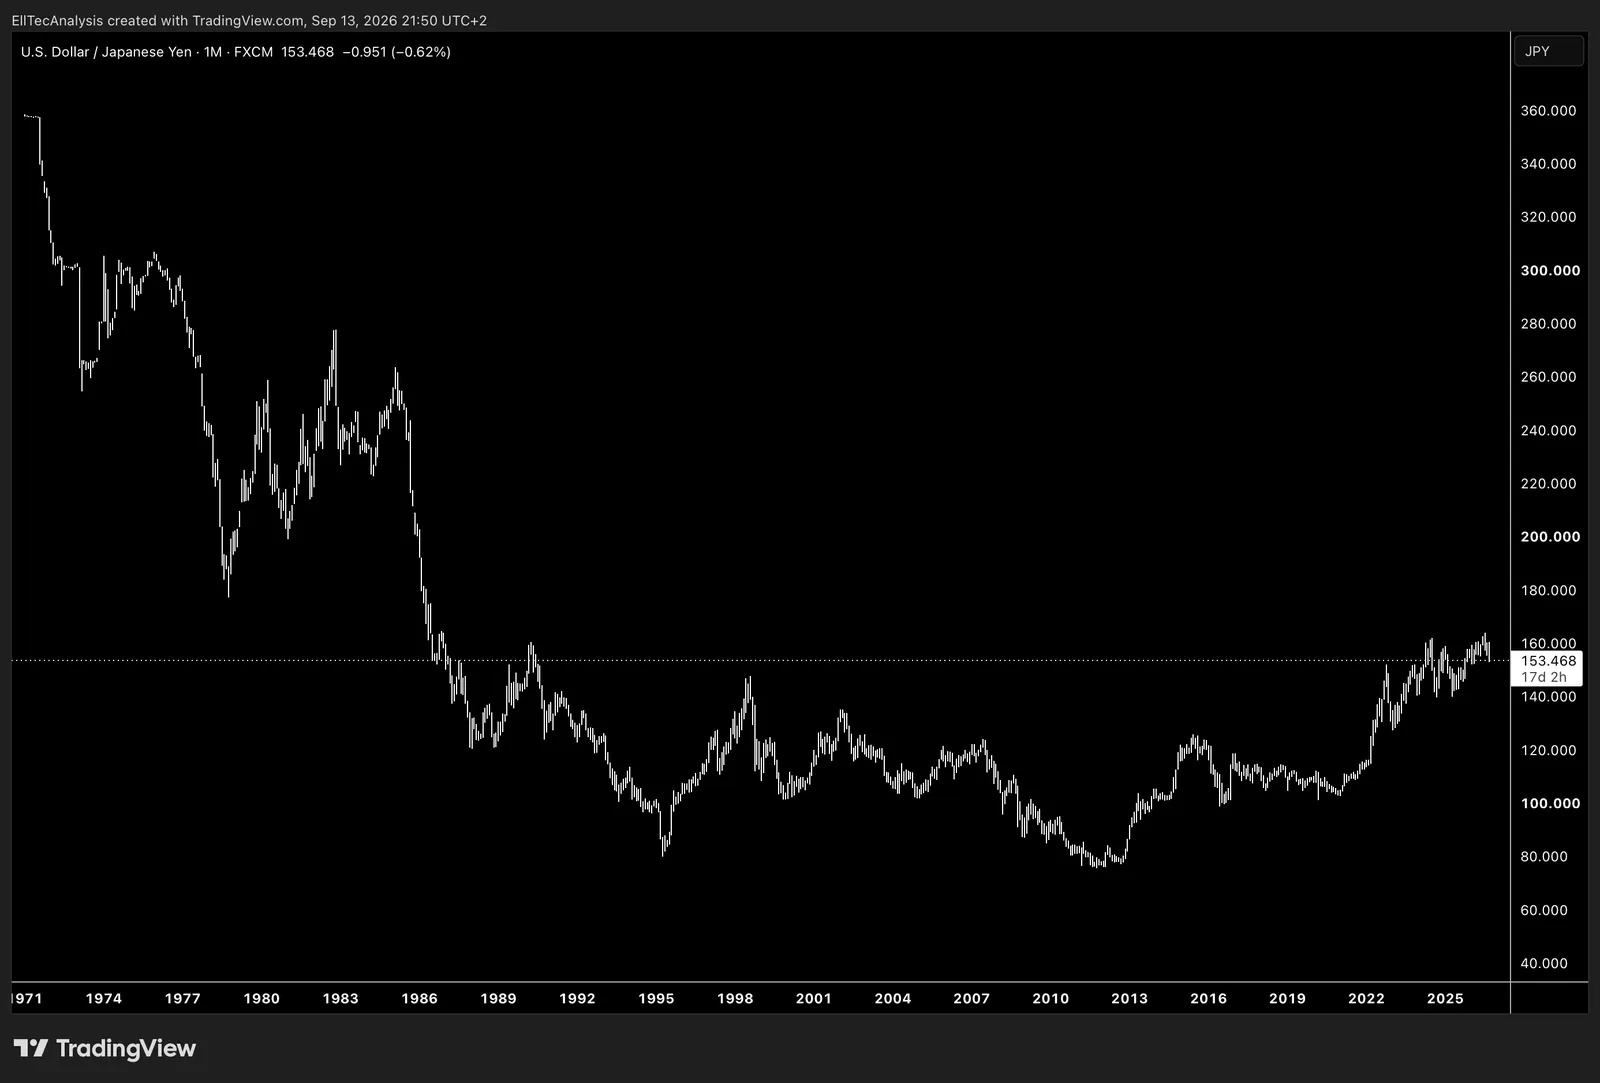
Shows exchange rate between the US Dollar and the Japanese Yen and can be used to monitor currency market dynamics, assess interest rate expectations, and evaluate global risk sentiment.
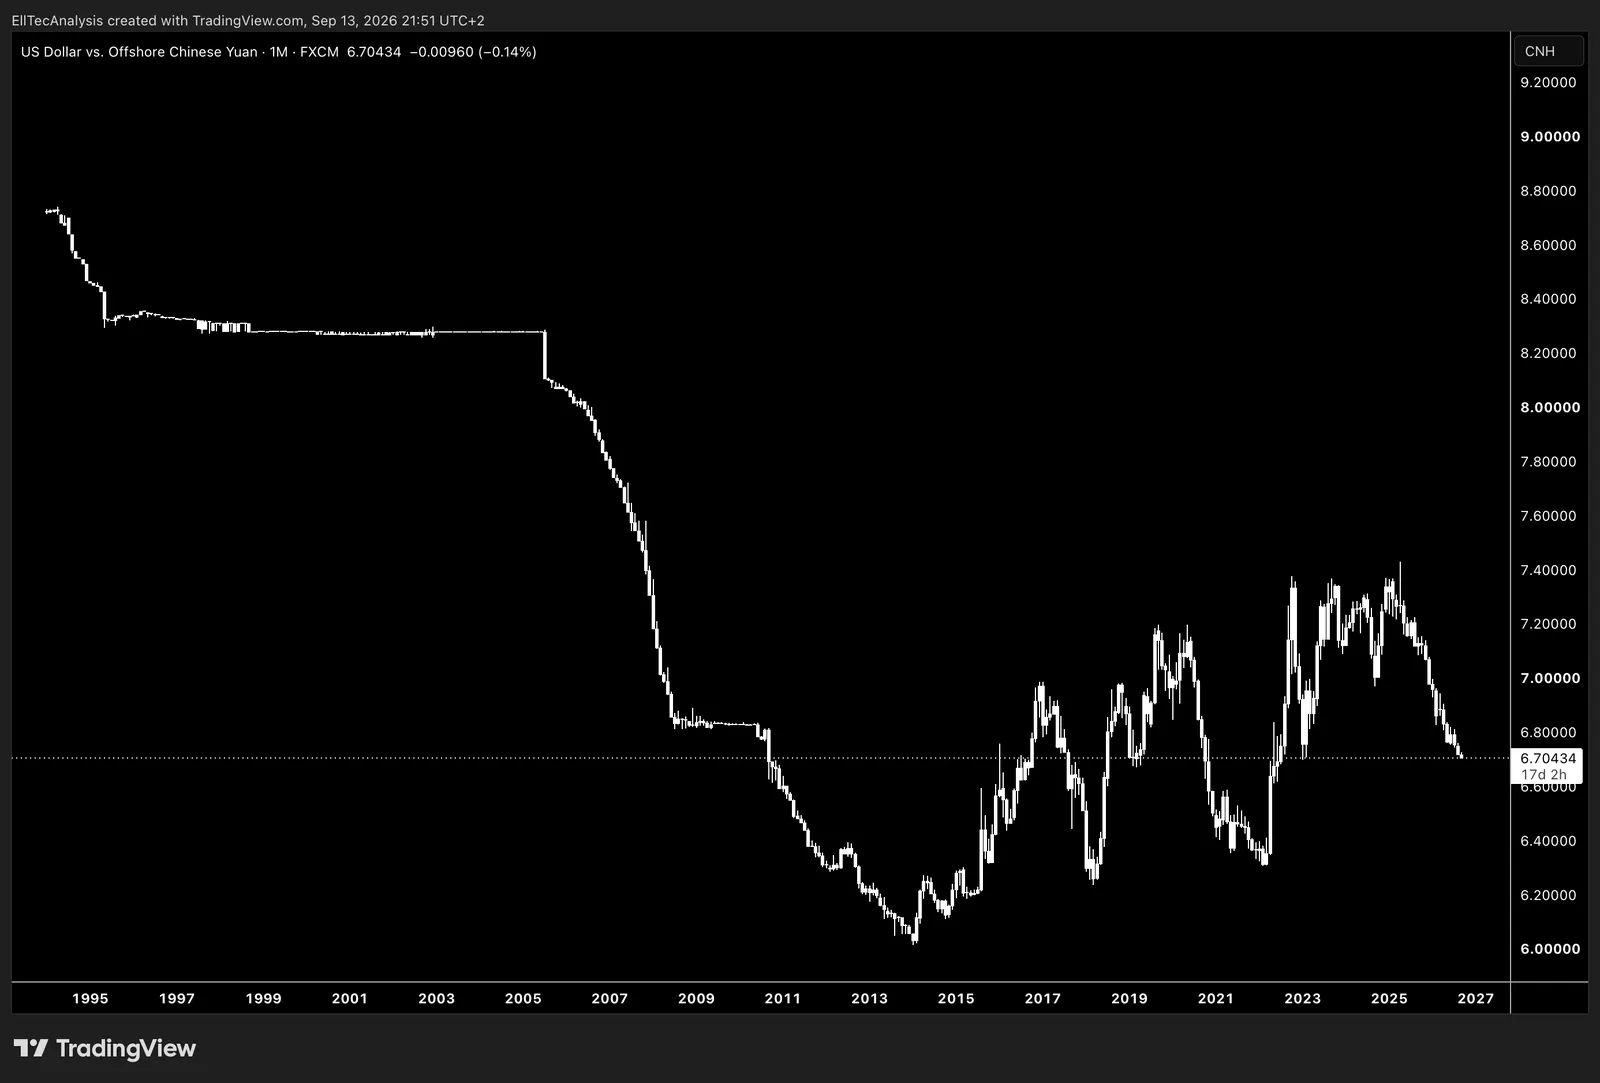
Shows exchange rate between the US Dollar and the Offshore Chinese Yuan and can be used to monitor currency trends, asses trade competitiveness, and evaluate market sentiment toward China and the US economy.
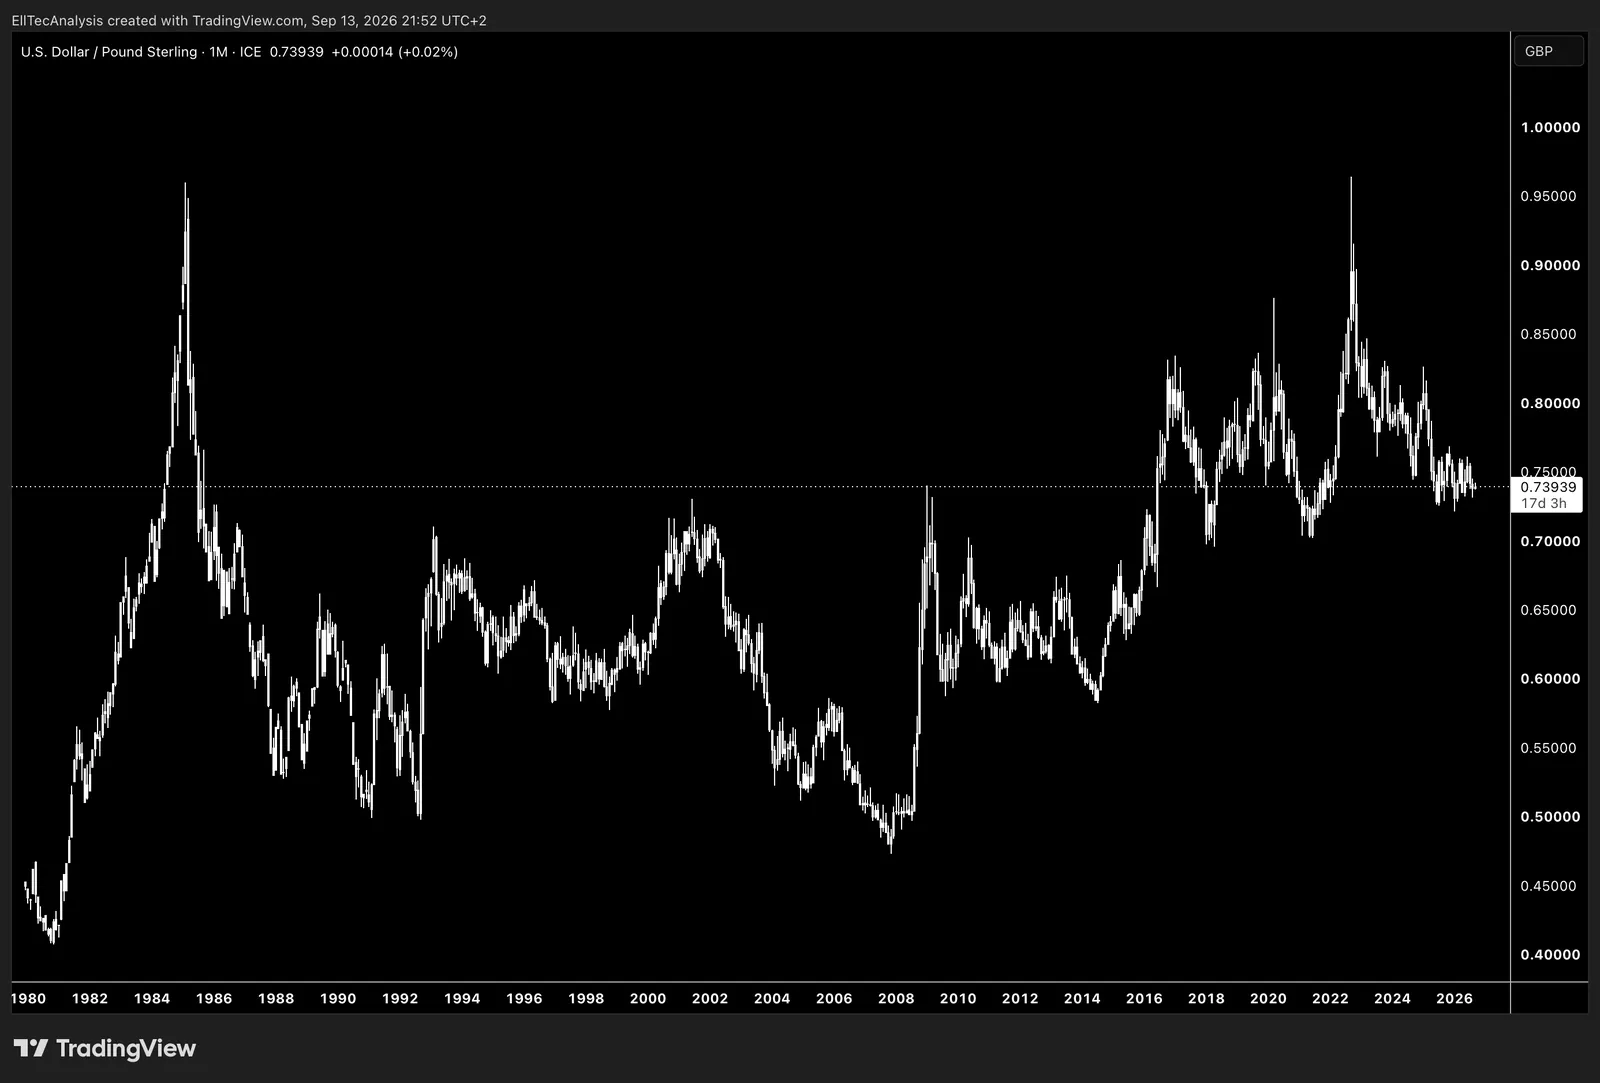
Shows the exchange rate between the US Dollar ant the British Pound and can be used to track currency market trends, assess relative economic strength, and support international investment or trade decisions.
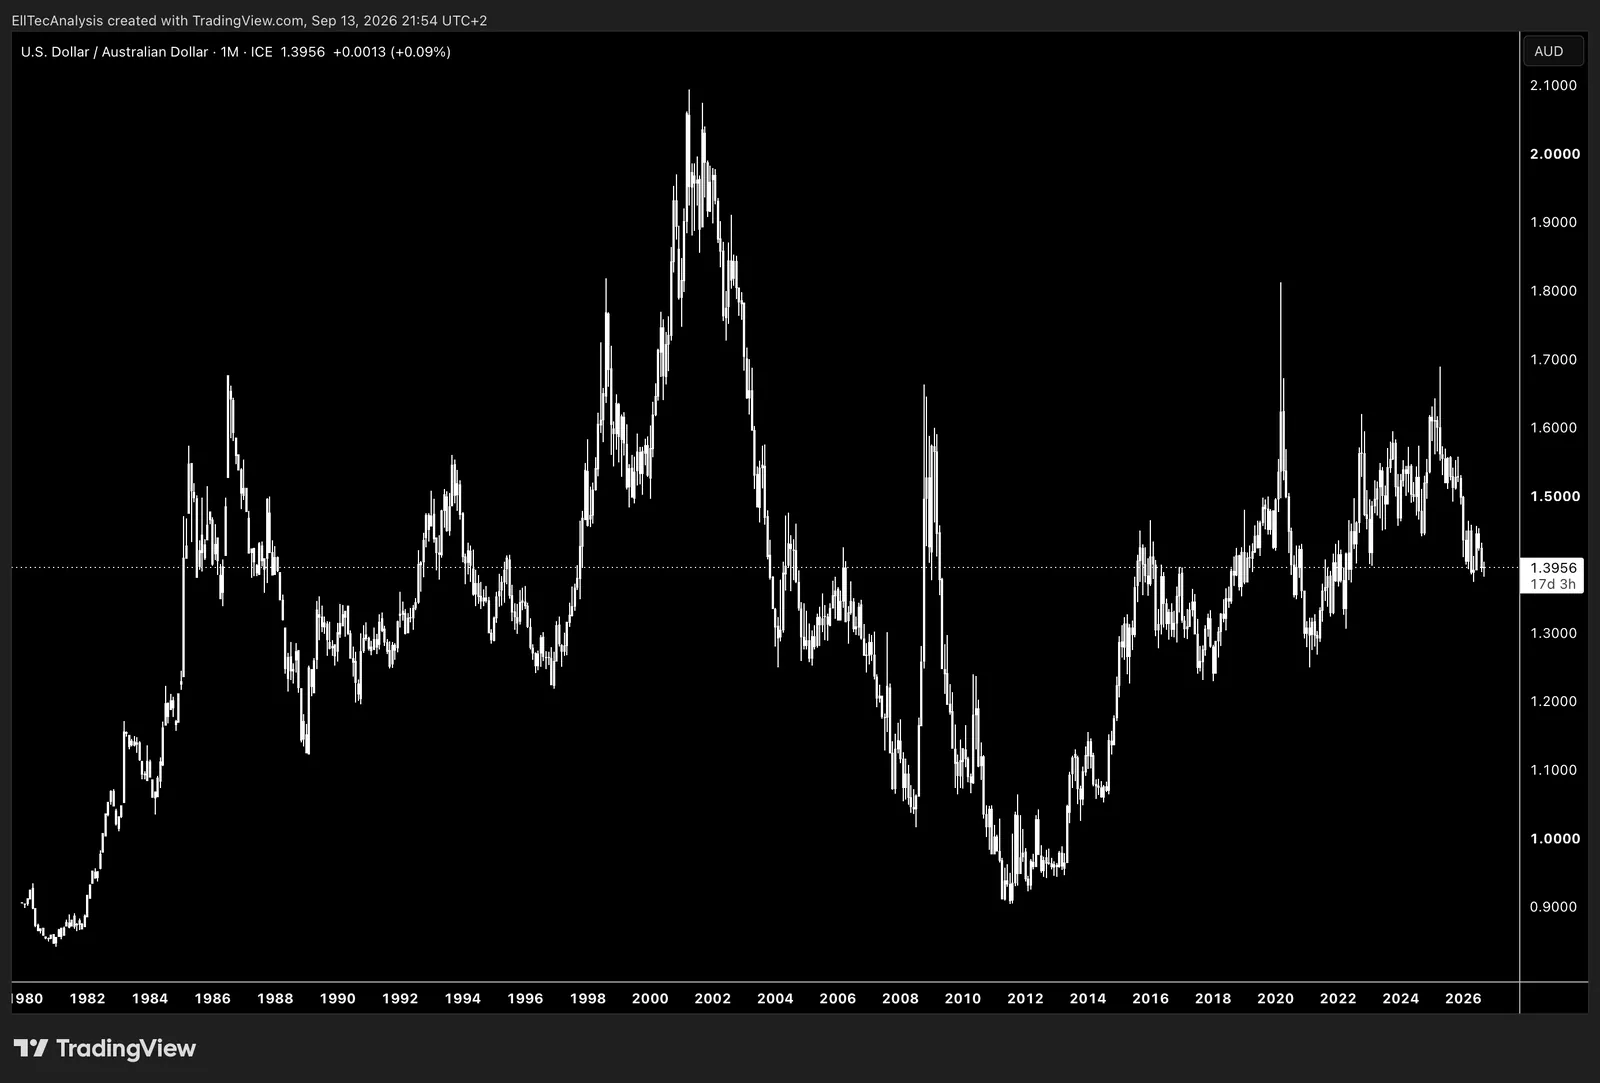
Shows the exchange rate between the US Dollar ant the Australian Dollar and can be used to track currency market trends, assess relative economic strength, and support international investment or trade decisions.
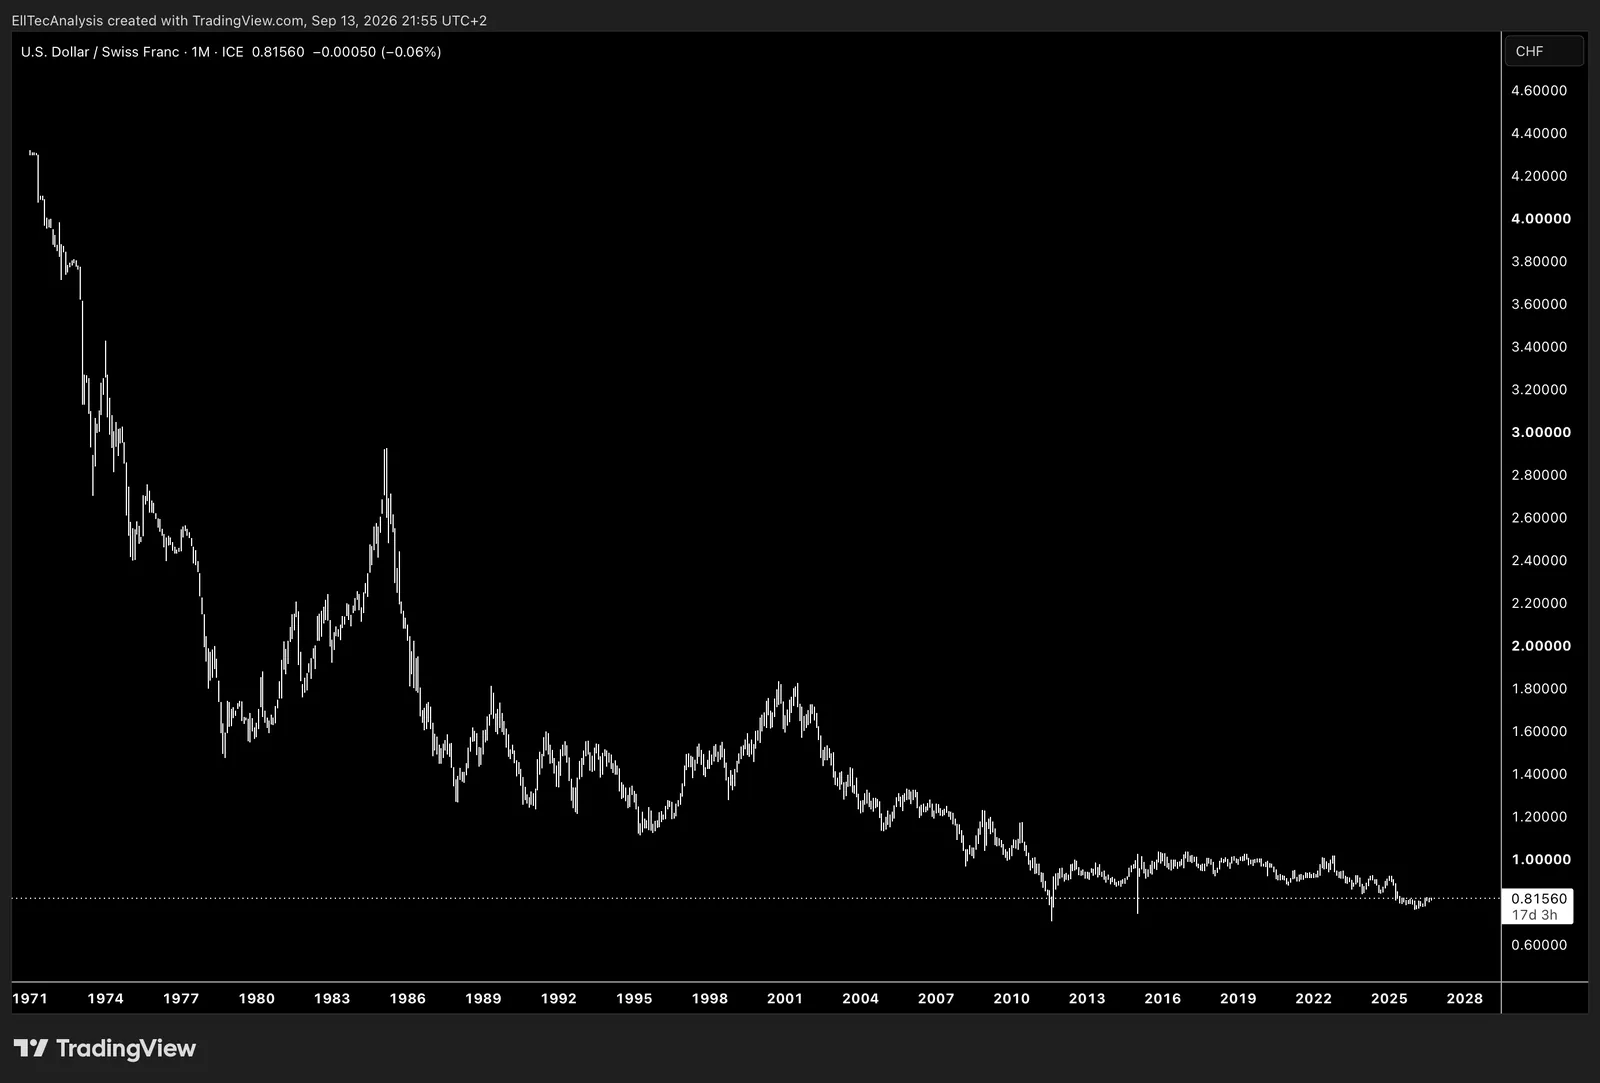
Shows the exchange rate between the US Dollar ant the Swiss Franc and can be used to track currency market trends, assess relative economic strength, and support international investment or trade decisions.
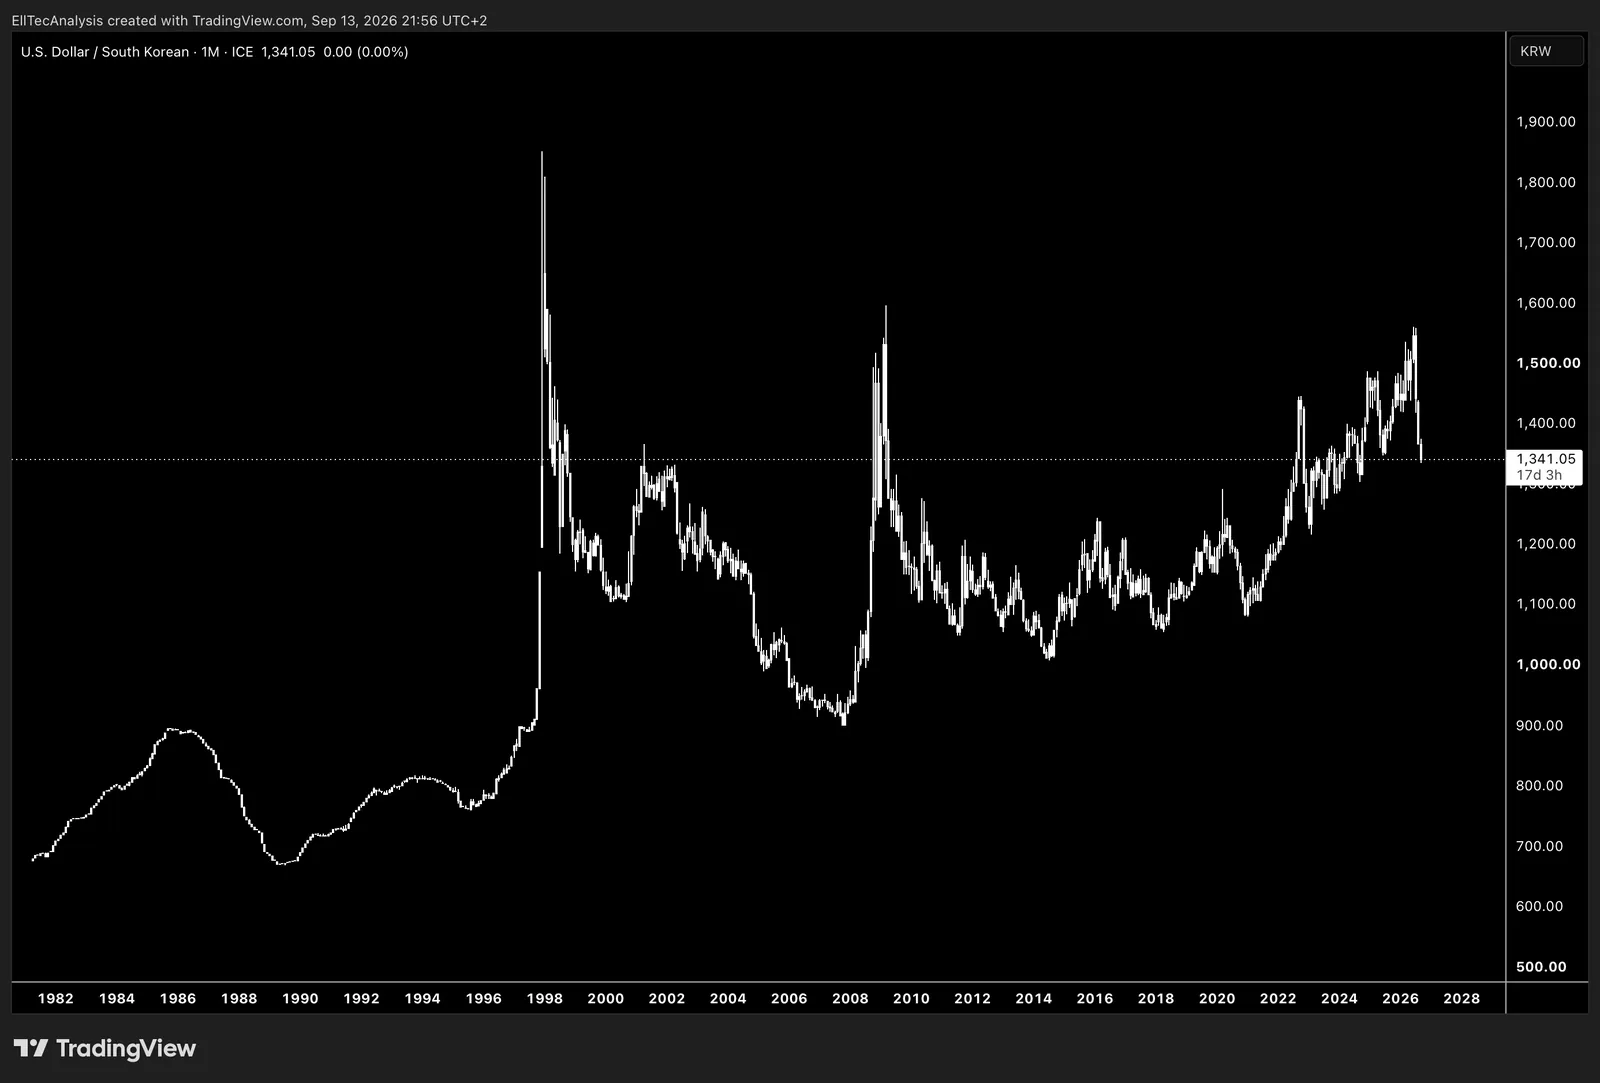
Shows the exchange rate between the US Dollar ant the South Korean Won and can be used to track currency market trends, assess relative economic strength, and support international investment or trade decisions.
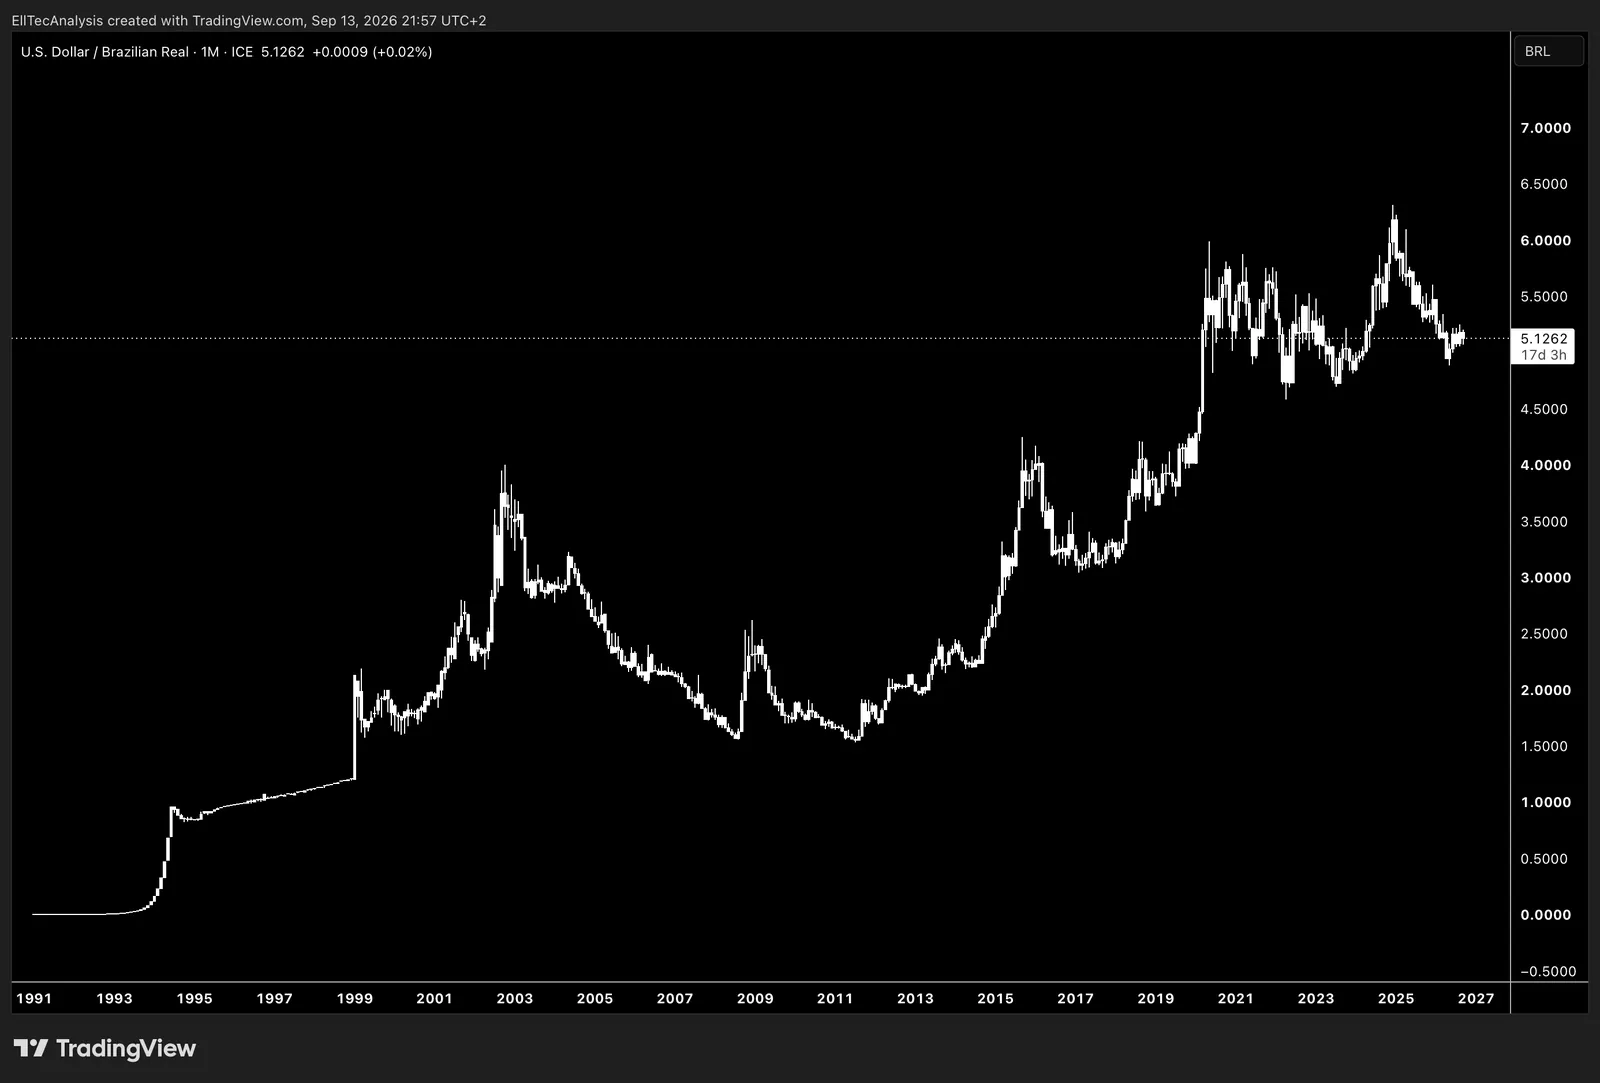
Shows the exchange rate between the US Dollar ant the Brazilian Real and can be used to track currency market trends, assess relative economic strength, and support international investment or trade decisions.
Liquidity
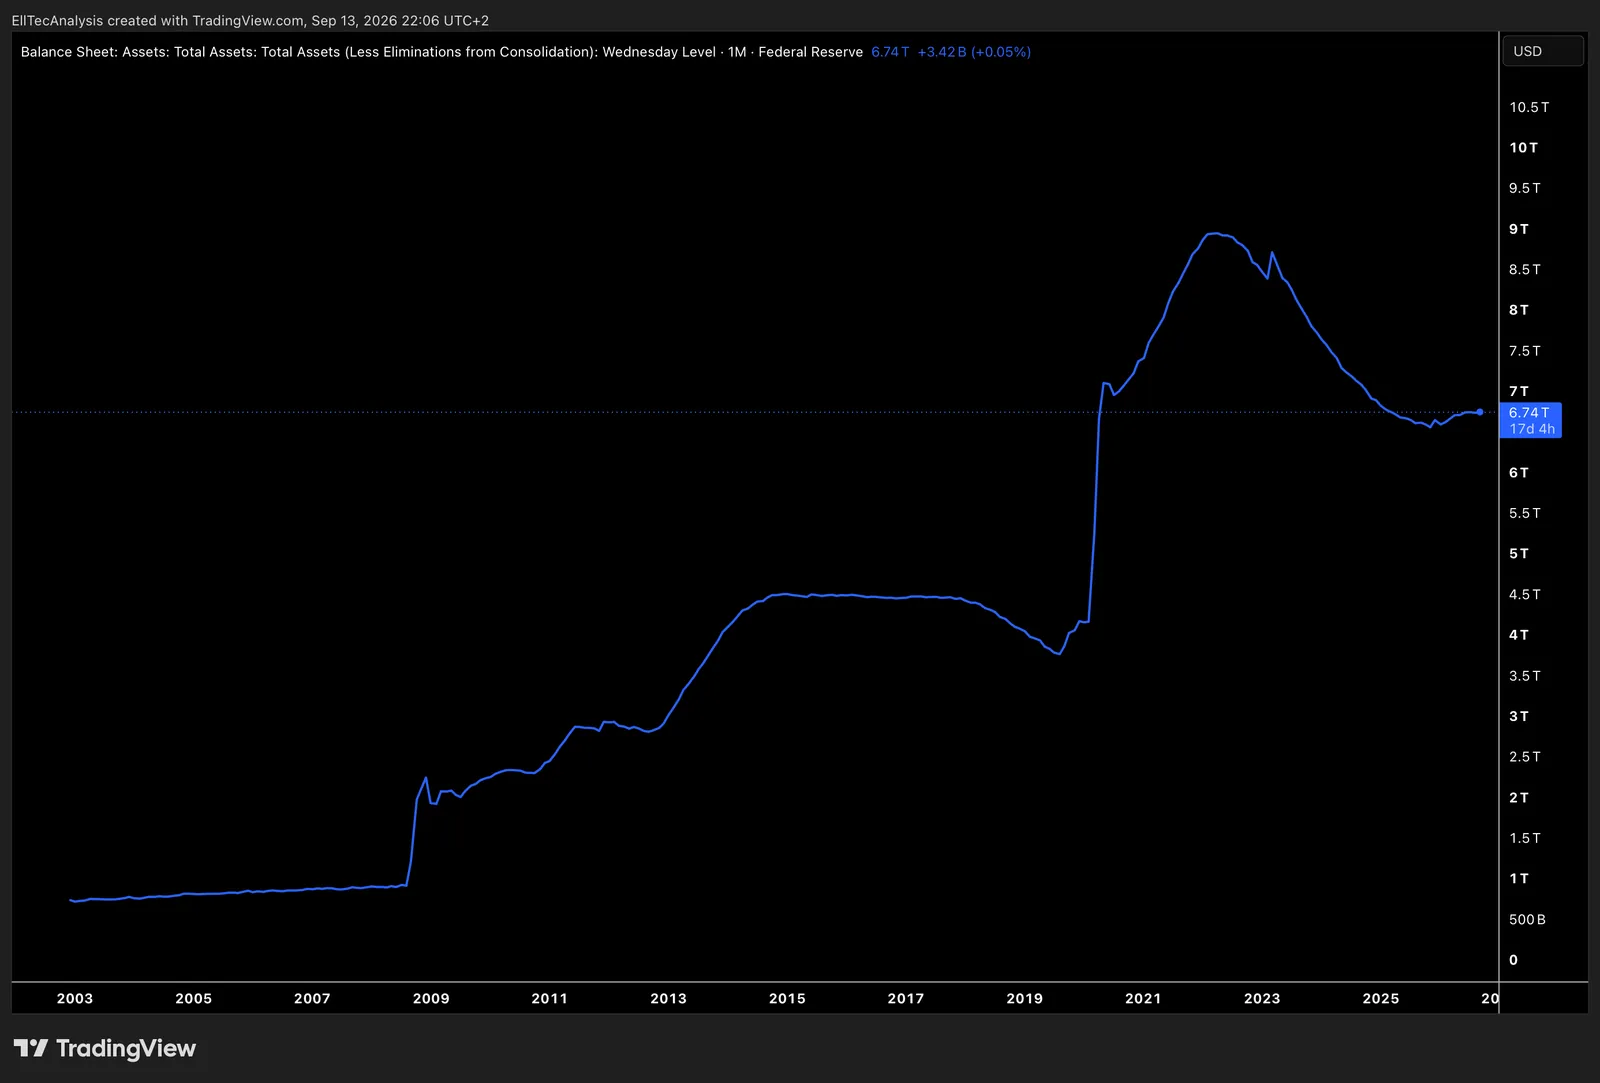
Shows the size and evolution of the Federal Reserve`s balance sheet and can be used to assess monetary policy, liquidity conditions, and the potential impact on financial markets.
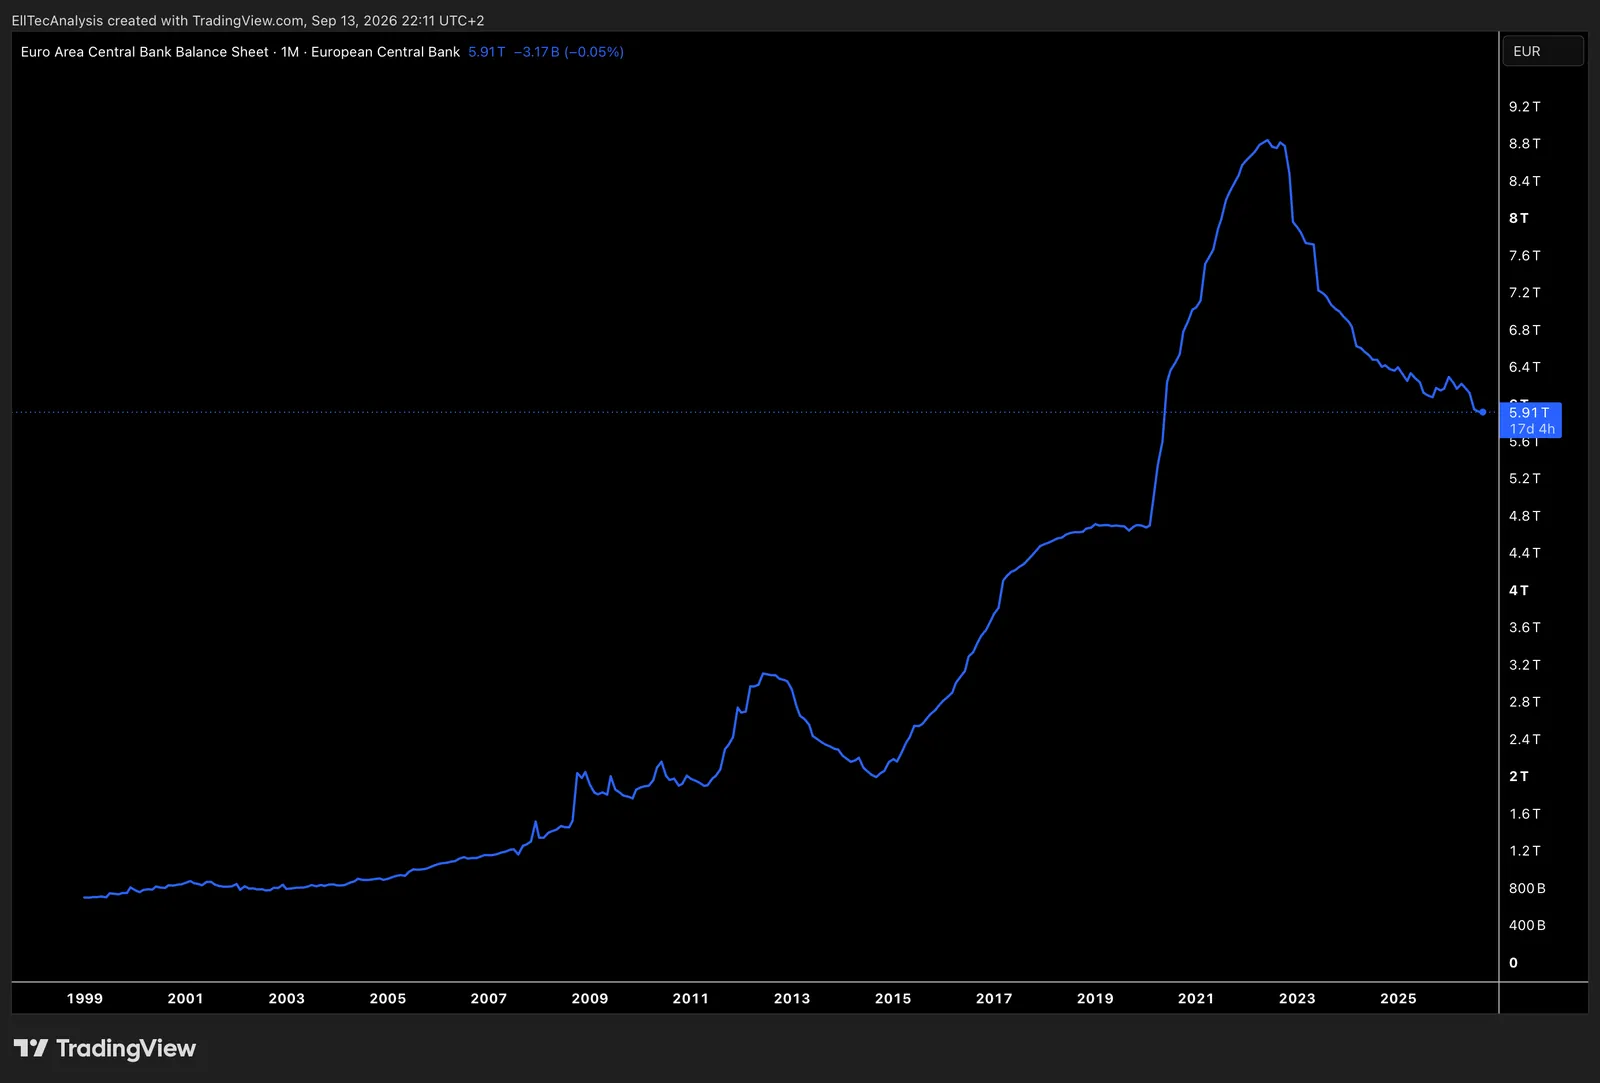
Shows the size and evolution of the Euro Area central bank and can be used to assess monetary policy, liquidity conditions, the potential impact on financial markets, and the overall stance of the European Central Bank (ECB).
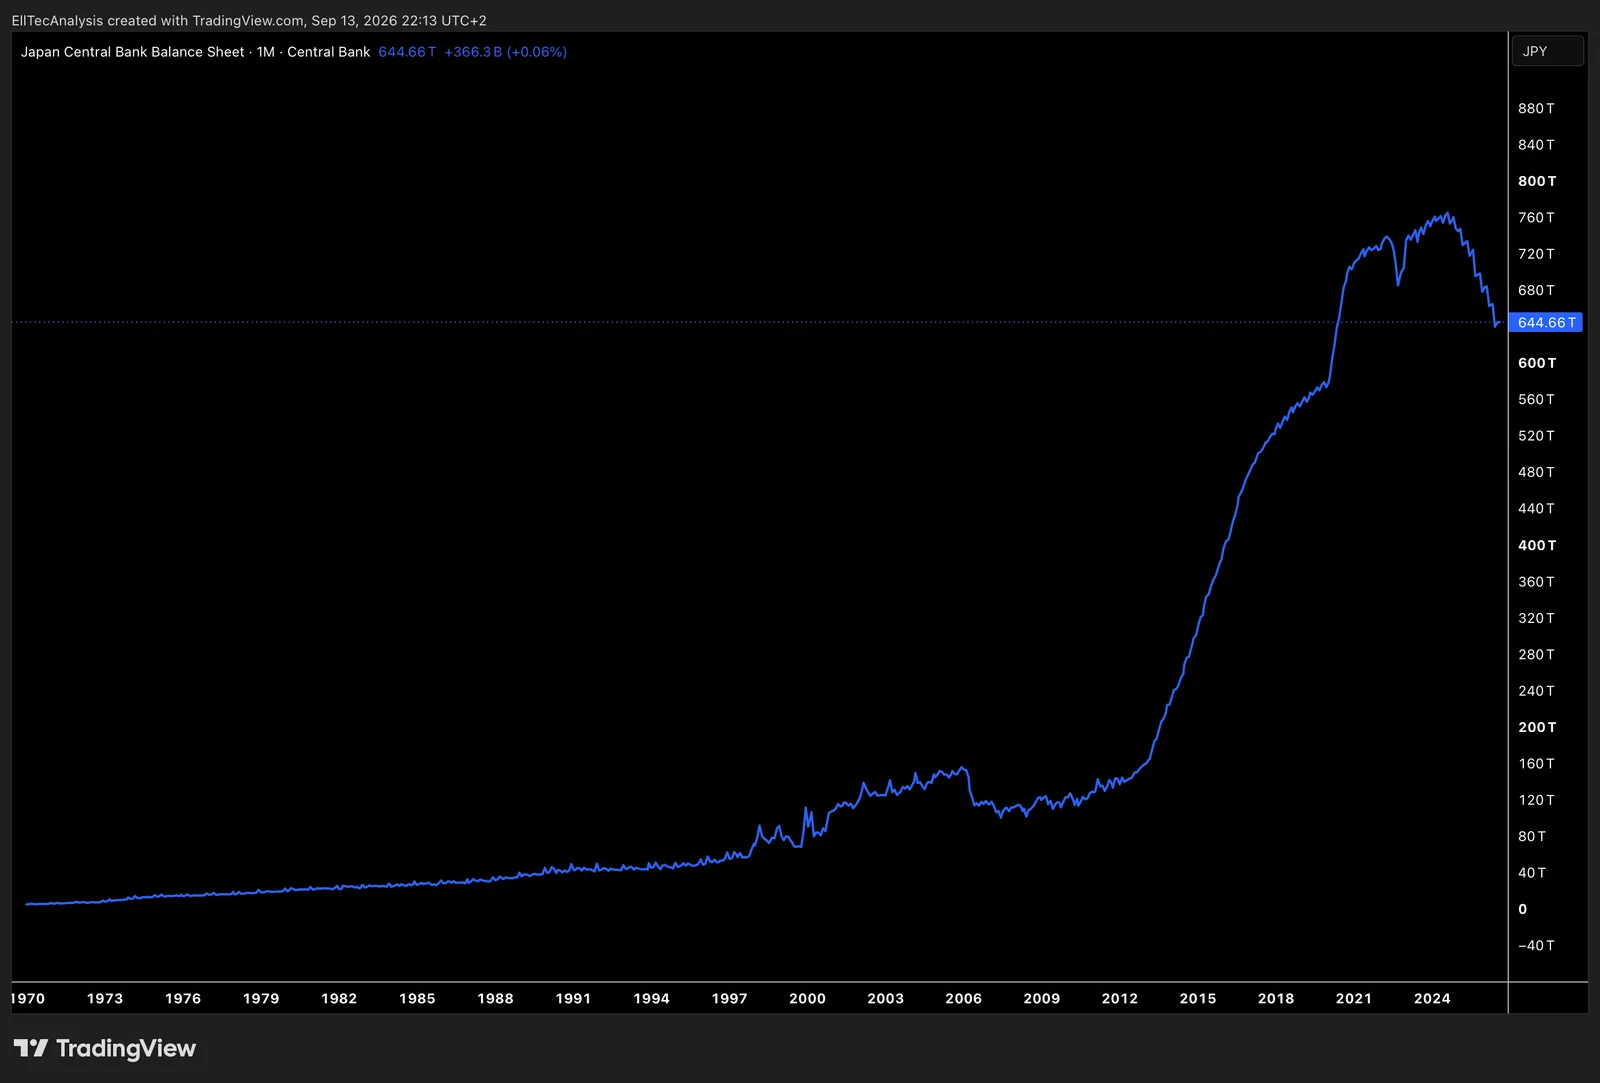
Shows the size and evolution of the Japanese central bank`s balance sheet and can be used to assess monetary policy, liquidity conditions, liquidity levels, and the Bank of Japan market influence.
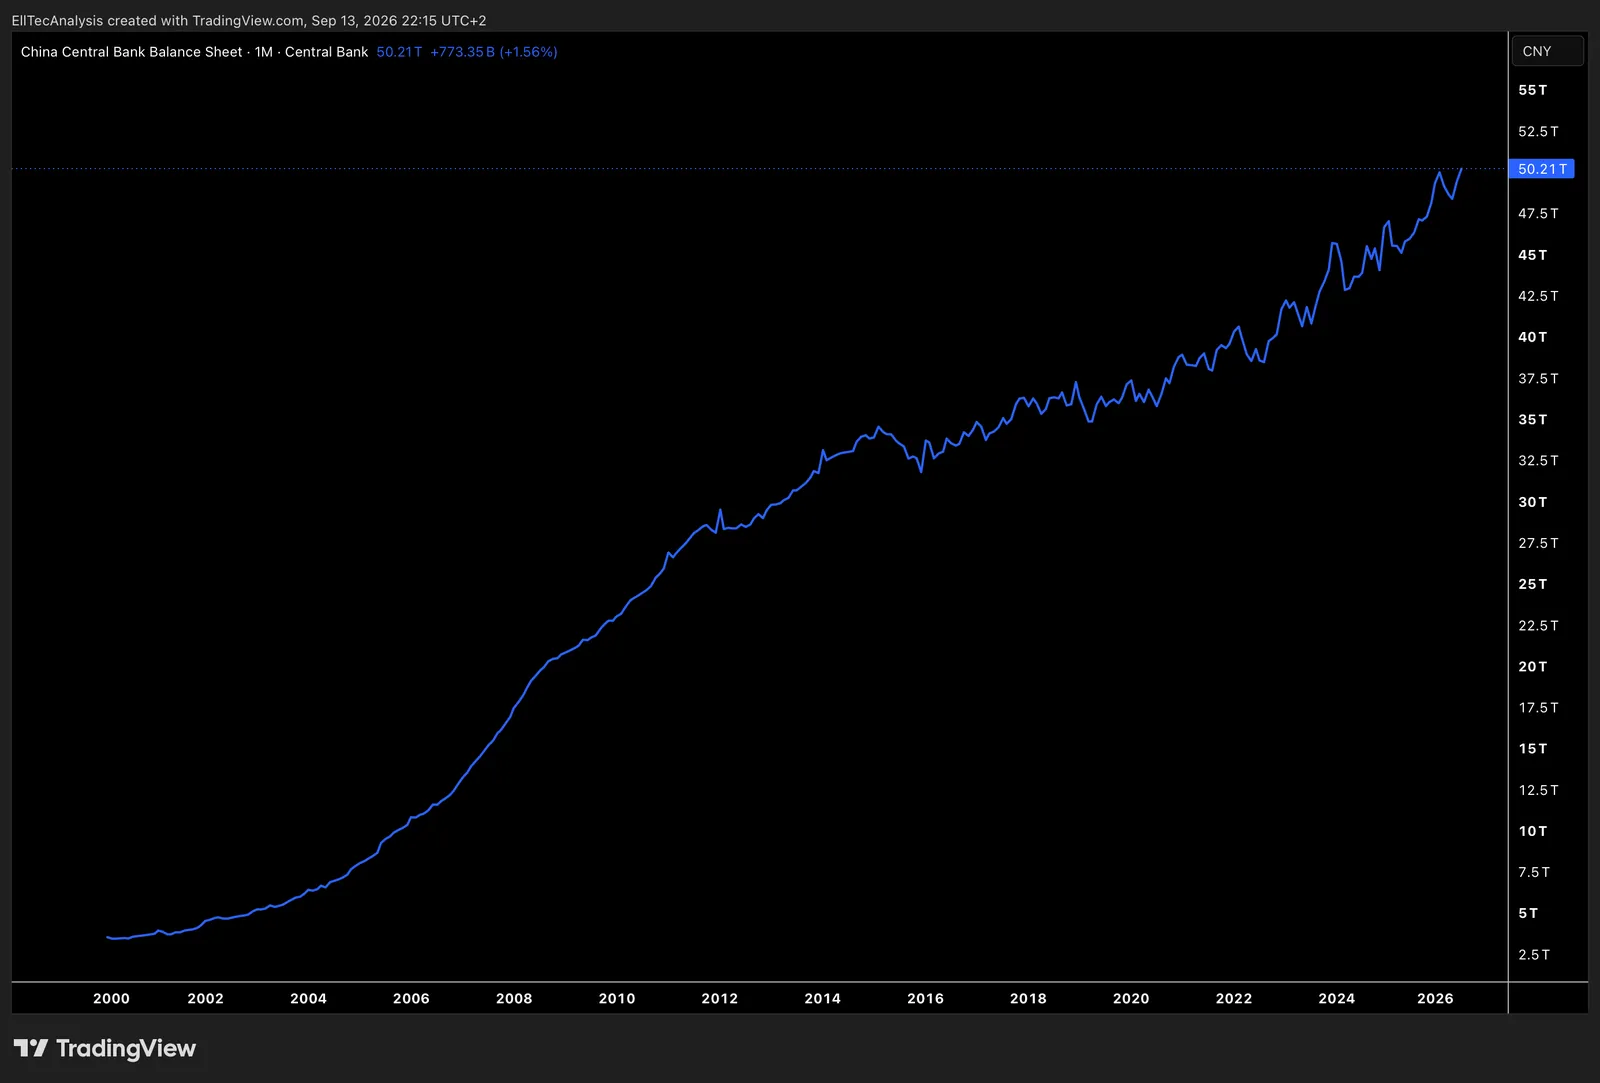
Shows the size and evolution of the Chinese central bank`s balance sheet and can be used to assess monetary policy, liquidity conditions, liquidity levels, and potential impacts on economic growth and financial markets.
US Liquidity
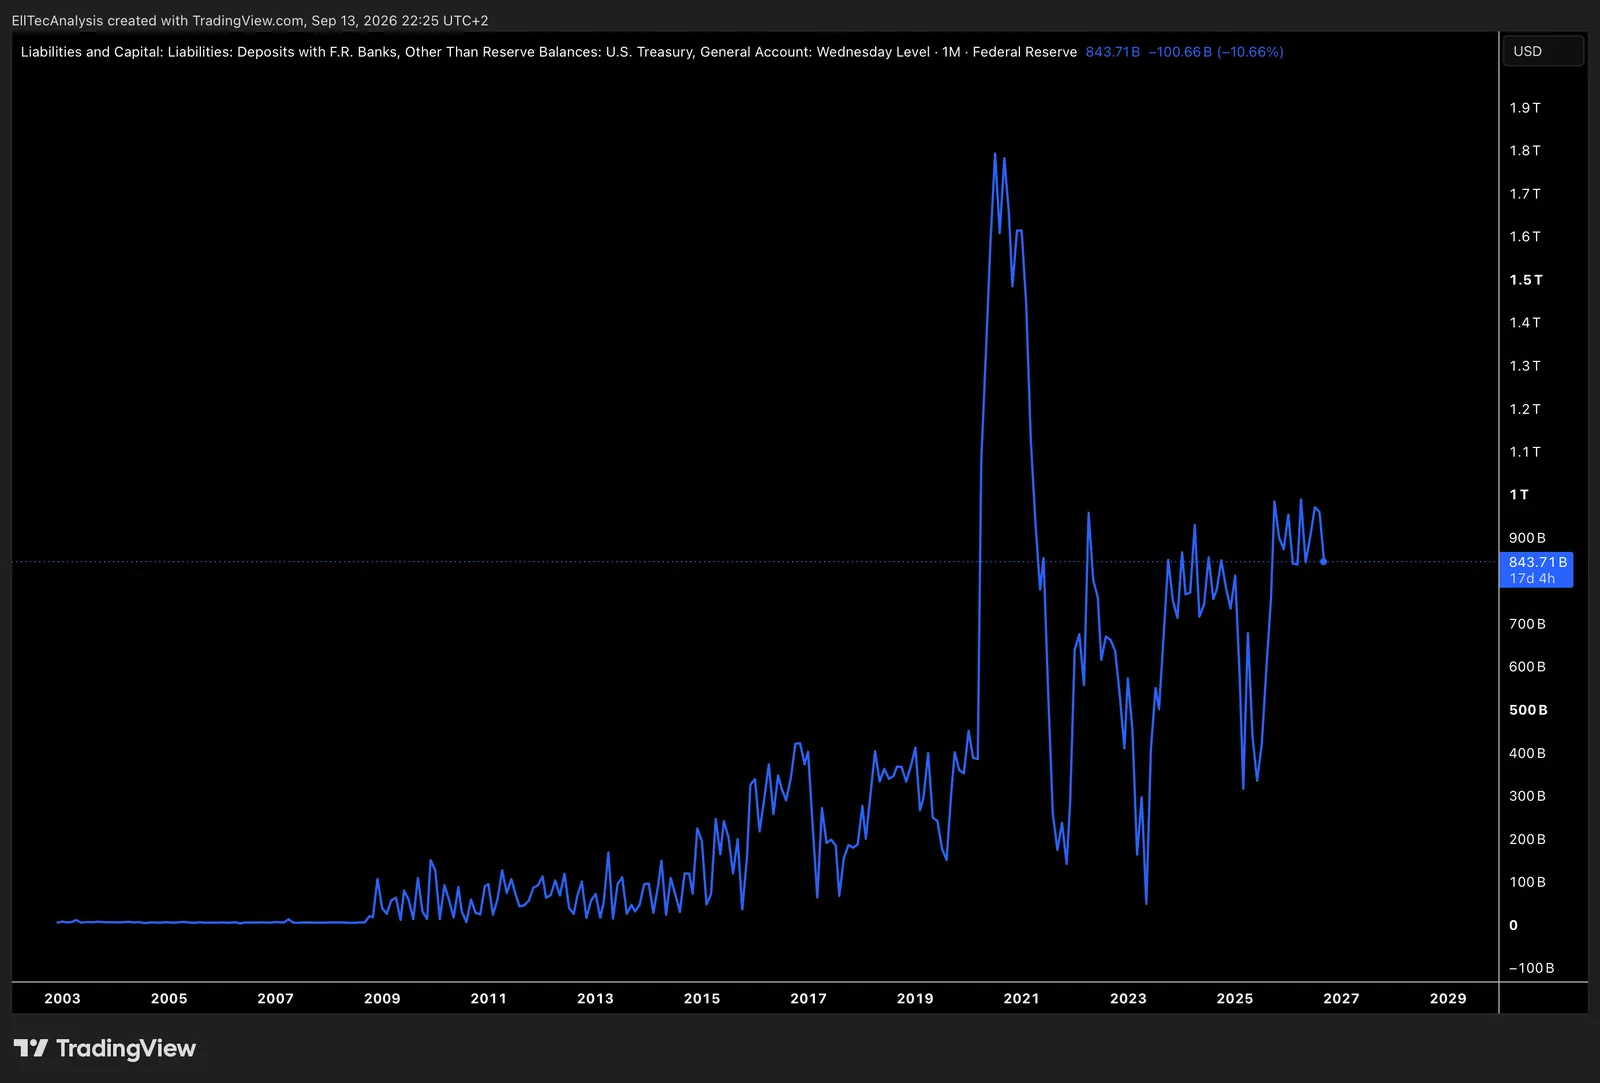
Shows the balance of the US Treassury General Account (TGA) at the Federal Reserve and can be used to monitor government cash flows and assess their impact on market liquidity and financial conditions.
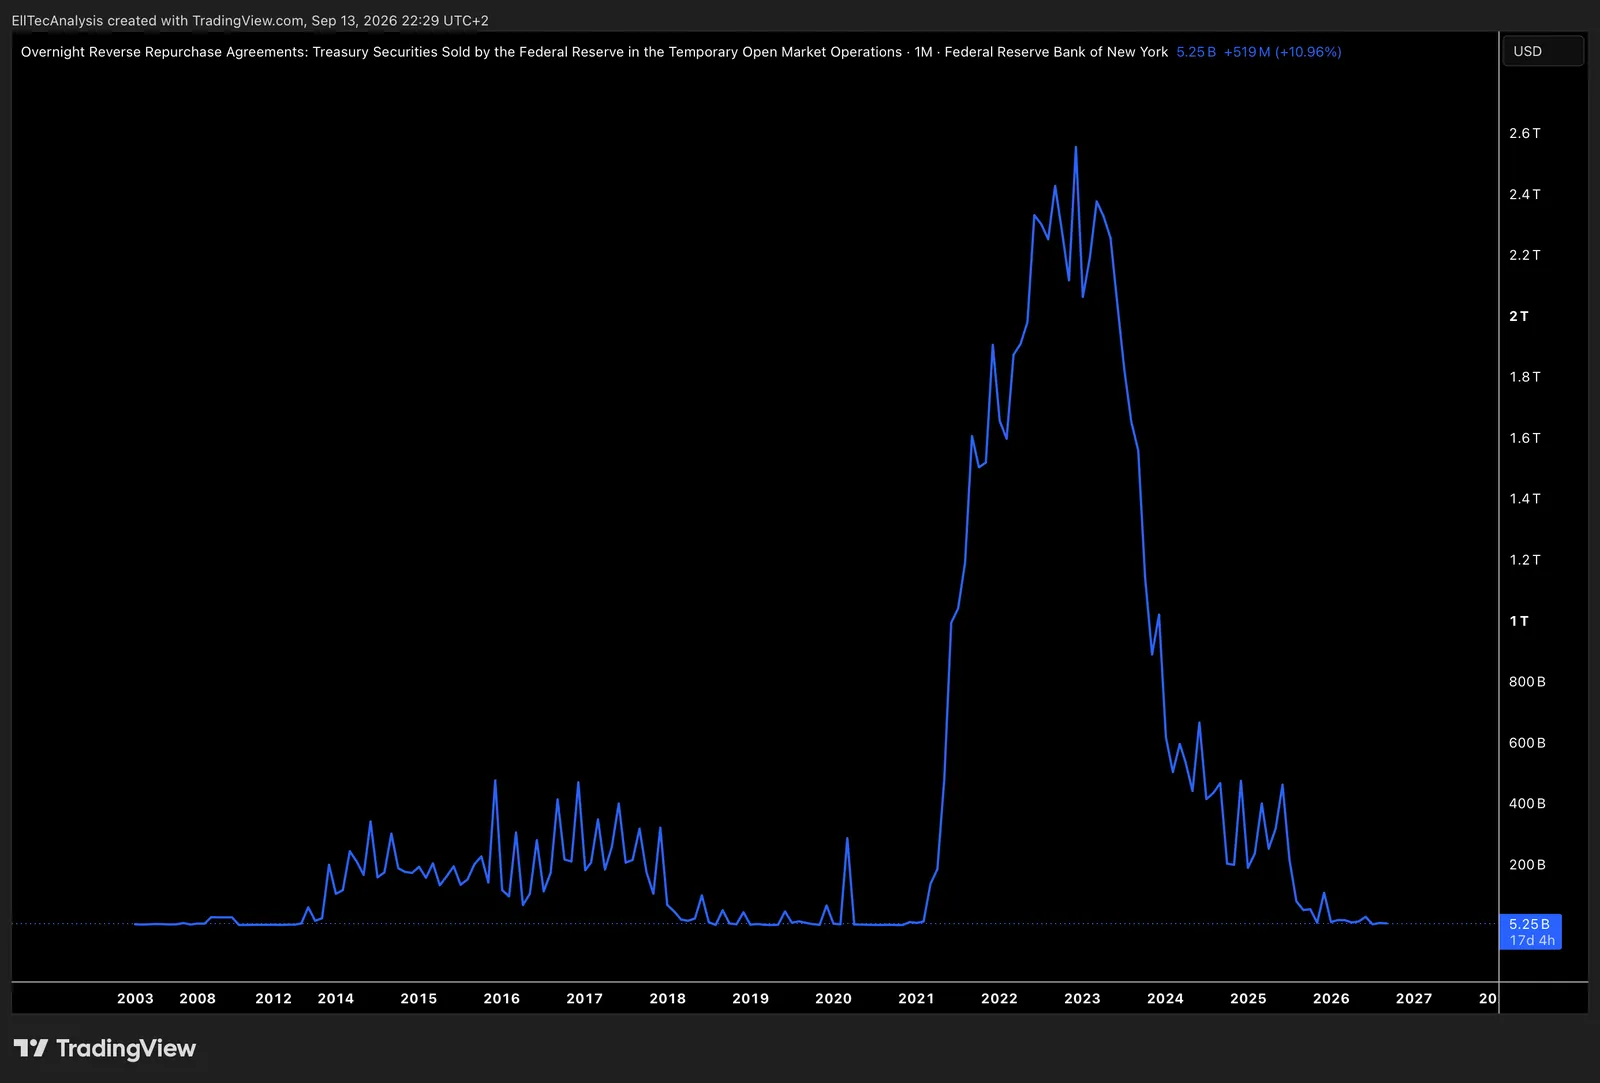
Shows the volumne of US Federal Reserve repurchase agreements (RRP) and can be used to monitor excess liquidity in the financial system and asess short-term money market conditions.
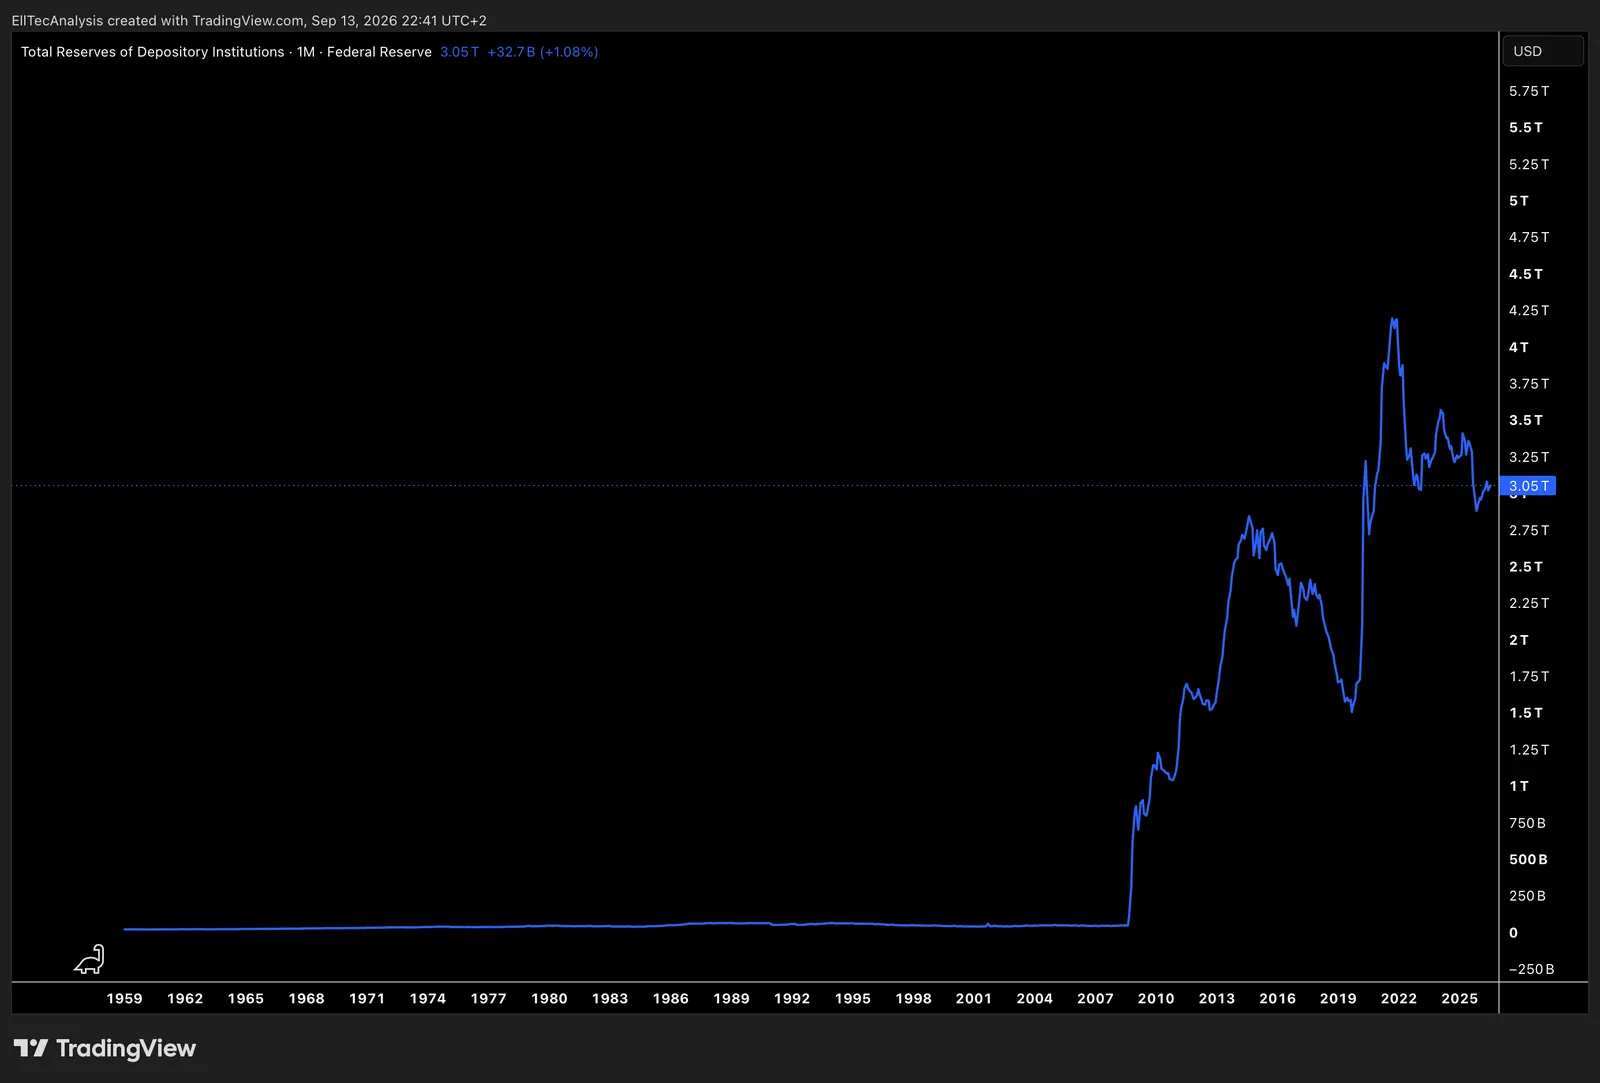
Shows the total reserves held by U.S. depository institutions, providing insight into banking‑system liquidity and helping analysts assess shifts in monetary policy conditions.
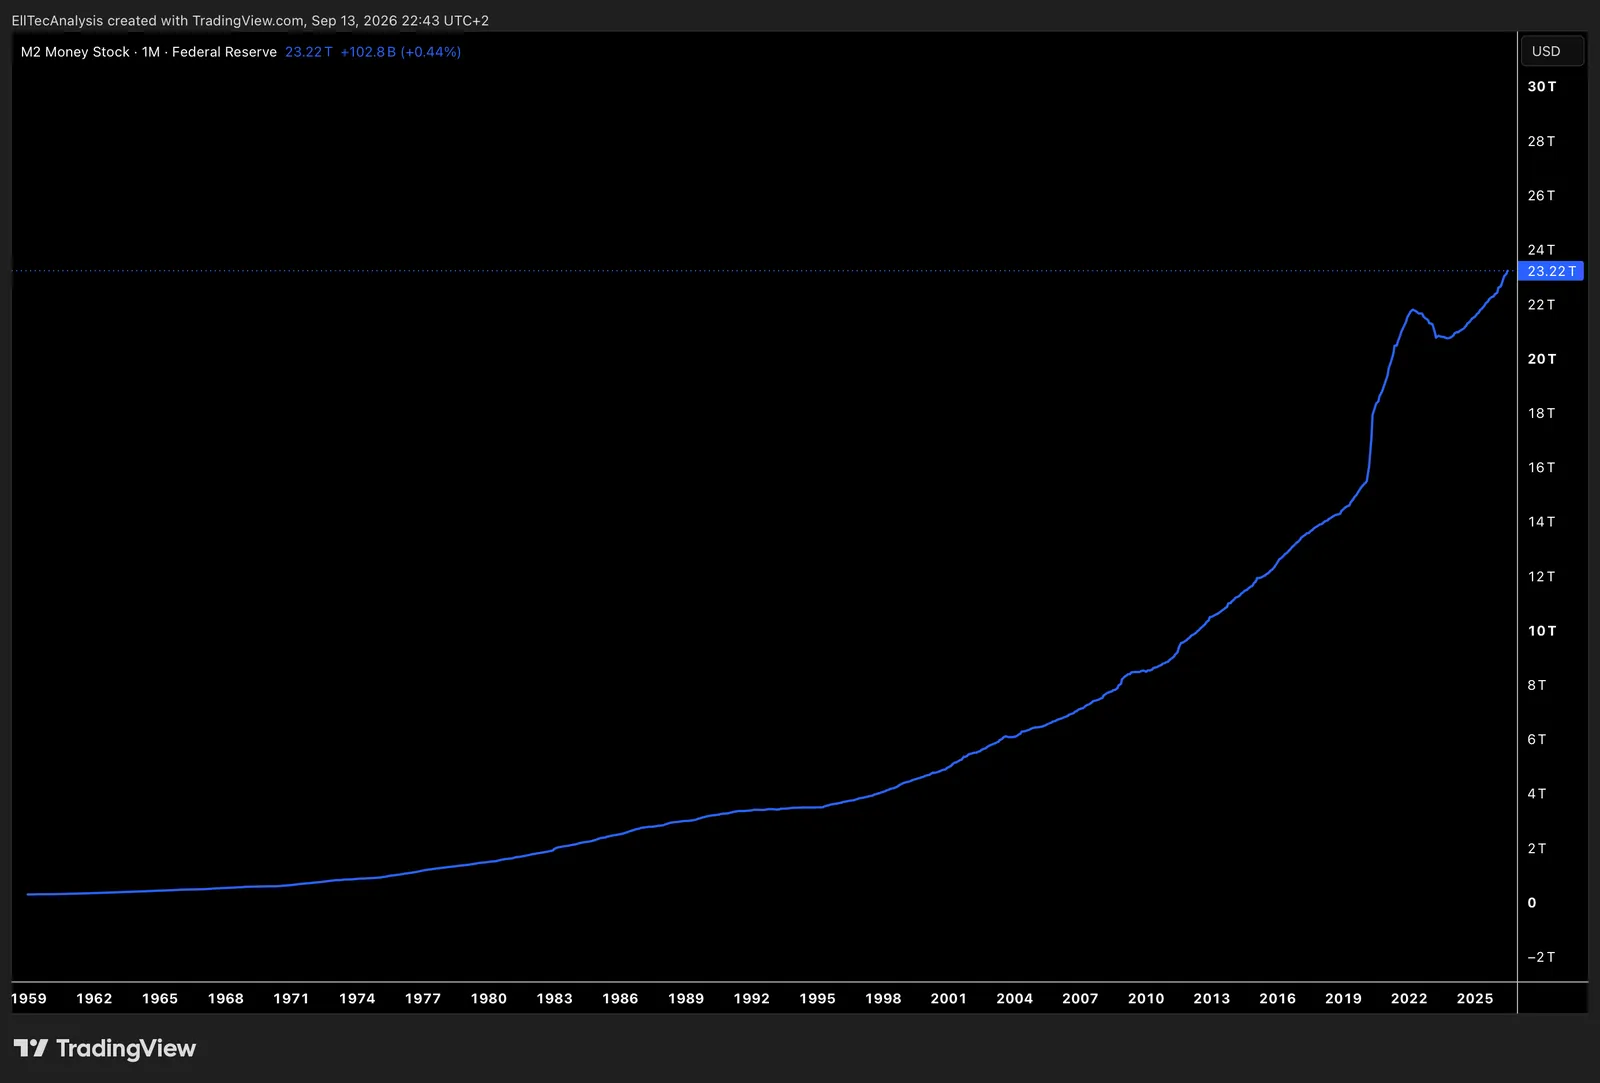
Tracks the growth of the U.S. M2 money supply, offering a clear view of long‑term dollar inflation dynamics and helps to understand how monetary expansion influences asset prices and purchasing power.
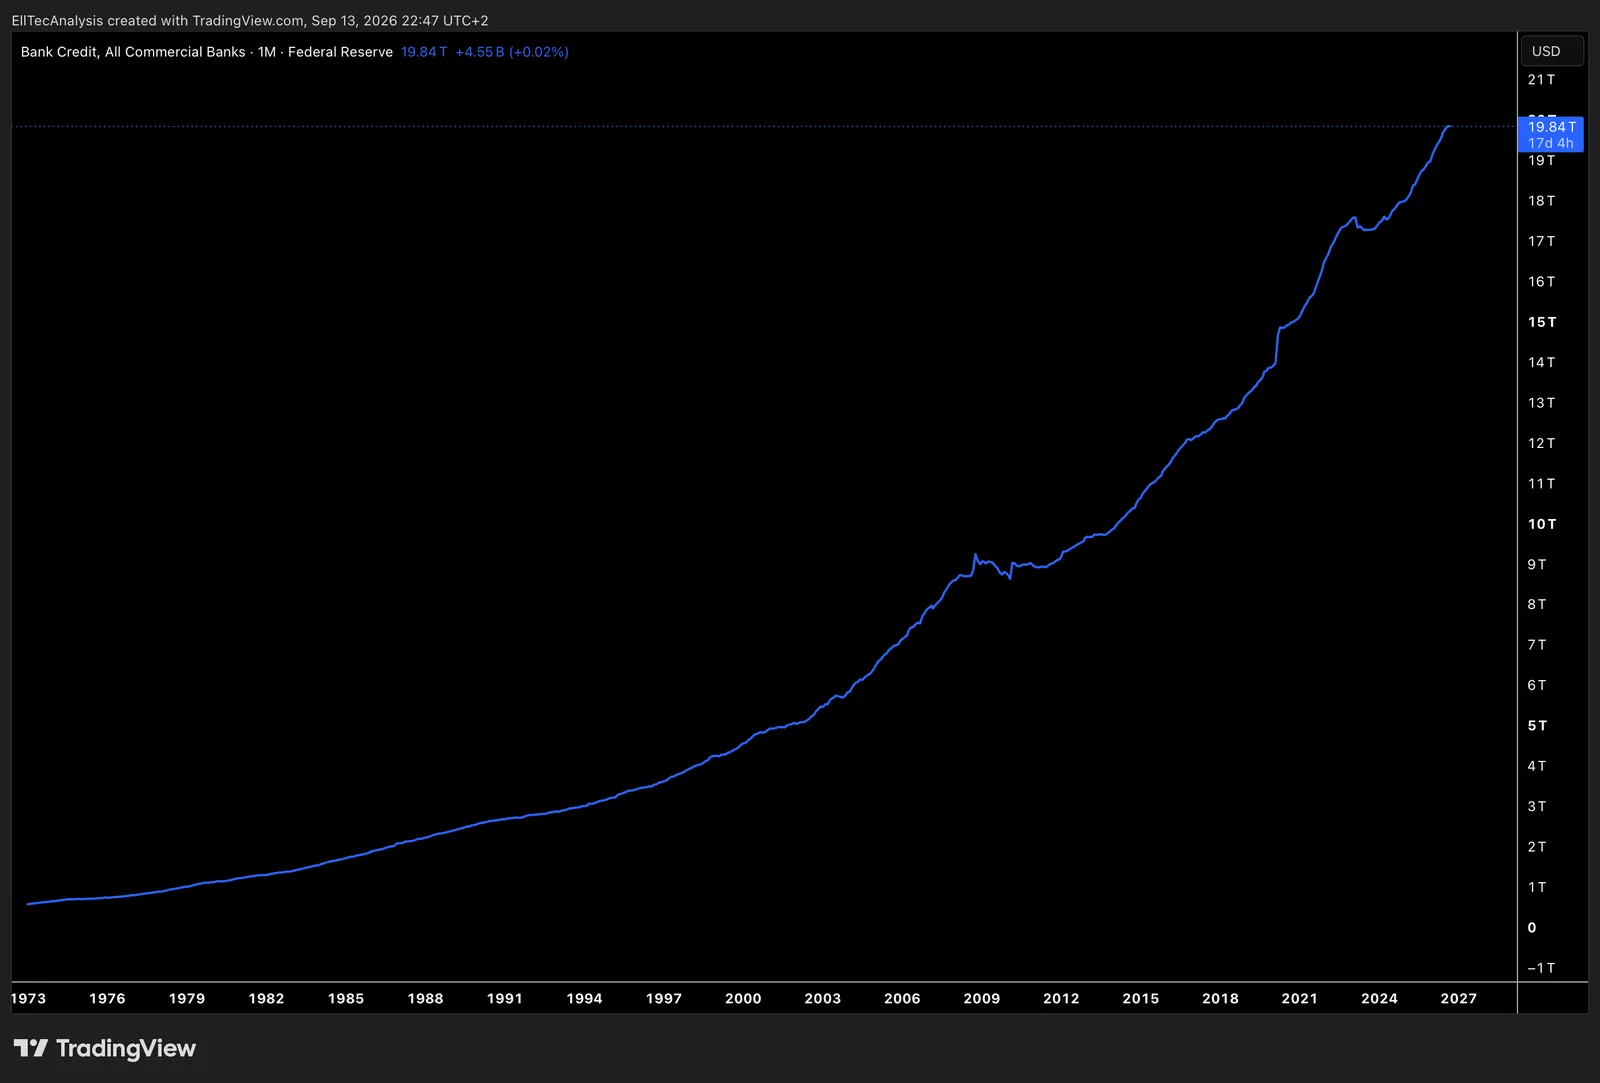
Shows how commercial bank credit has developed over time, illustrating broad lending activity across the banking sector and offering a clear view of shifts in overall credit expansion.
Europe Liquidity
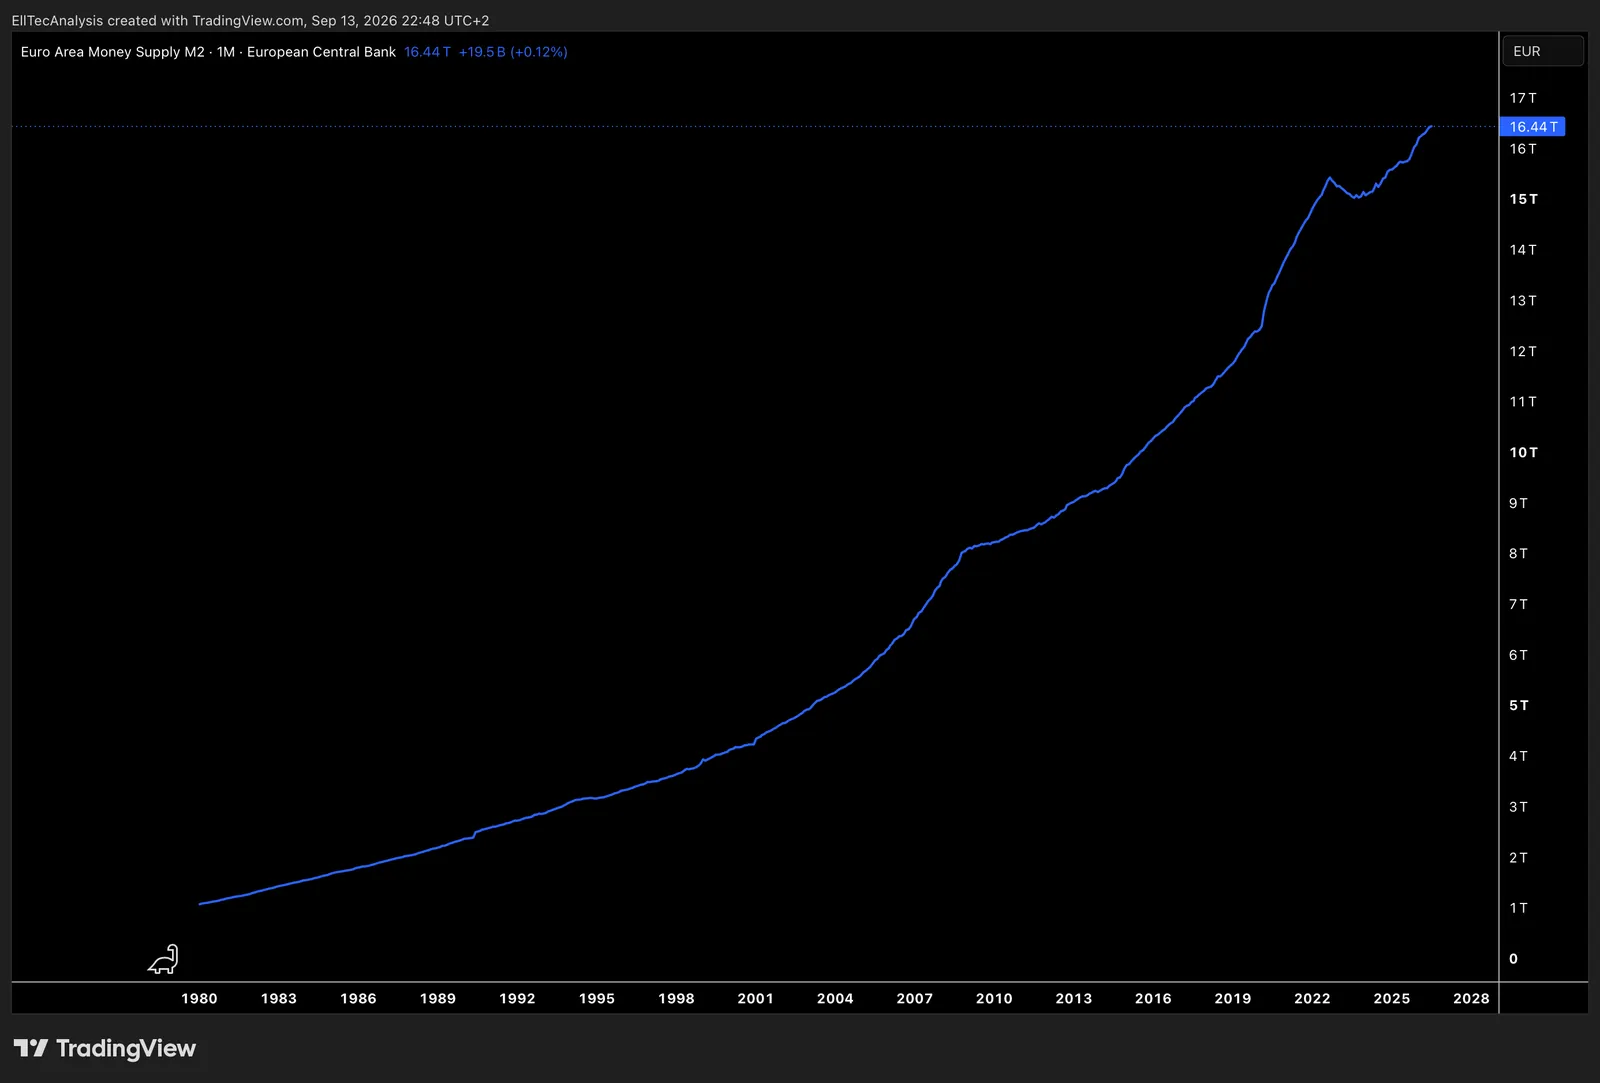
Shows how the Eurozone’s M2 money supply has changed over time, offering a clear view of broad monetary expansion and its influence on overall liquidity conditions within the euro area.
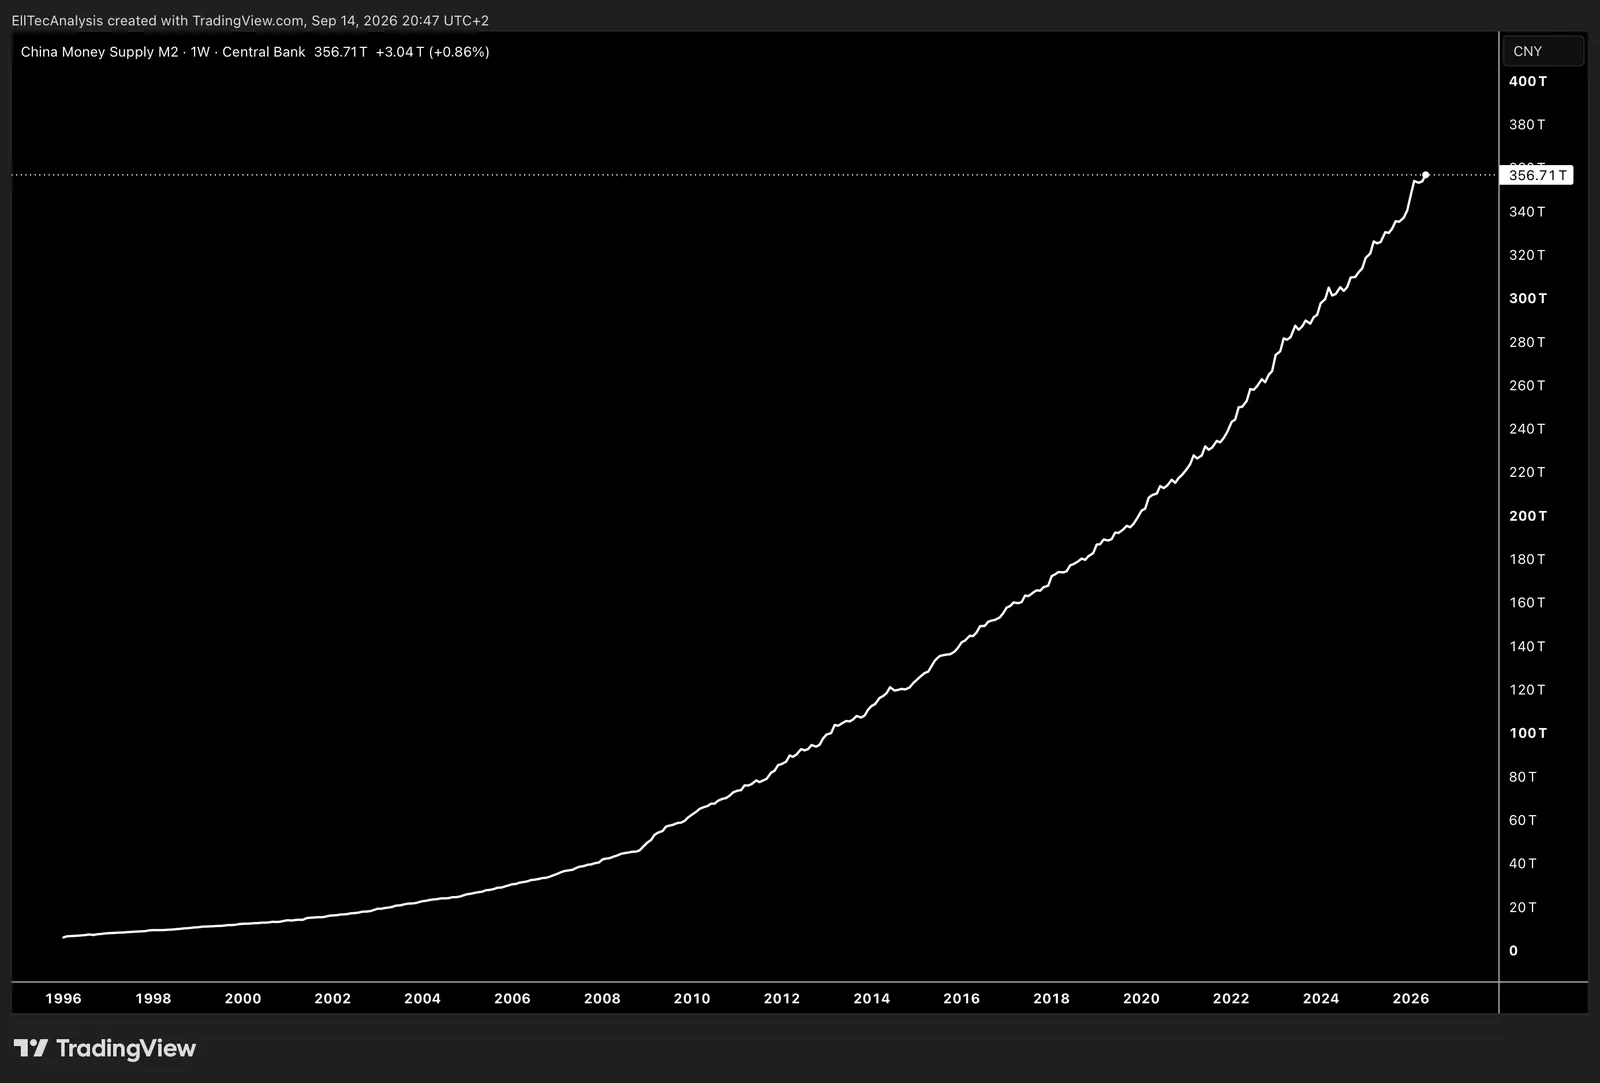
Shows how China’s M2 money supply has expanded over time, offering a clear view of broad liquidity growth and its role in shaping overall monetary conditions in the Chinese economy
Financial Conditions
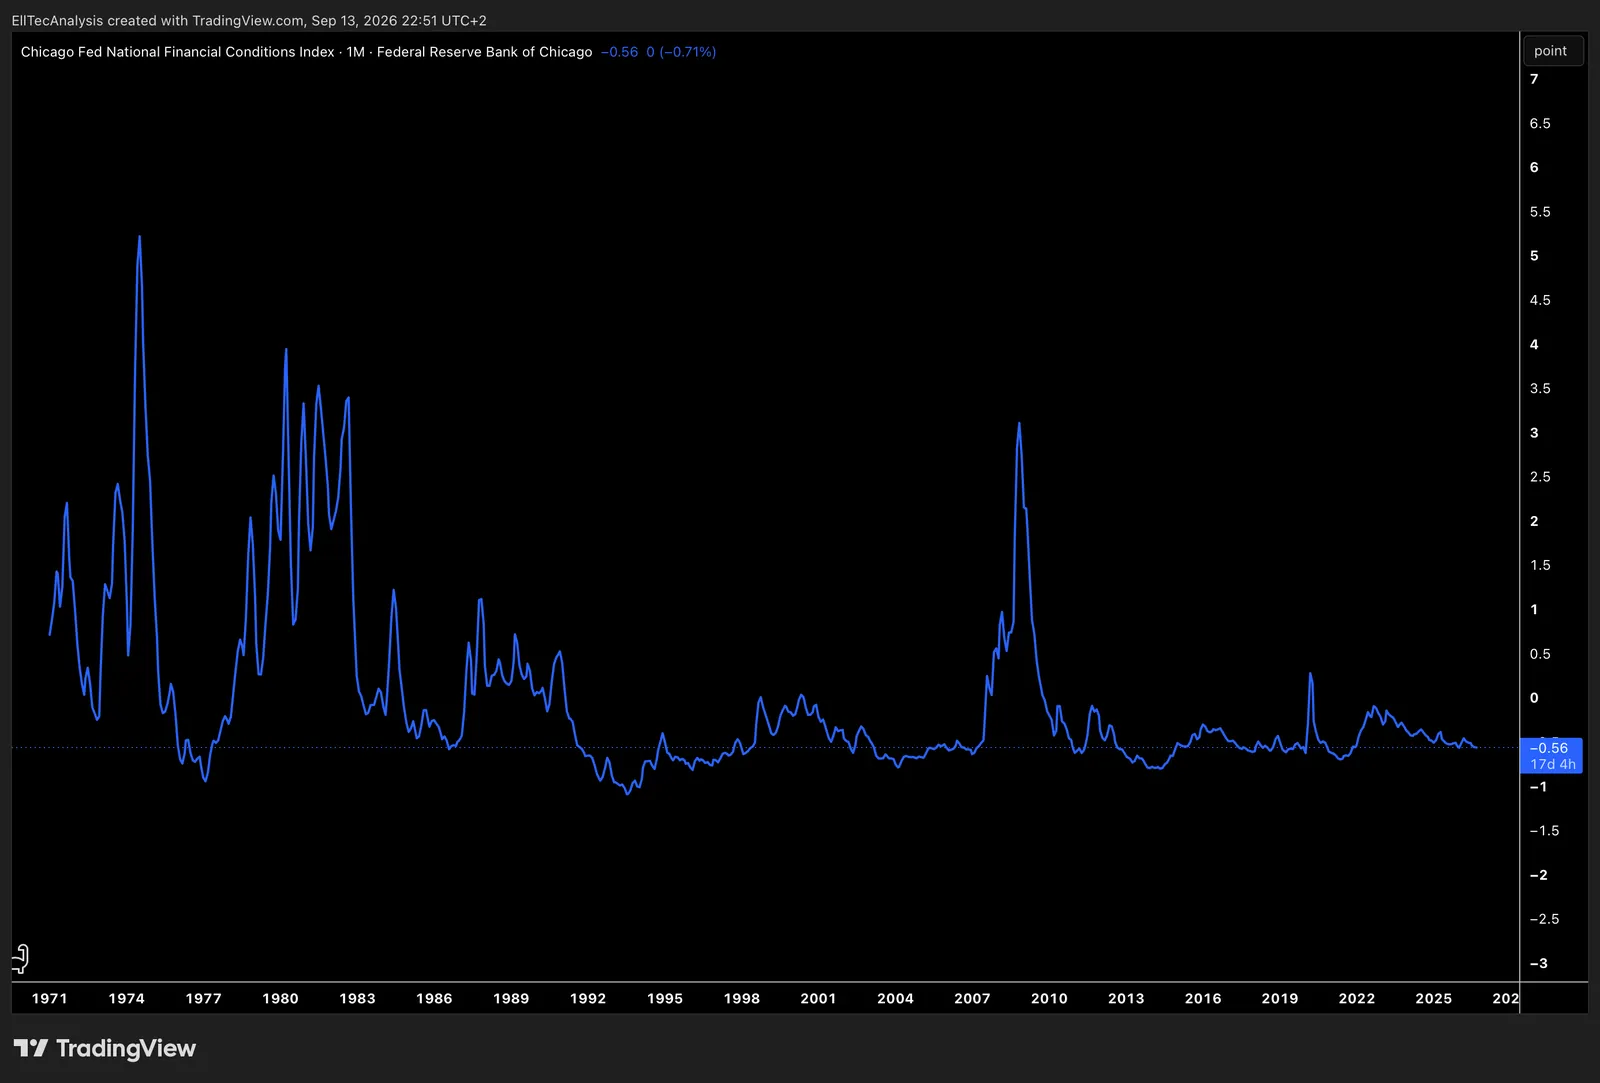
Shows how the Chicago Fed National Financial Conditions Index moves over time, offering a clear view of tightening or loosening financial conditions across credit, leverage, and liquidity in the U.S. economy.
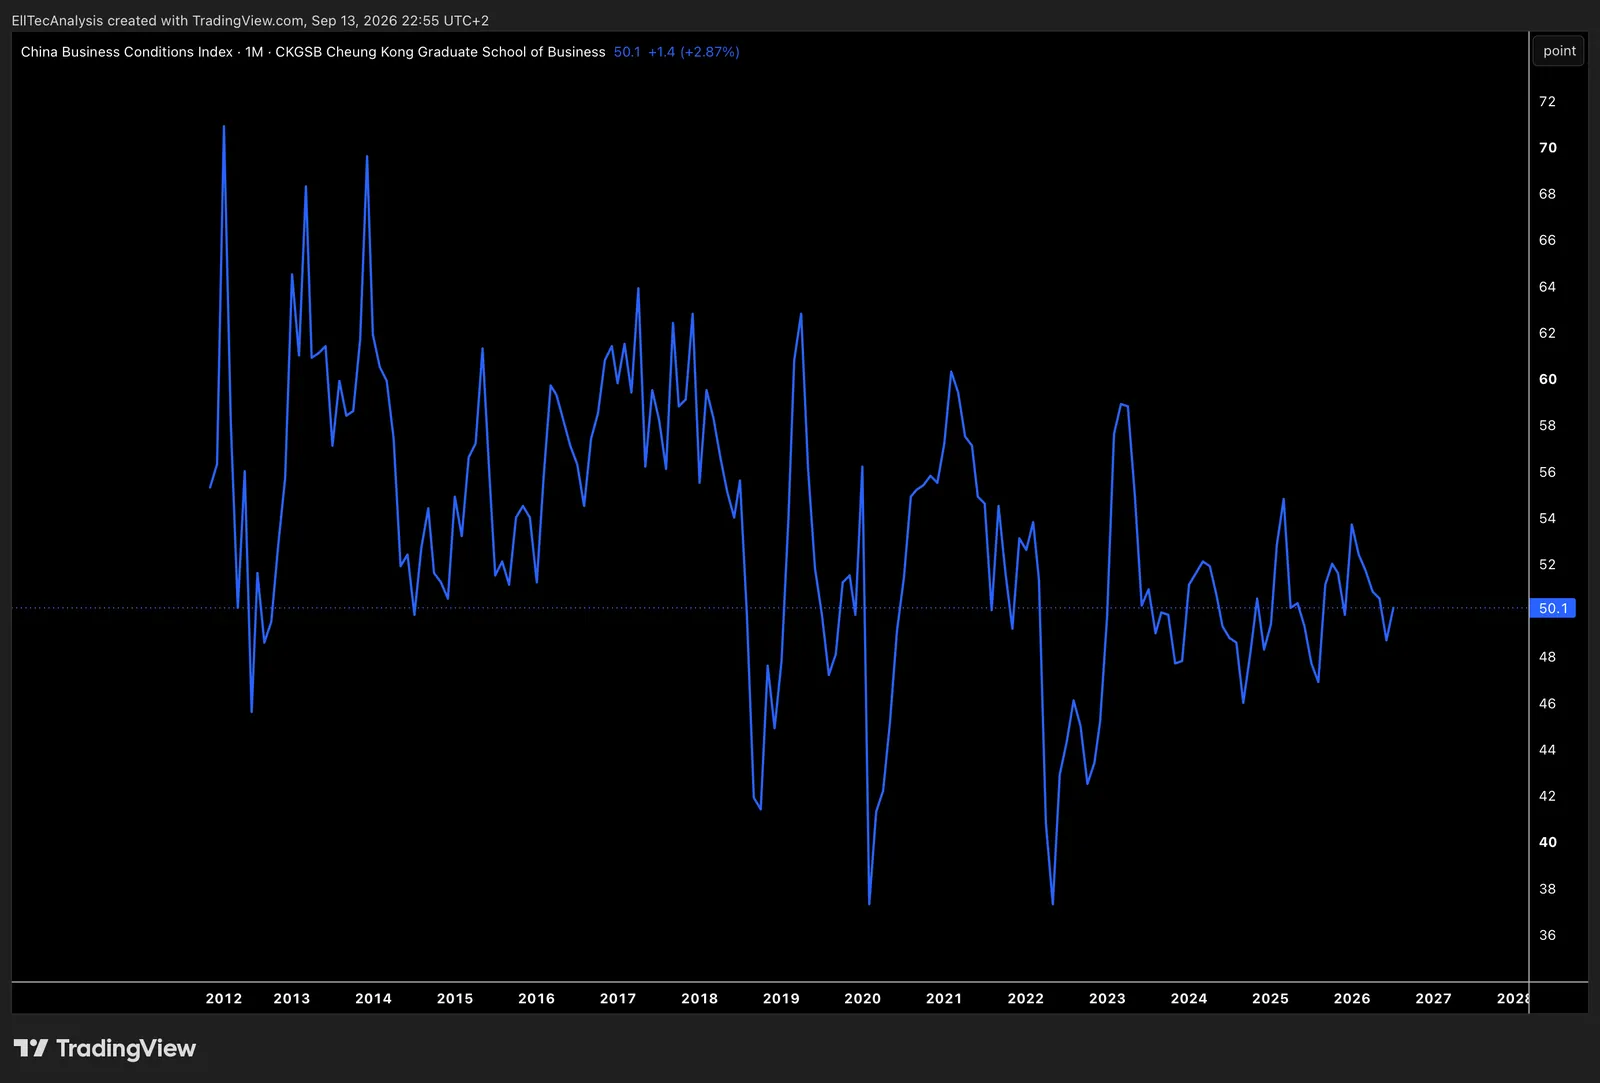
Shows how China’s business conditions have shifted over time, offering a clear view of changes in economic momentum and the broader environment for production, investment, and corporate activity.
Commodities
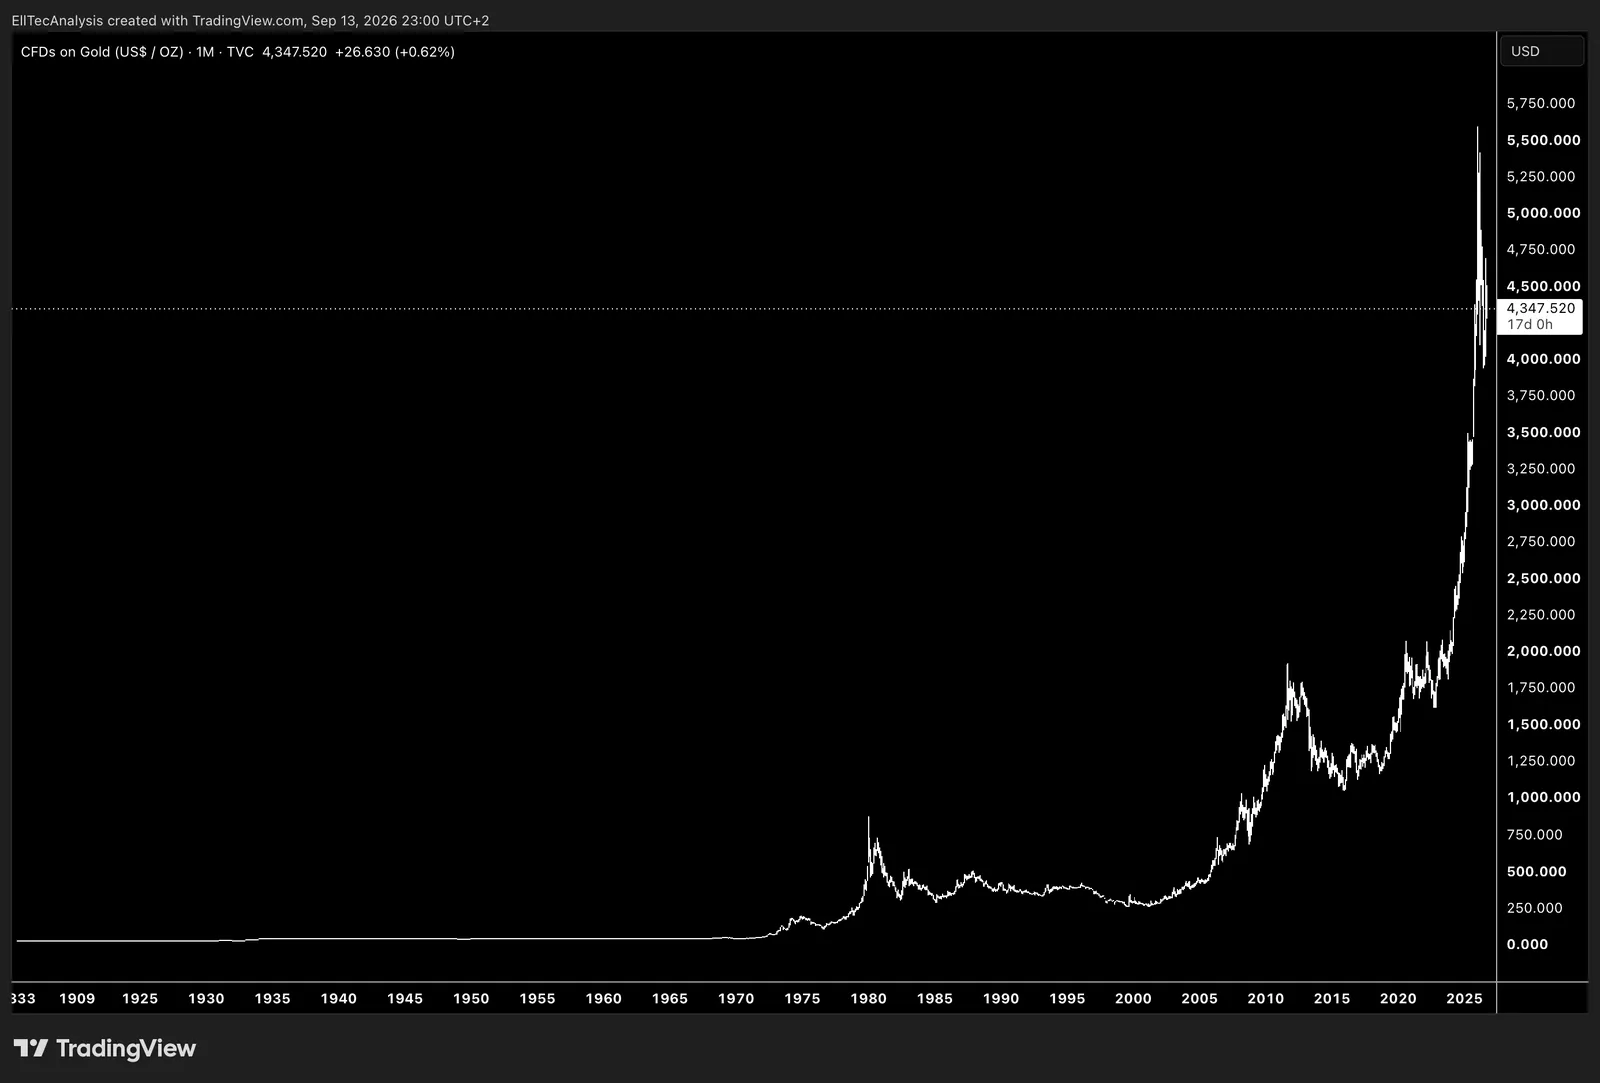
Shows how the Gold/USD price has moved over time, offering a clear view of shifts in gold’s value relative to the US dollar and how broader monetary or market conditions influence this relationship.
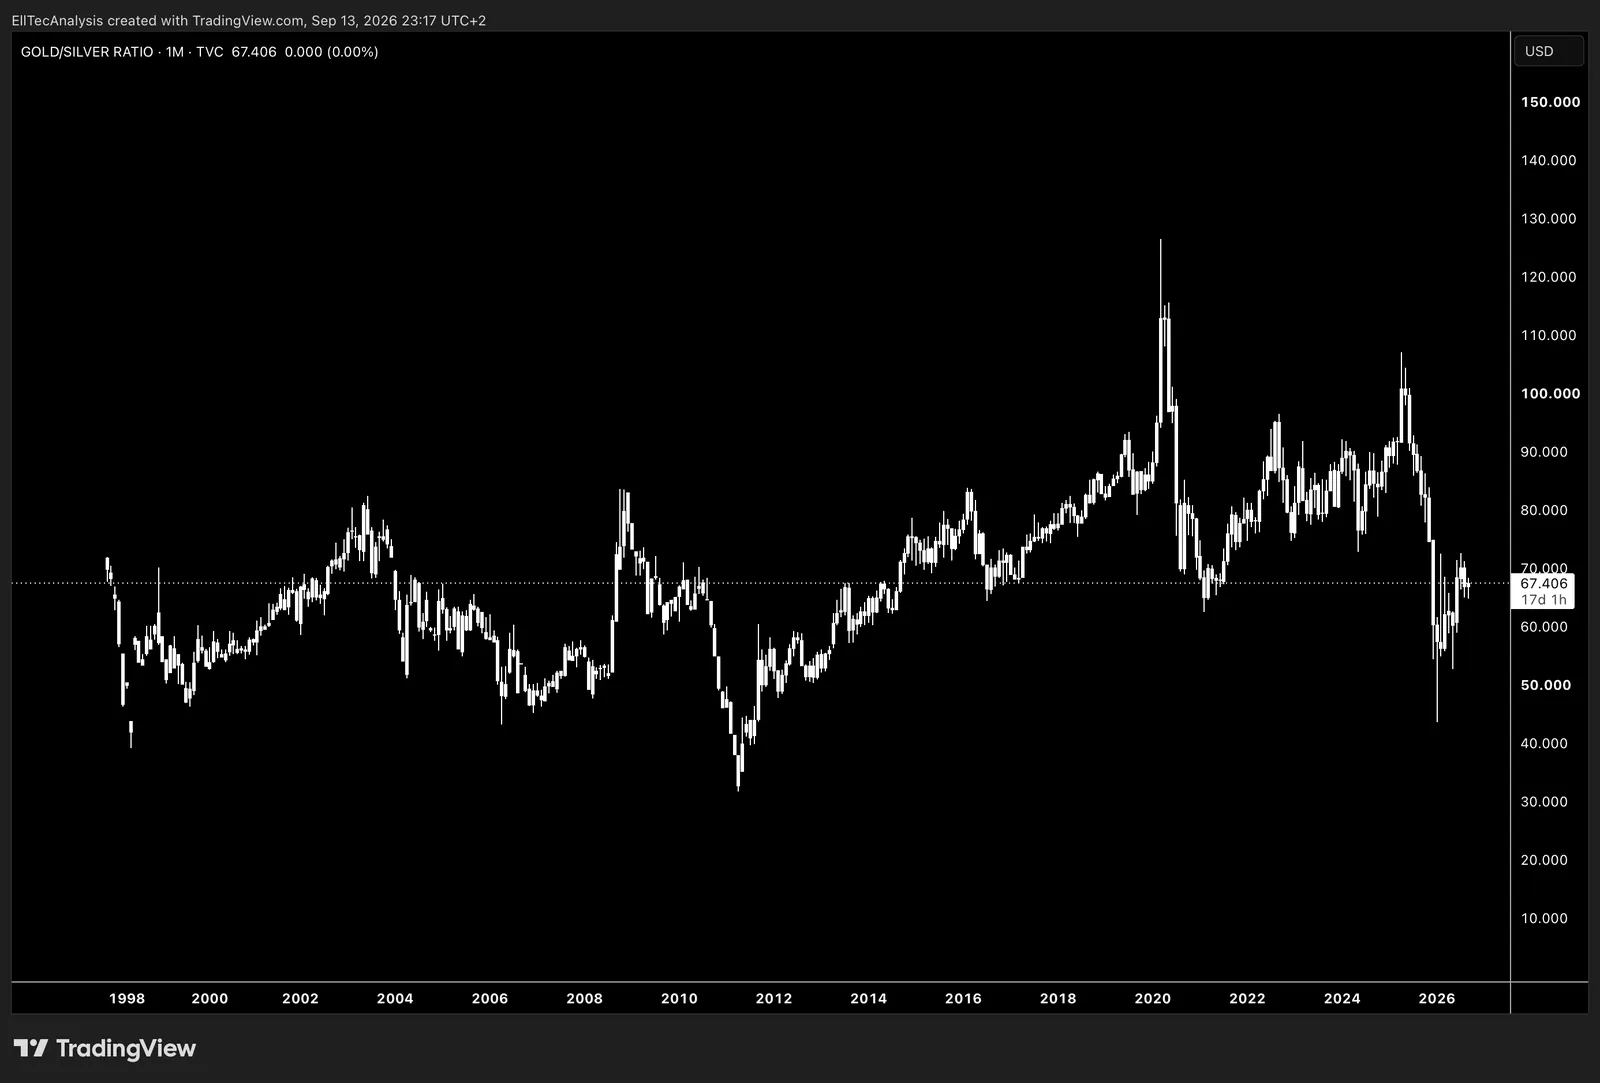
Shows how the Gold/Silver ratio has changed over time, offering a clear view of shifts in relative strength between the two metals and how broader market or monetary conditions influence their long‑term relationship.
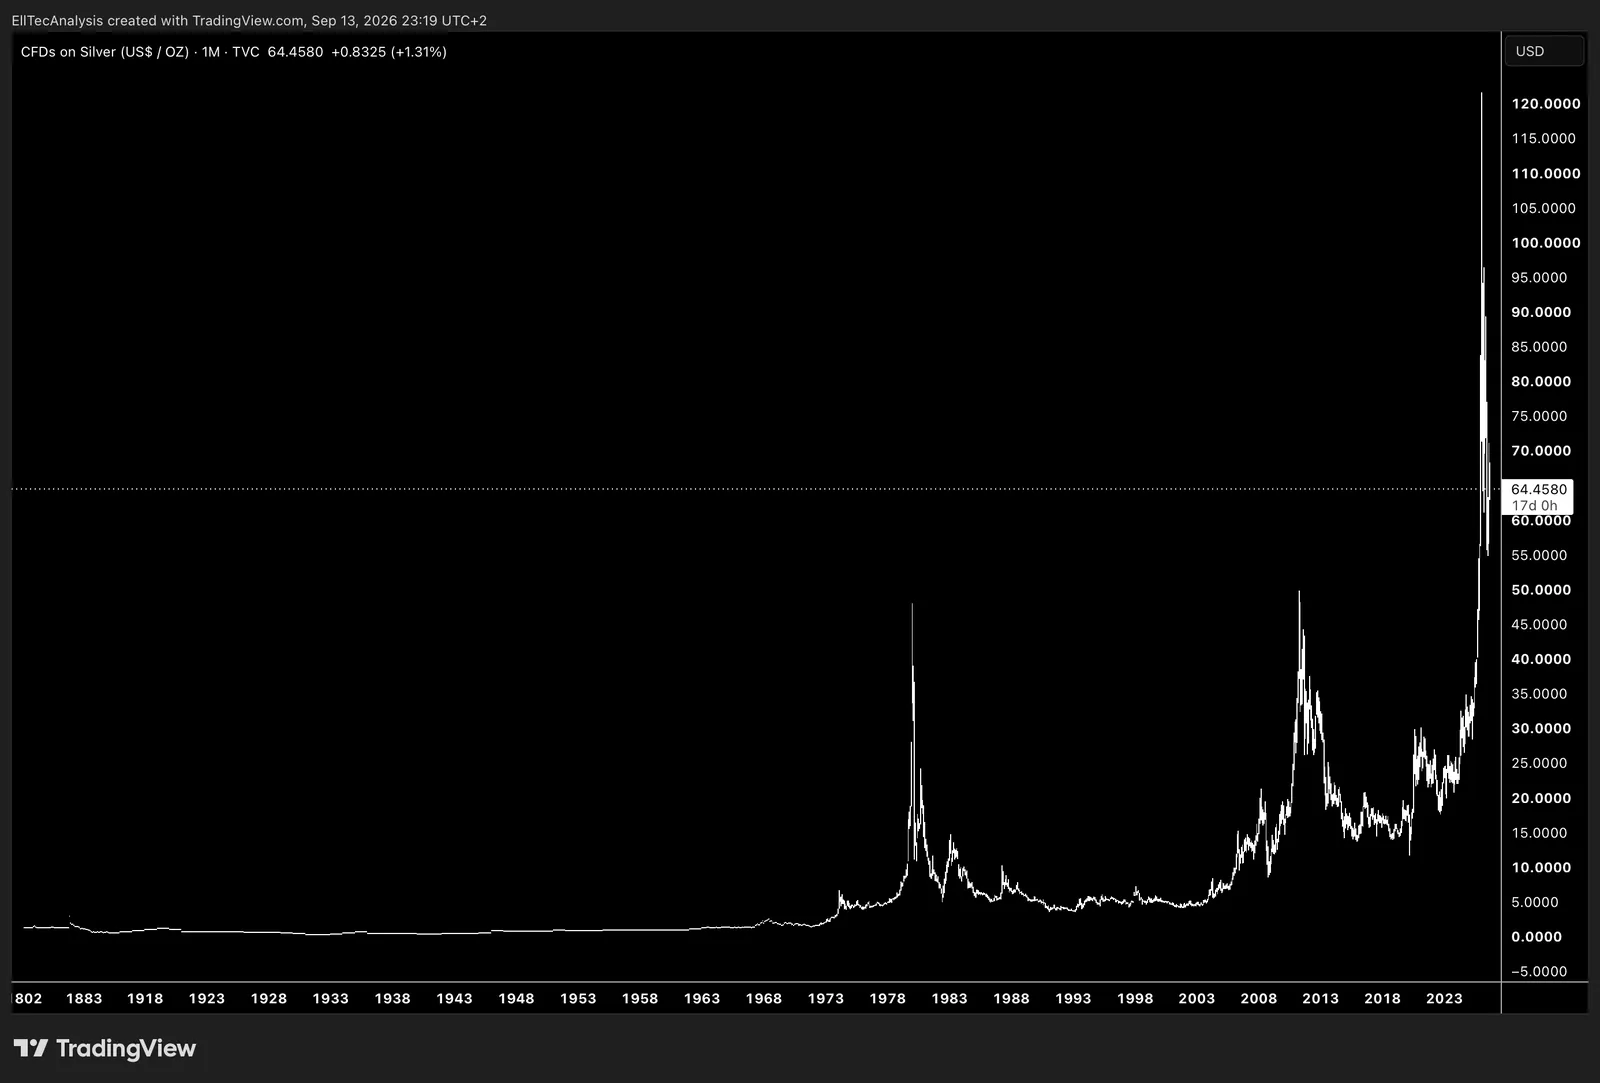
Shows how the Silver/USD price has moved over time, offering a clear view of shifts in silver’s value and how broader market or monetary conditions influence its long‑term behavior.
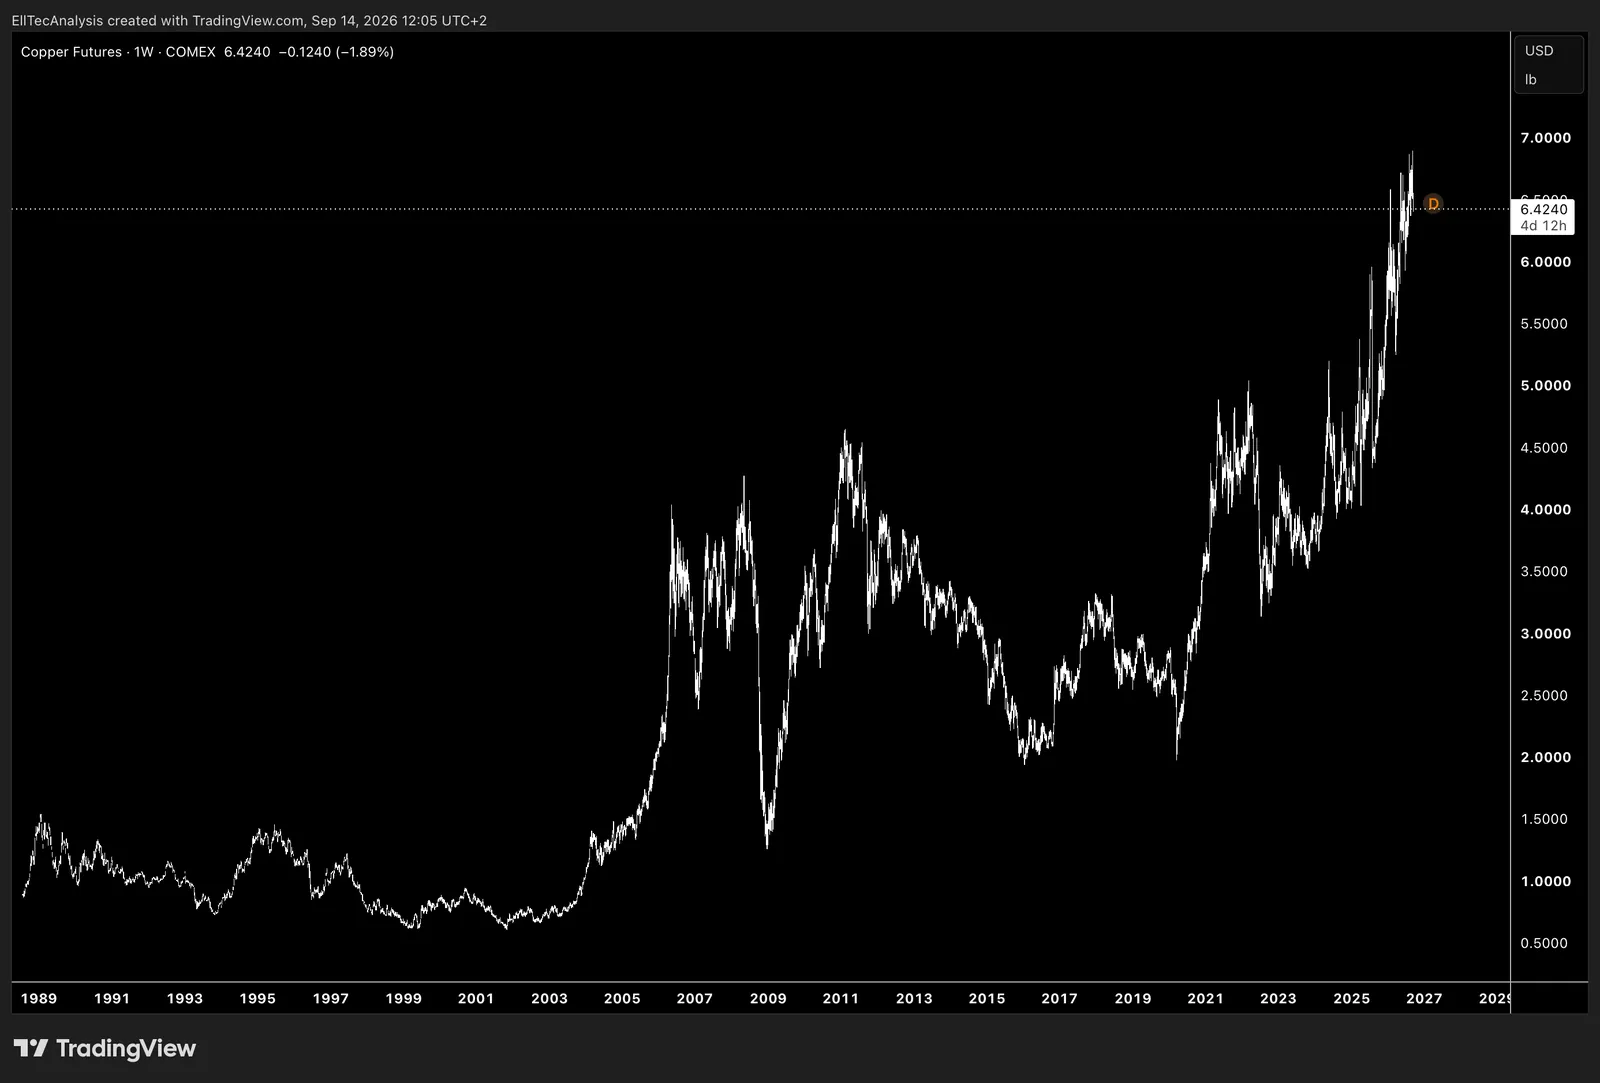
Shows how the Copper/USD price has changed over time, offering a clear view of shifts in copper’s market value and how broader industrial or monetary conditions influence its long‑term behavior.
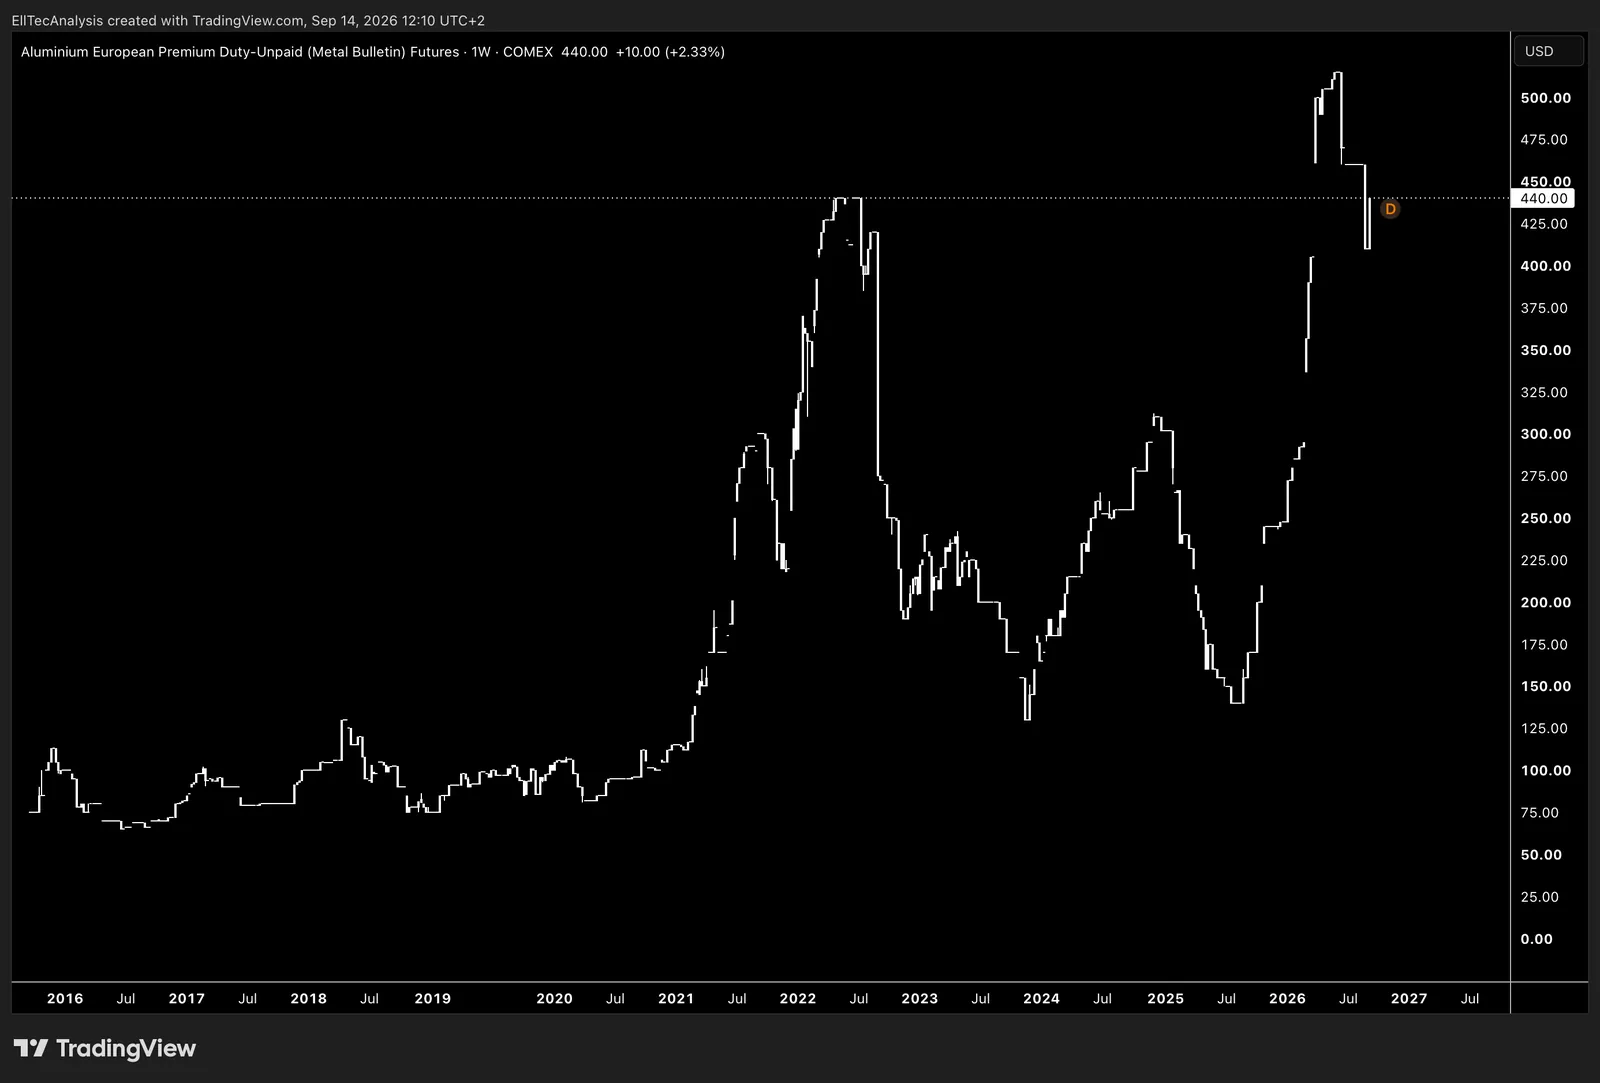
Shows how the Aluminium/USD price has changed over time, offering a clear view of shifts in aluminium’s market value and how broader industrial or monetary conditions influence its long‑term behavior.
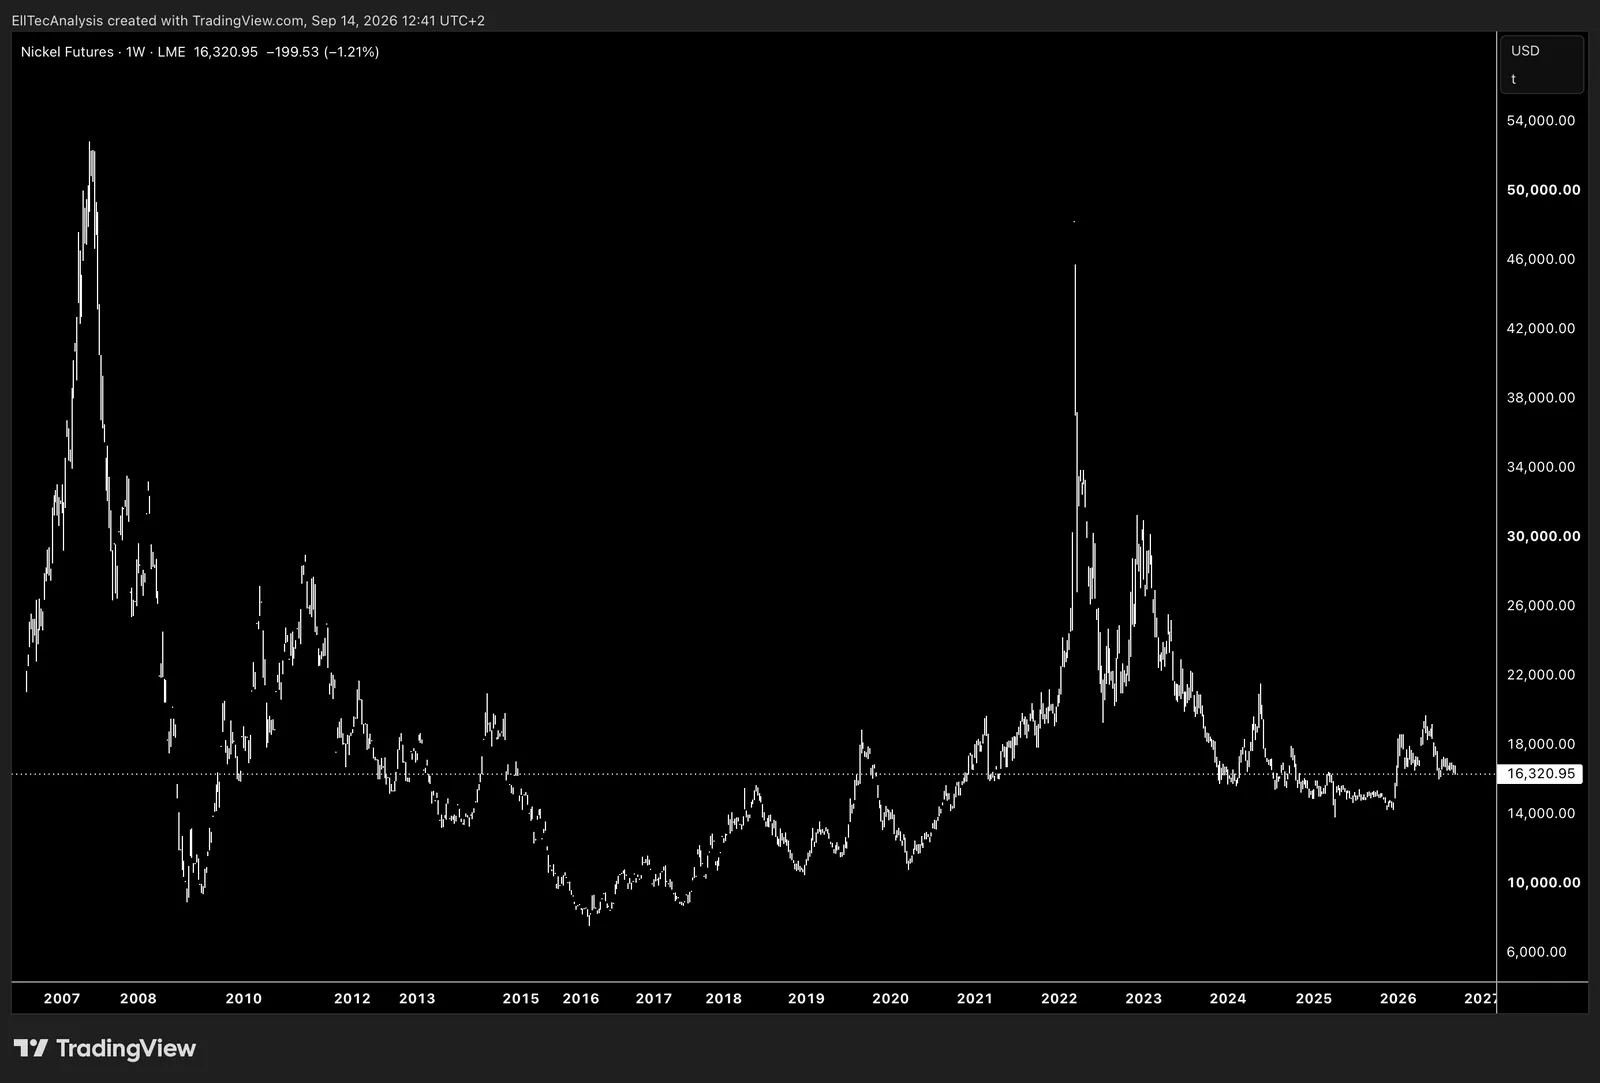
Shows how the Nickel/USD price has changed over time, offering a clear view of shifts in nickel’s market value and how broader industrial or monetary conditions influence its long‑term behavior.
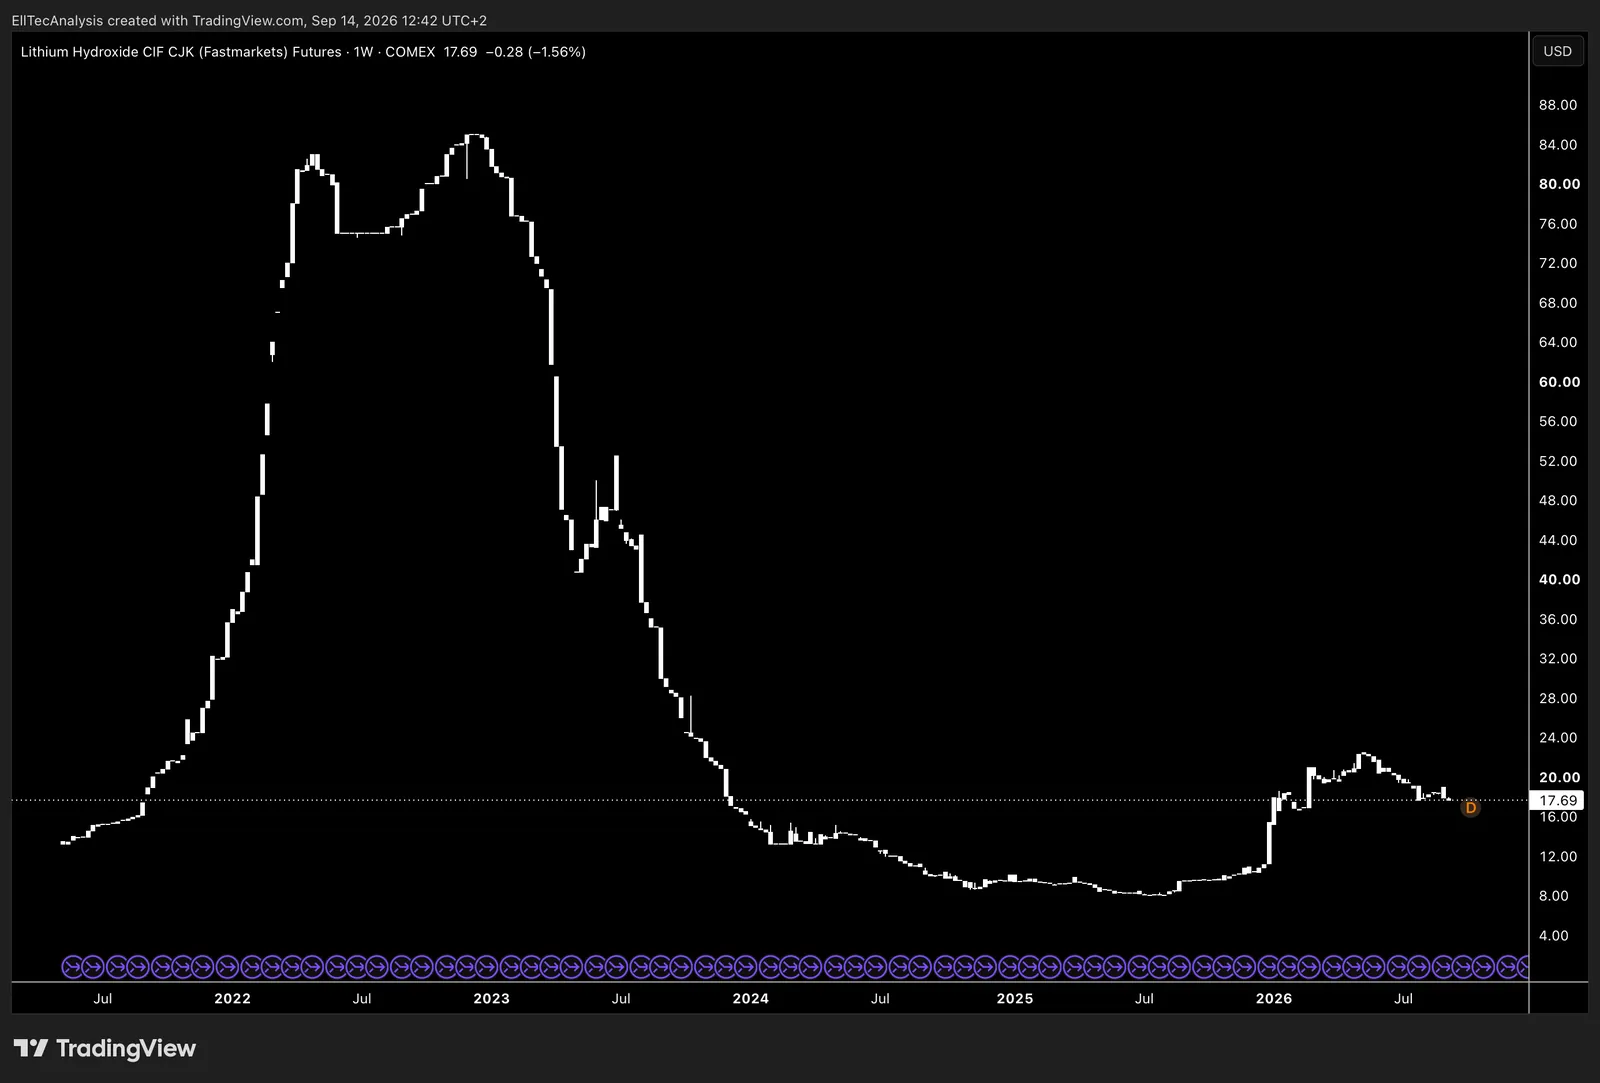
Shows how the Lithium/USD price has changed over time, offering a clear view of shifts in lithium’s market value and how broader industrial or monetary conditions influence its long‑term behavior.
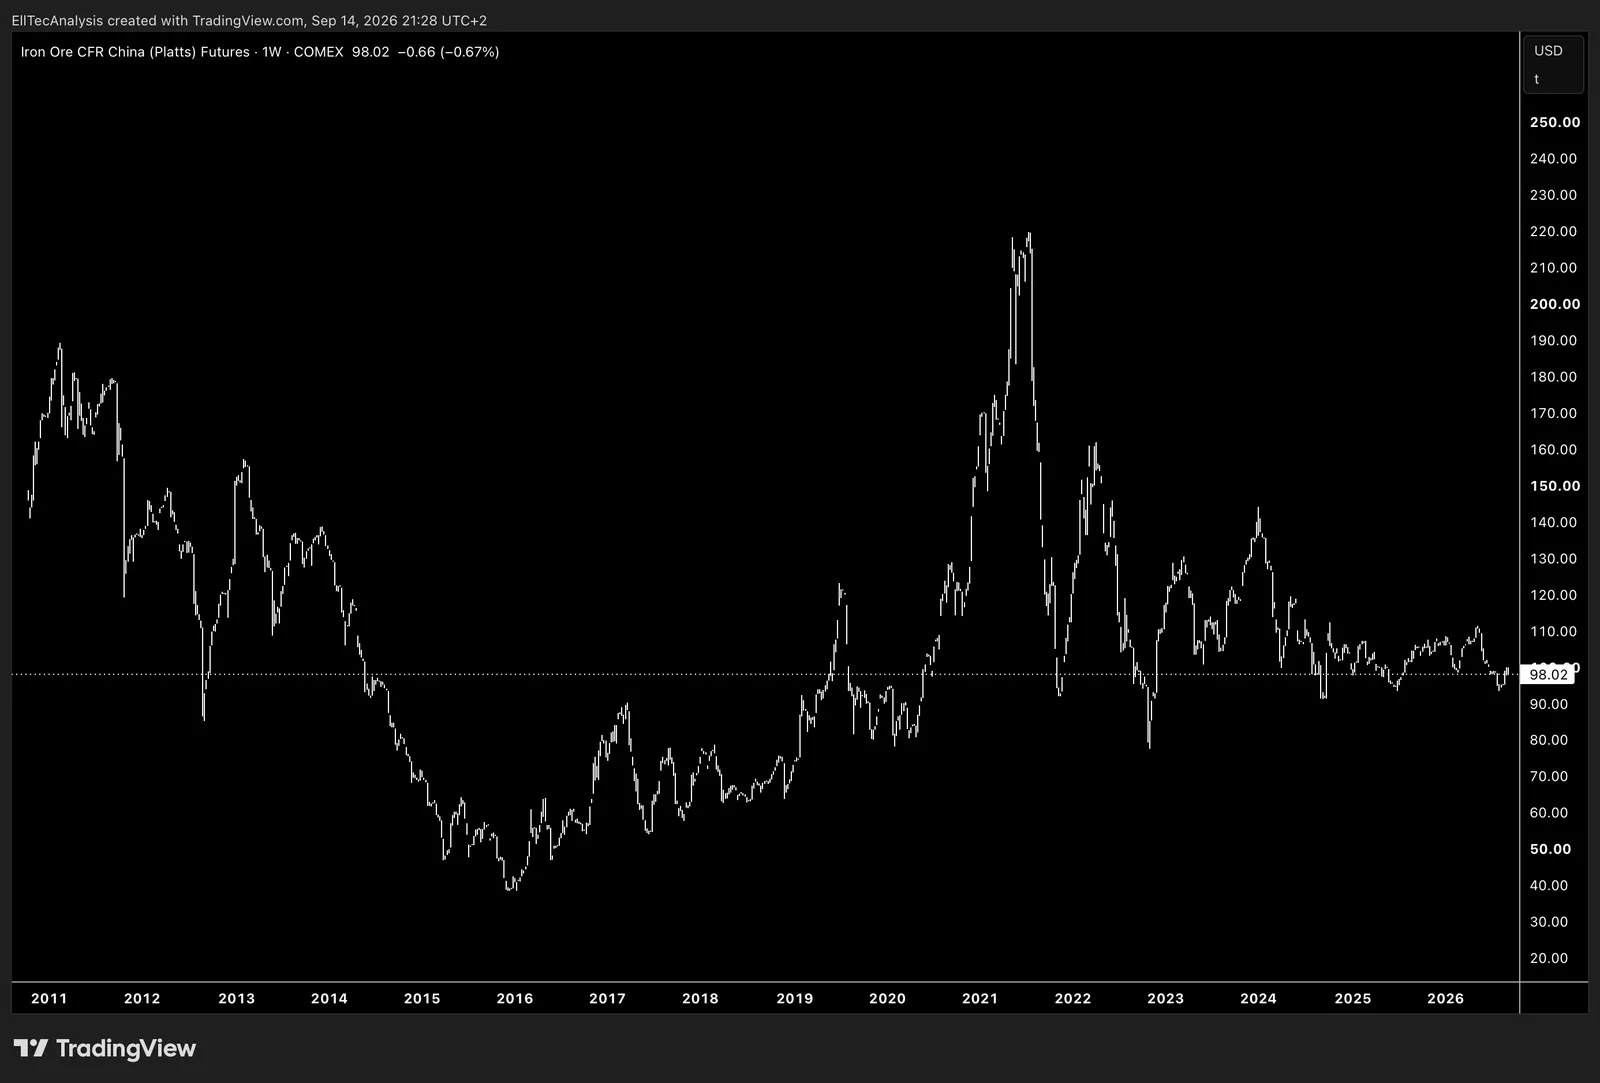
Shows how the Iron Ore/USD price has changed over time, offering a clear view of shifts in iron ore’s market value and how broader industrial or monetary conditions influence its long‑term behavior.
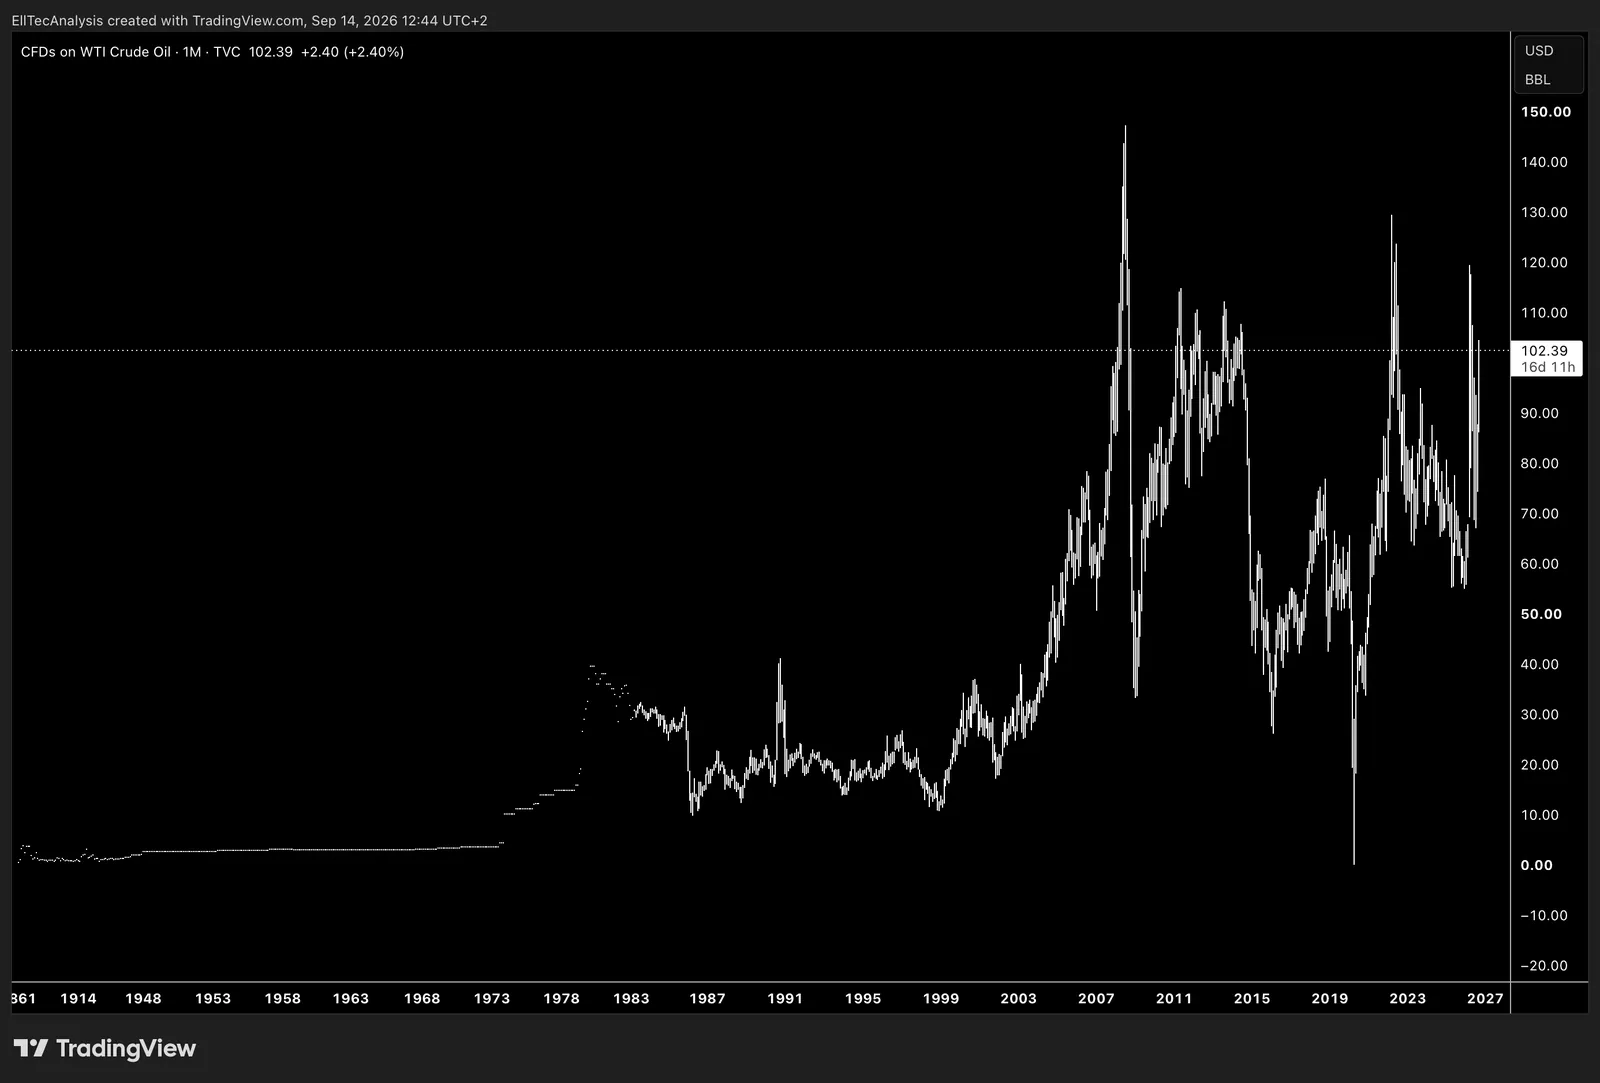
Shows how the WTI Crude Oil/USD price has moved over time, offering a clear view of shifts in crude oil’s market value and how broader energy, economic, or monetary conditions influence its long‑term behavior.
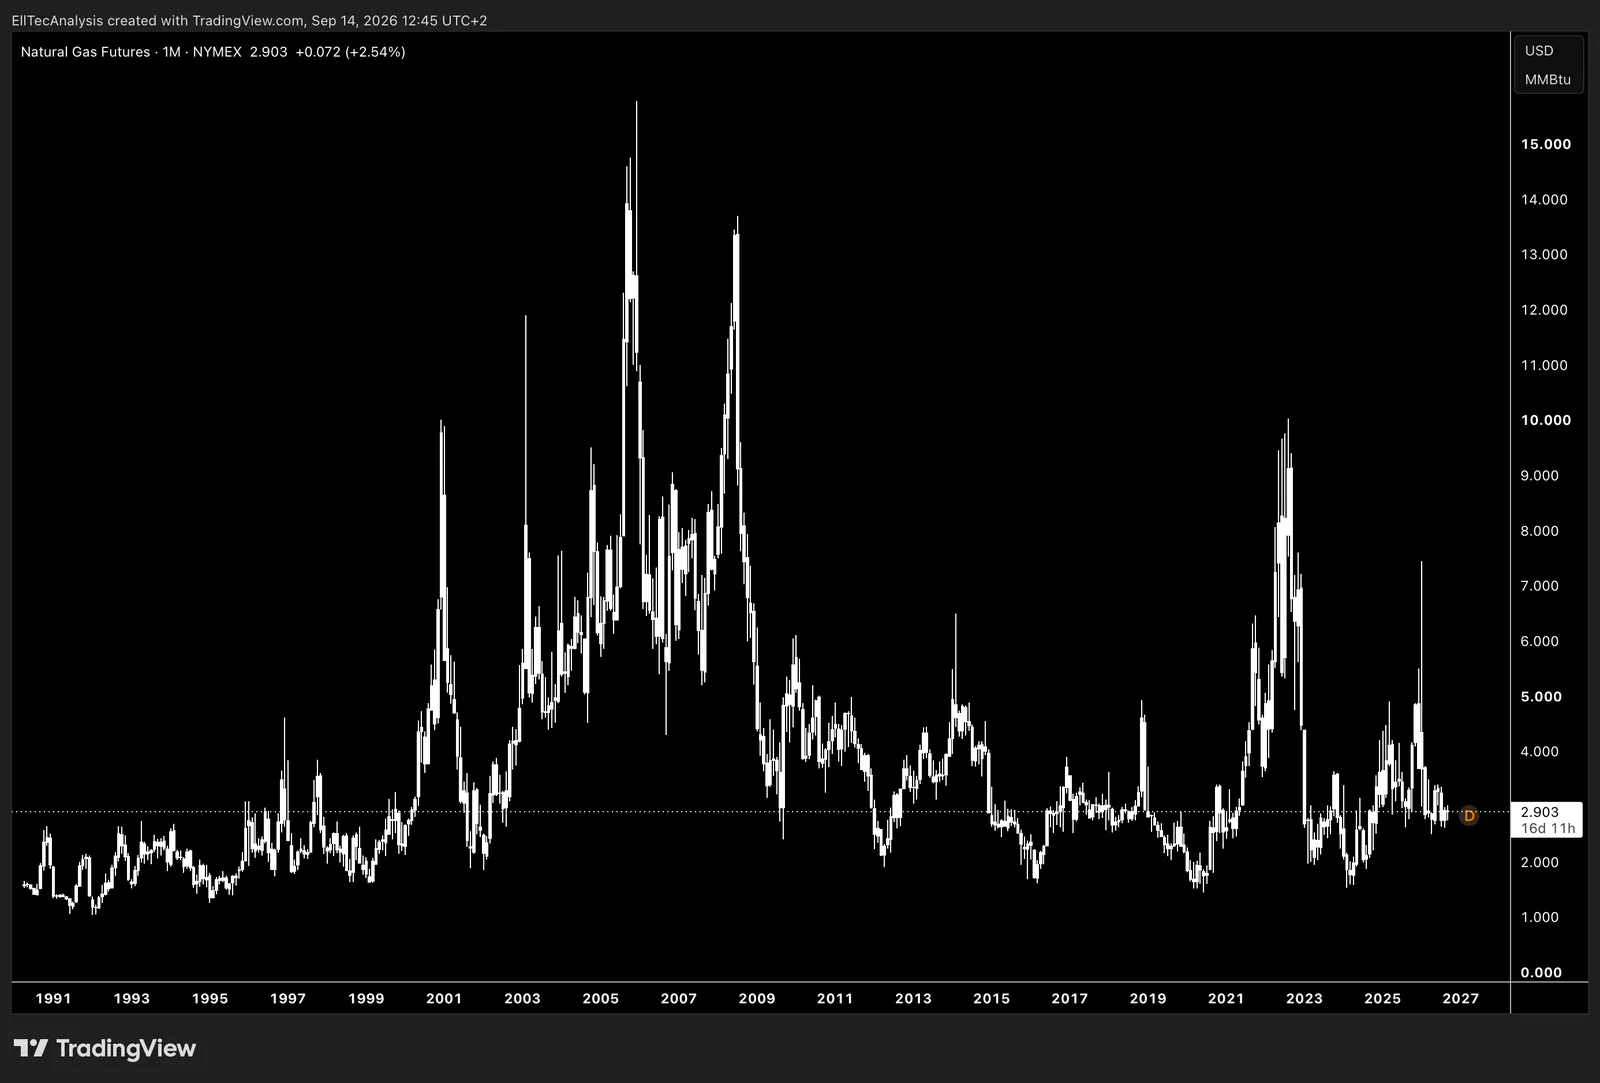
Shows how the Natural Gas/USD price has moved over time, offering a clear view of shifts in natural gas’s market value and how broader energy, industrial, or monetary conditions influence its long‑term behavior.
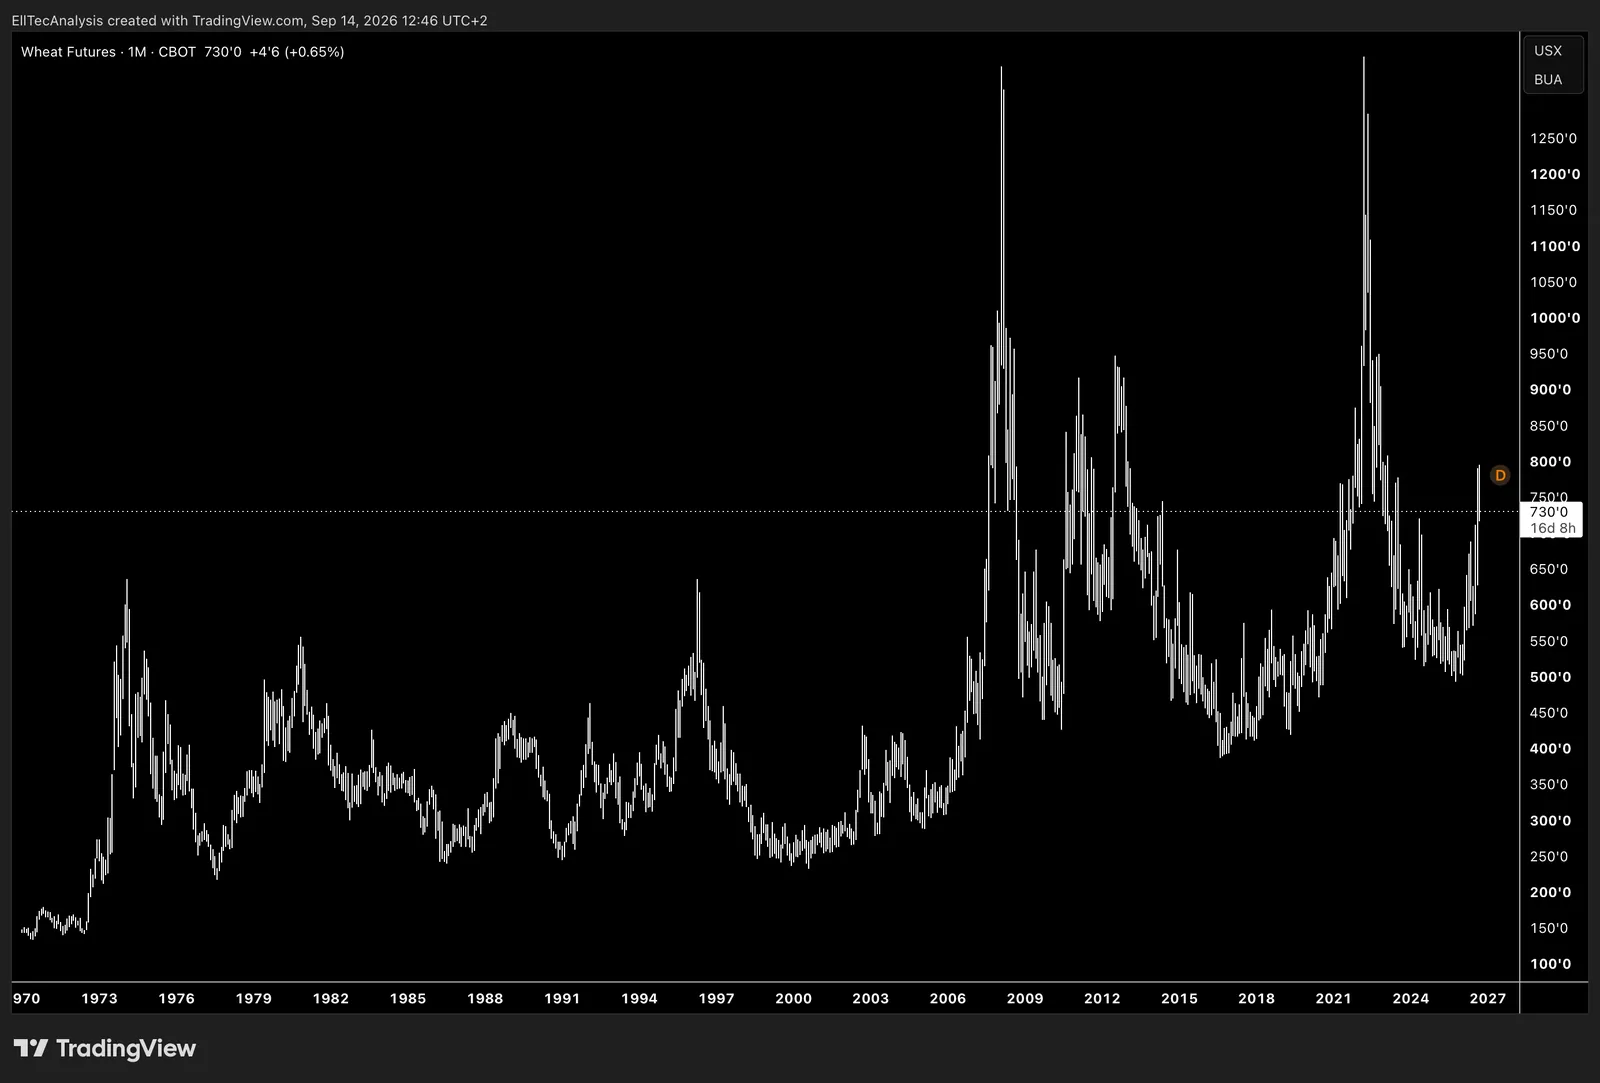
Shows how the Wheat/USD price has moved over time, offering a clear view of shifts in global wheat markets and how broader agricultural, economic, or monetary conditions influence its long‑term behavior.
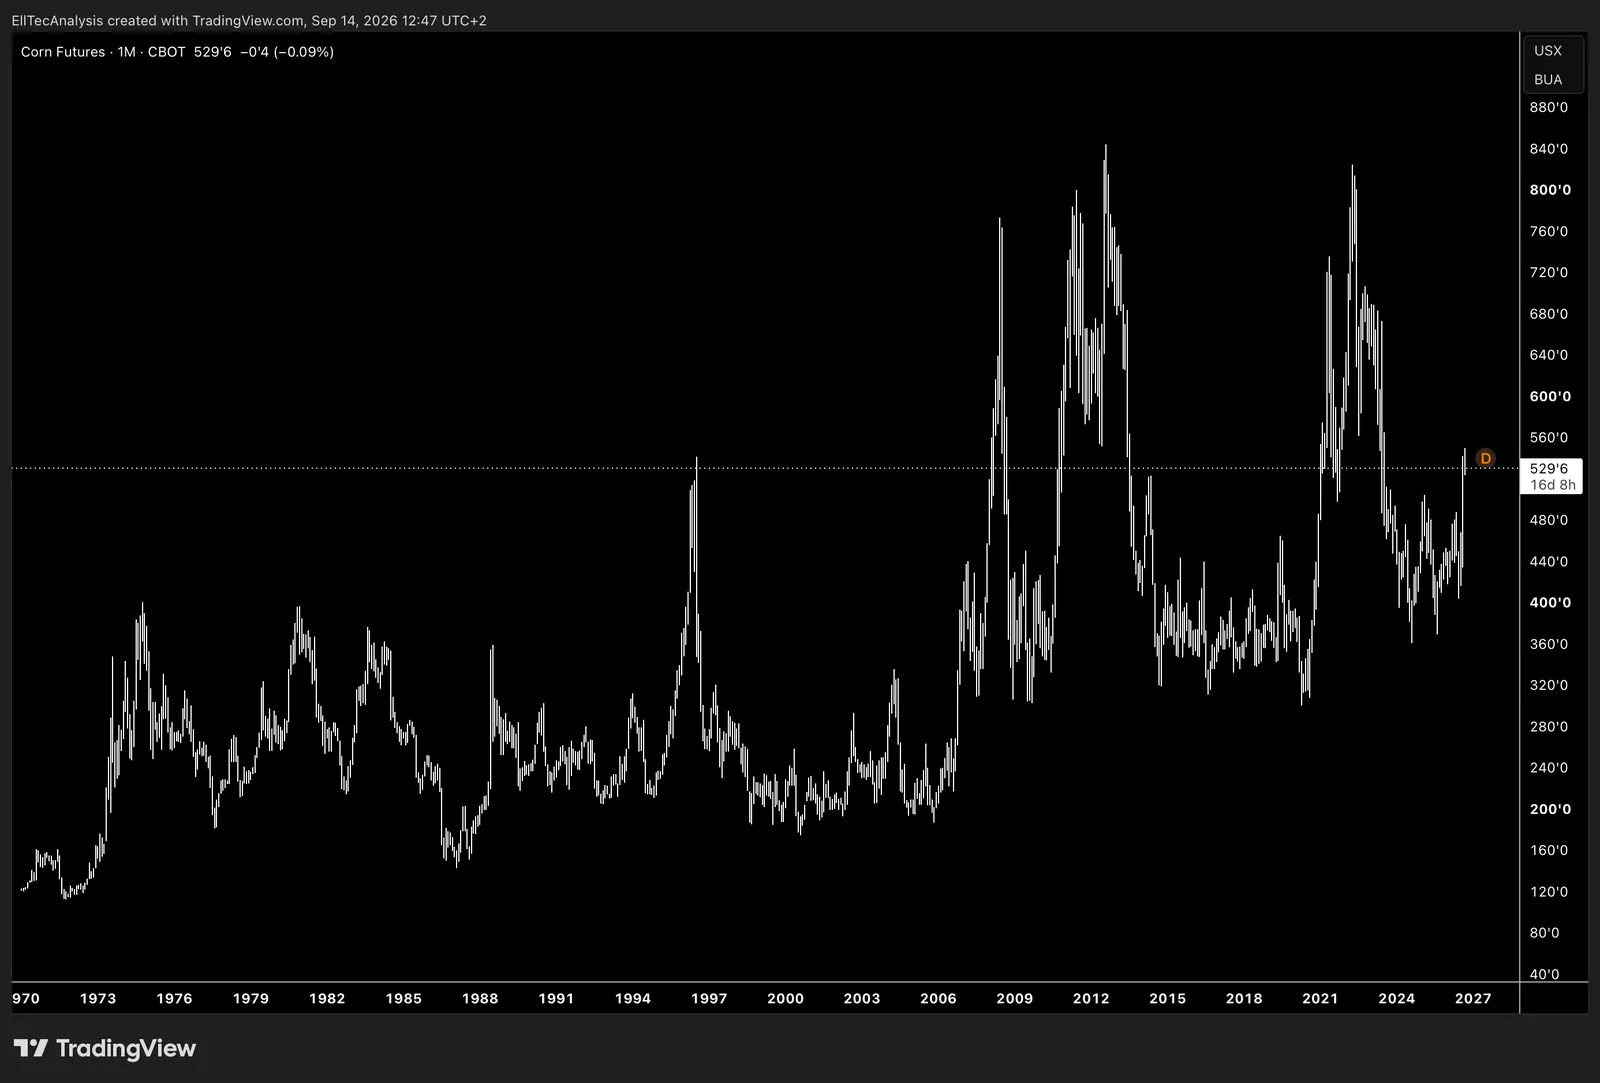
Shows how the Corn/USD price has moved over time, offering a clear view of shifts in global corn markets and how broader agricultural, economic, or monetary conditions influence its long‑term behavior.
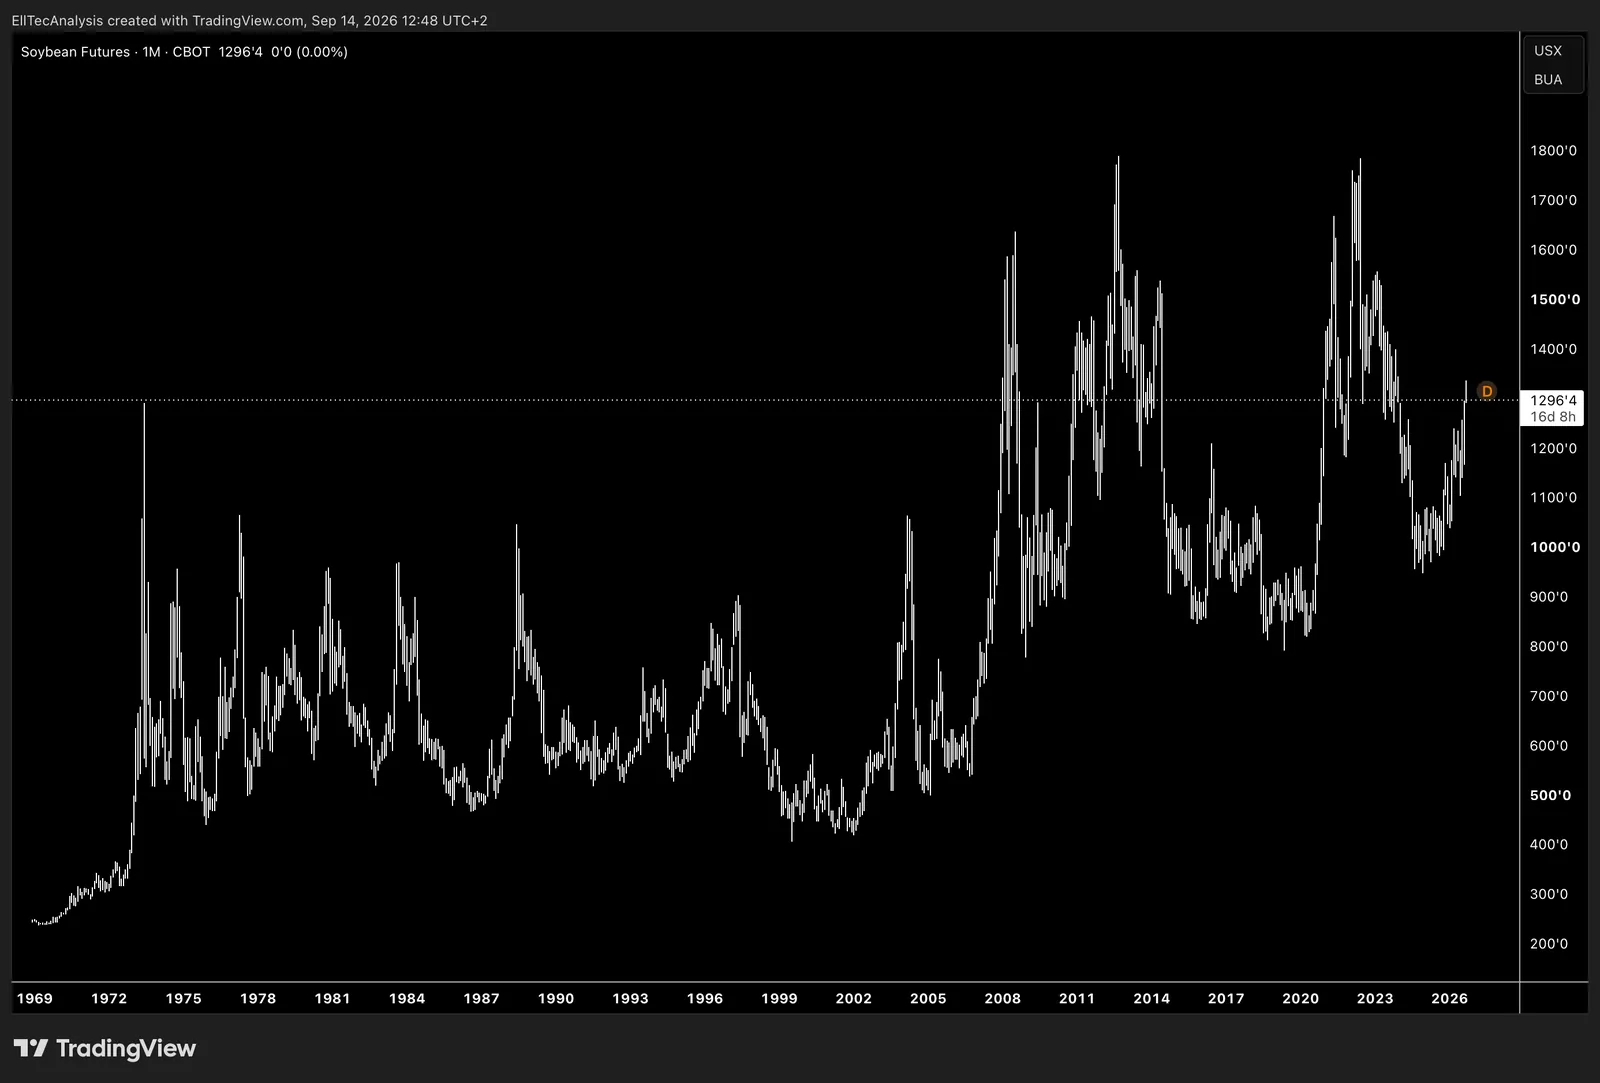
Shows how the Soybean/USD price has moved over time, offering a clear view of shifts in global soybean markets and how broader agricultural, economic, or monetary conditions influence its long‑term behavior.
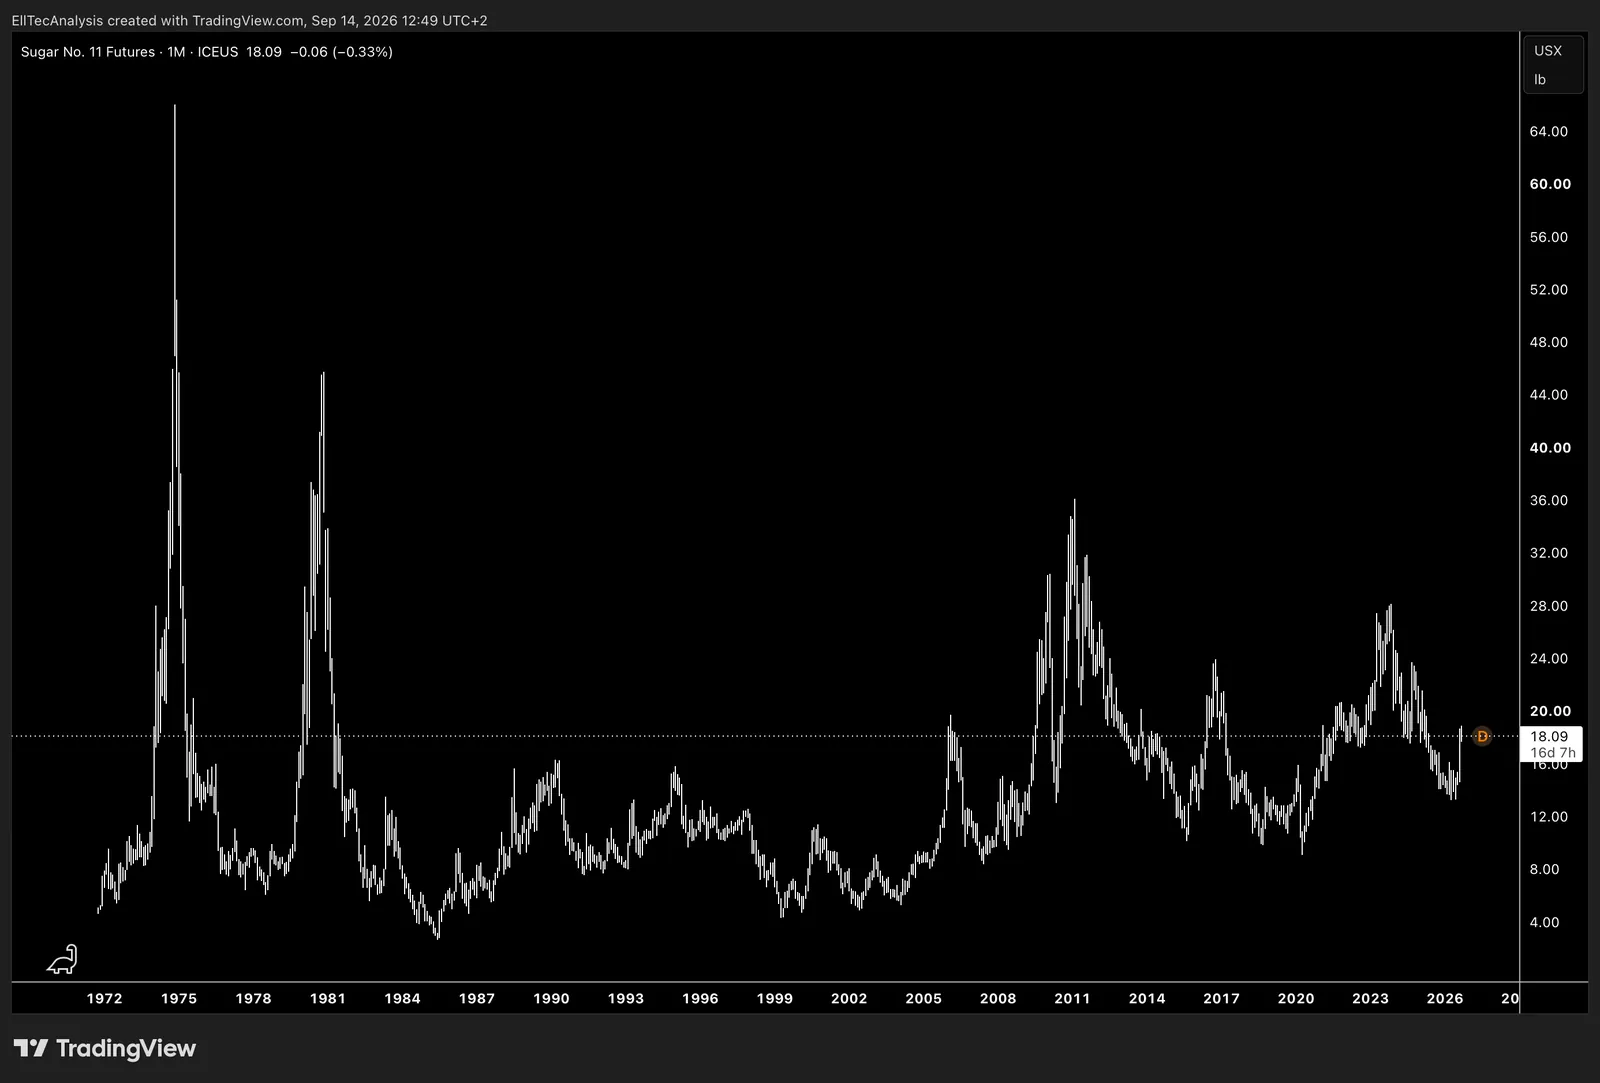
Shows how the Sugar/USD price has moved over time, offering a clear view of shifts in global sugar markets and how broader agricultural, economic, or monetary conditions influence its long‑term behavior.
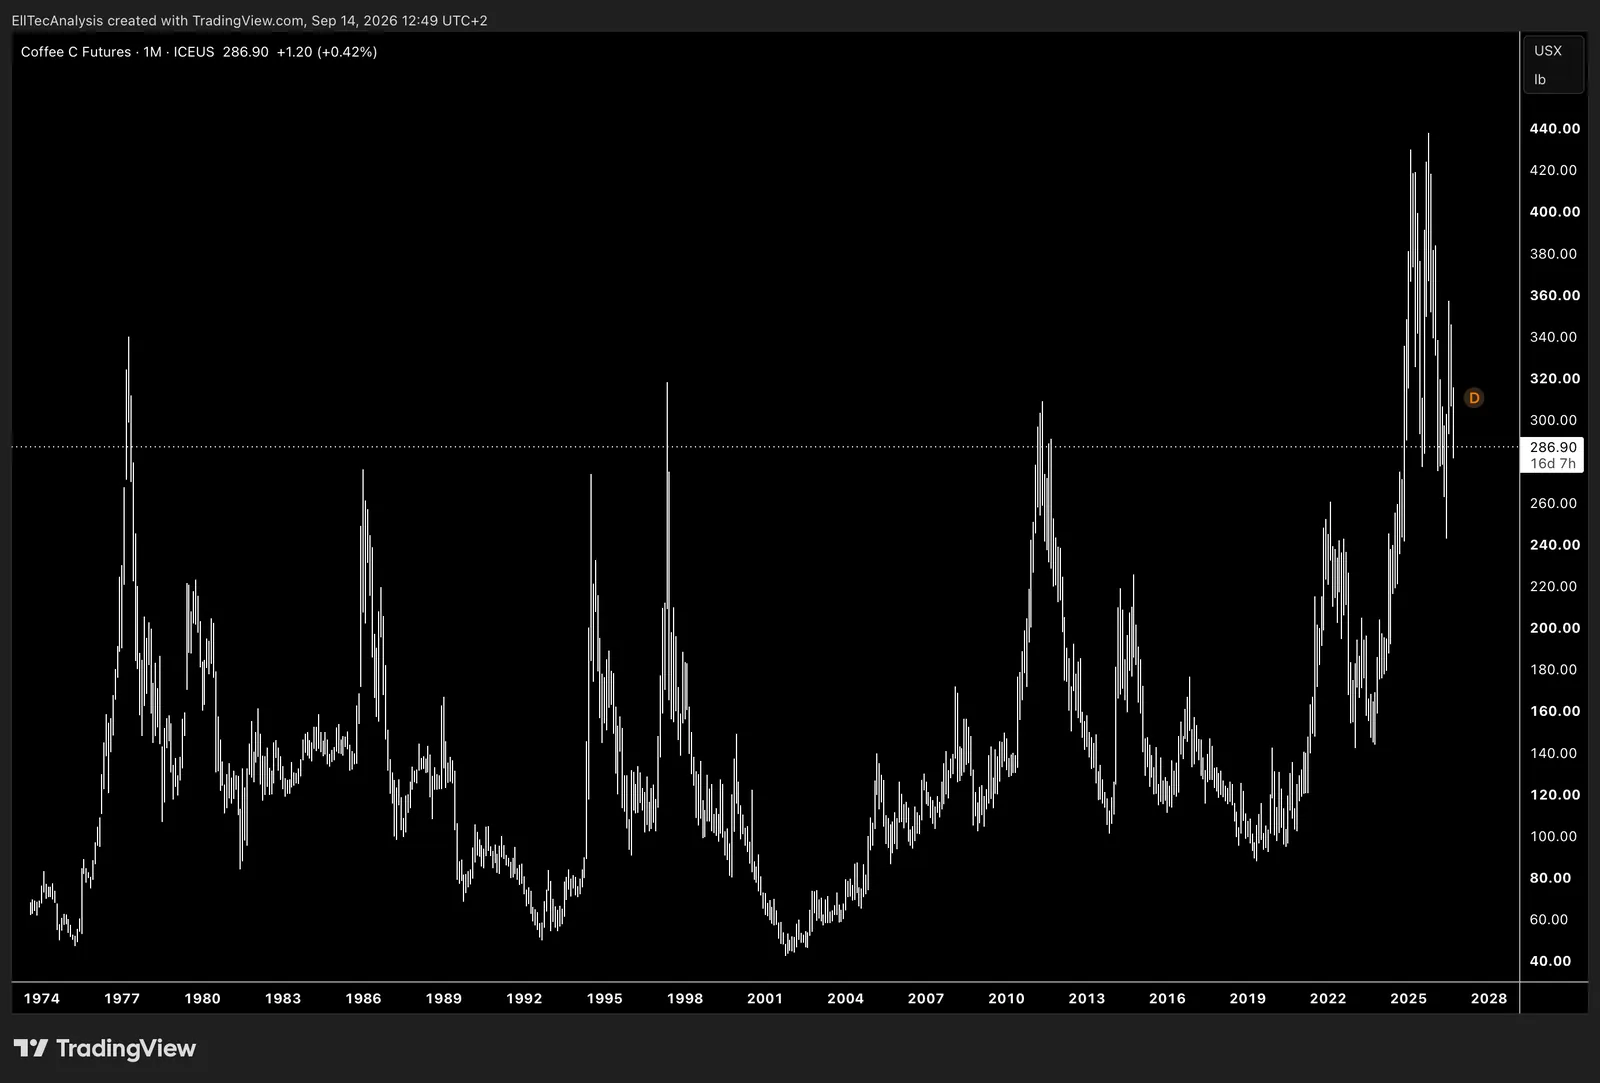
Shows how the Coffee/USD price has moved over time, offering a clear view of shifts in global coffee markets and how broader agricultural, economic, or monetary conditions influence its long‑term behavior.
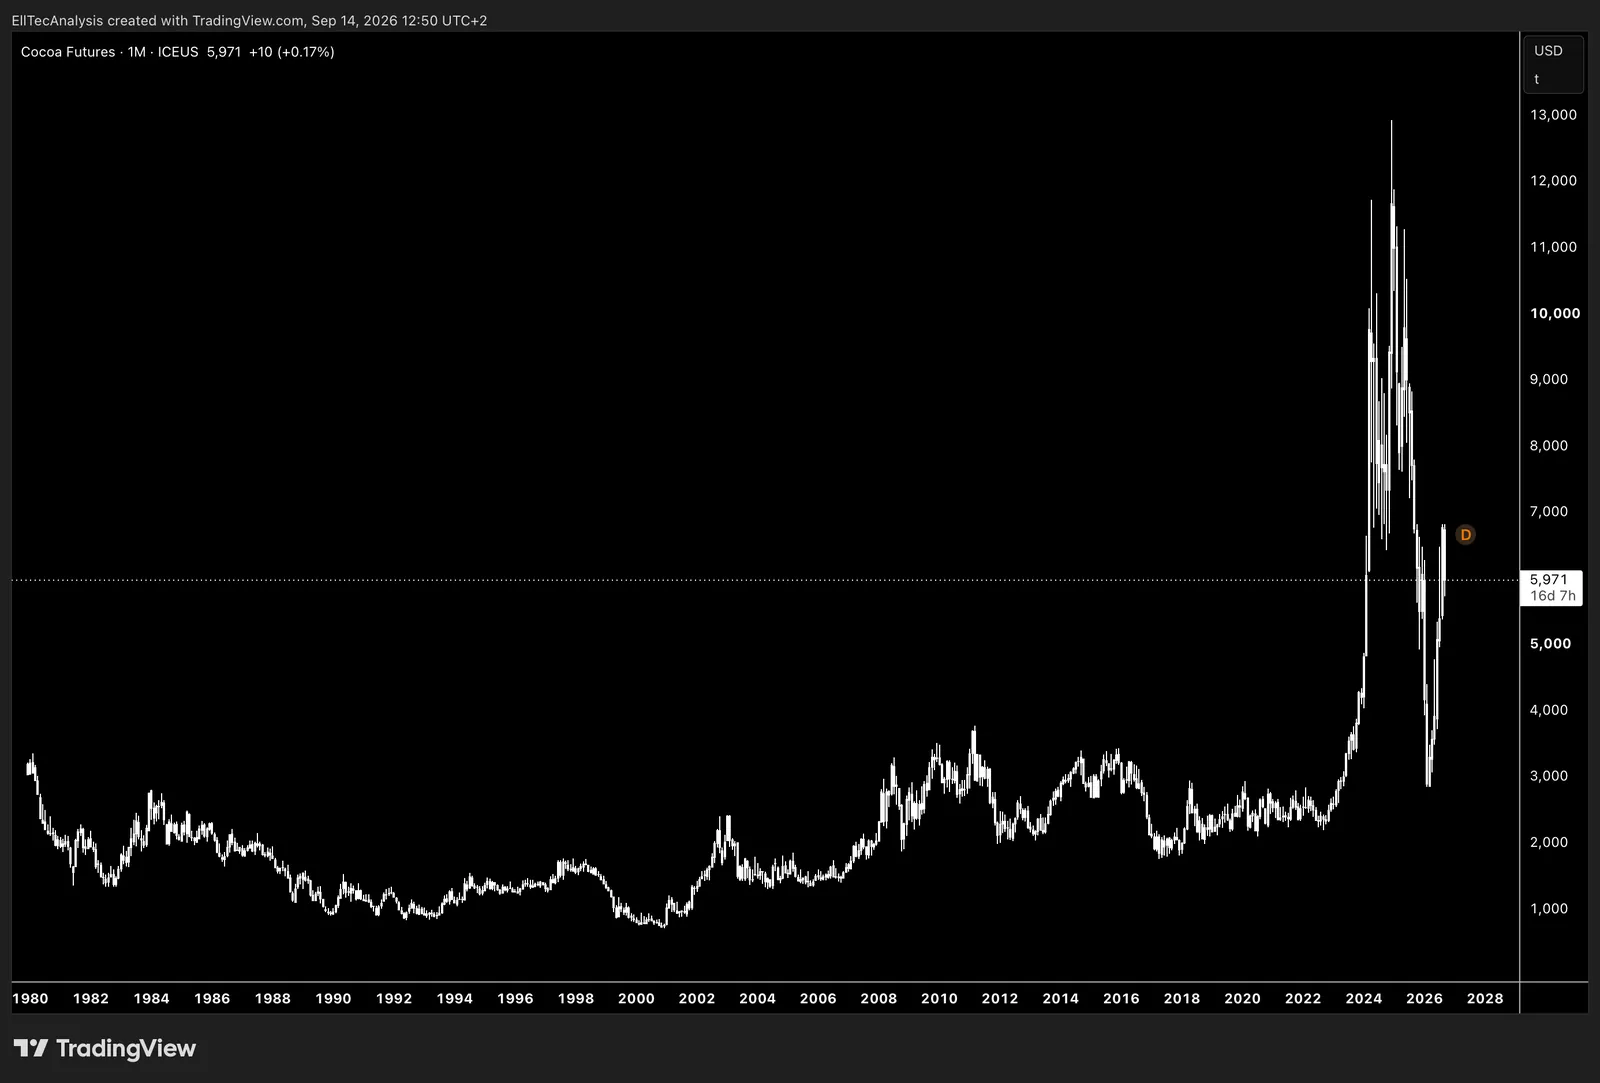
Shows how the Cocoa/USD price has moved over time, offering a clear view of shifts in global cocoa markets and how broader agricultural, economic, or monetary conditions influence its long‑term behavior.
Crypto
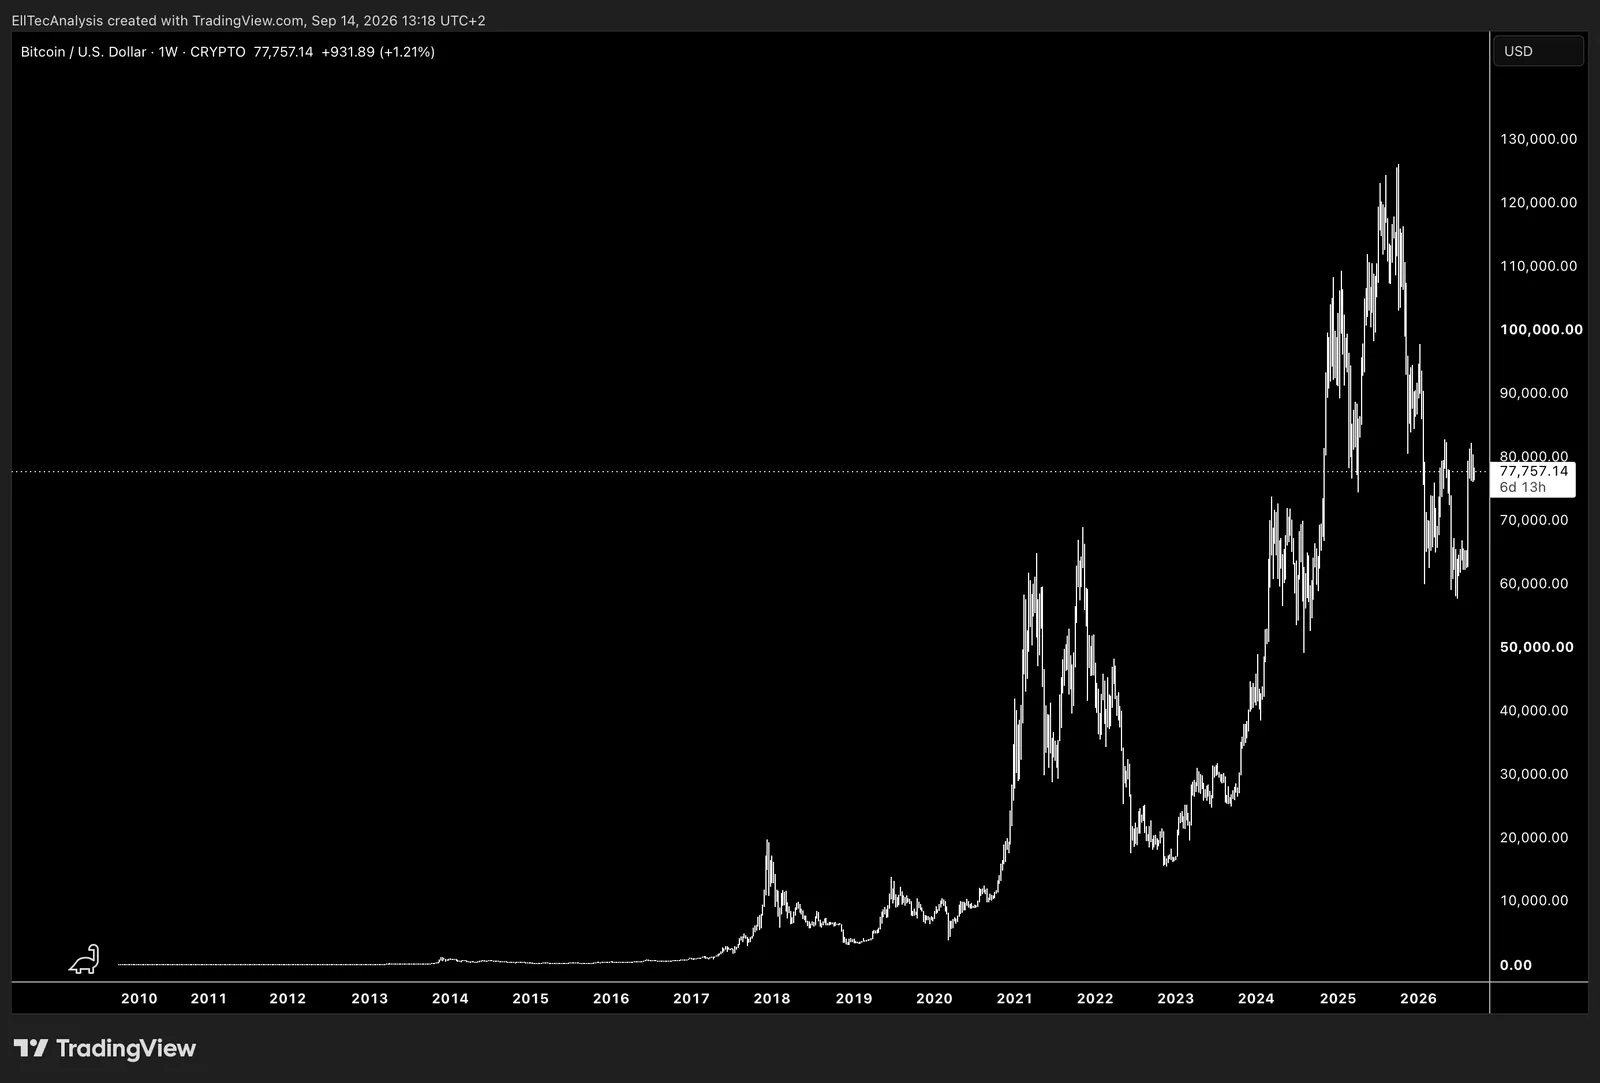
Shows how the Bitcoin/USD price has moved over time, offering a clear view of shifts in Bitcoin’s market value and how broader macro, liquidity, or monetary conditions influence its long‑term behavior.
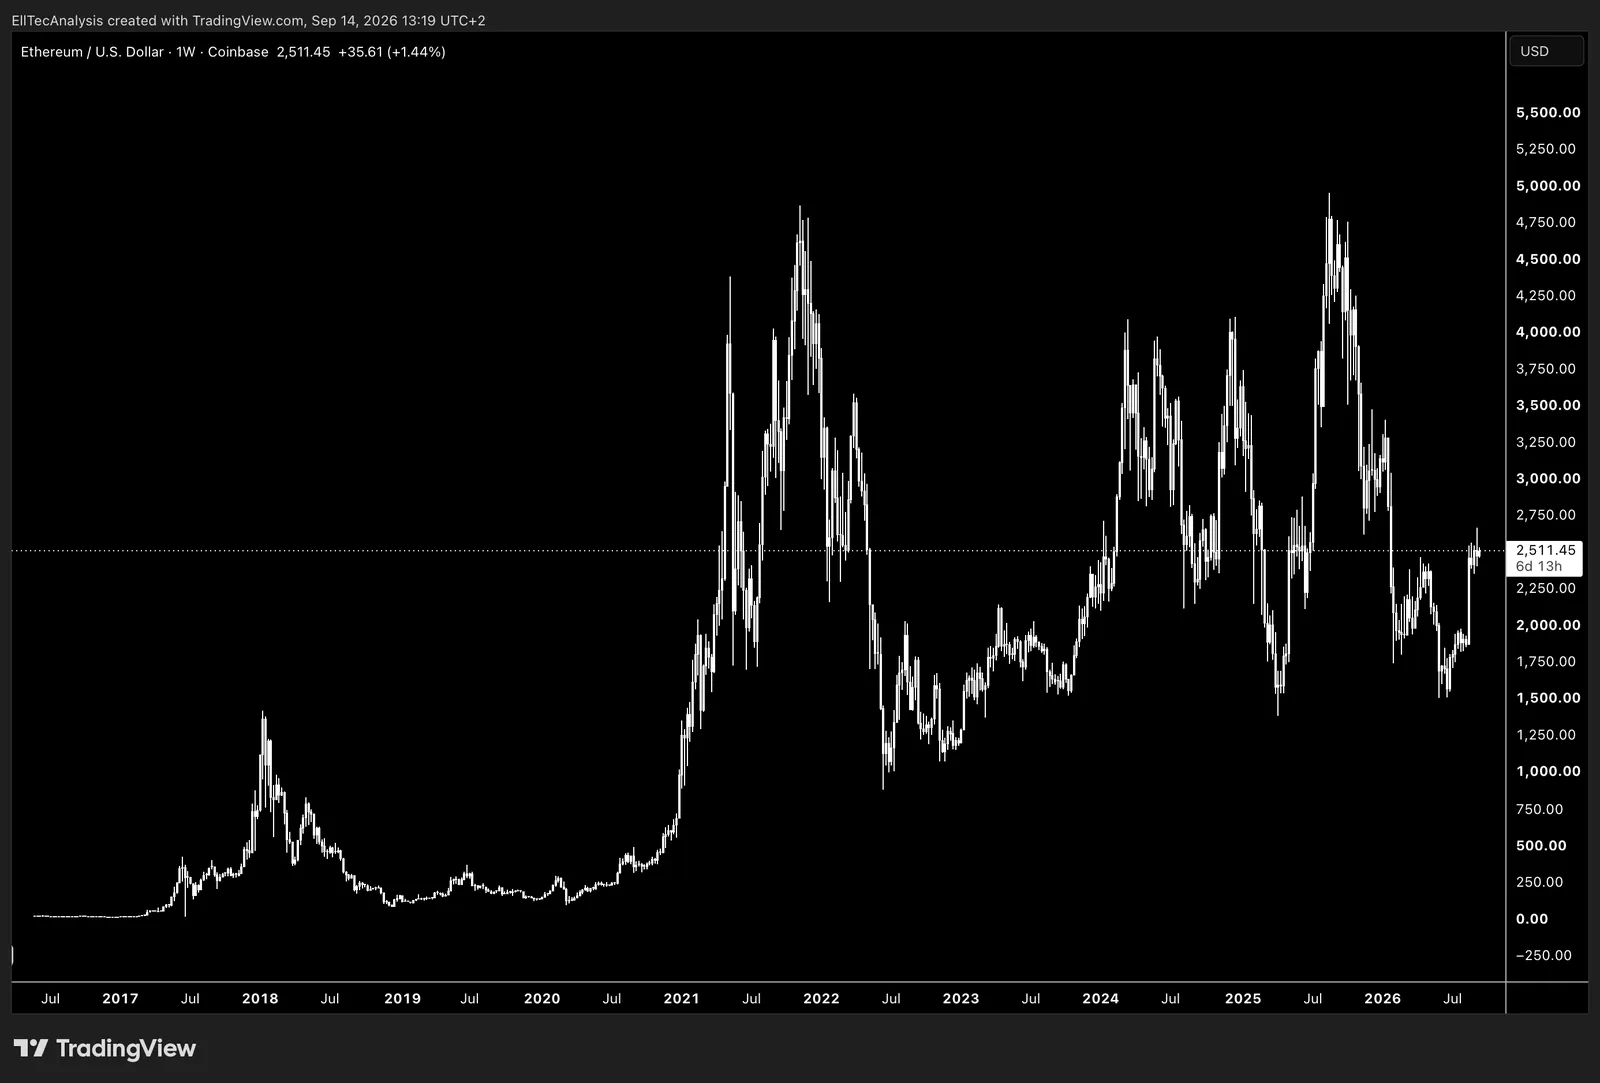
Shows how the Ethereum/USD price has moved over time, offering a clear view of shifts in Ethereum’s market value and how broader macro, liquidity, or monetary conditions influence its long‑term behavior.
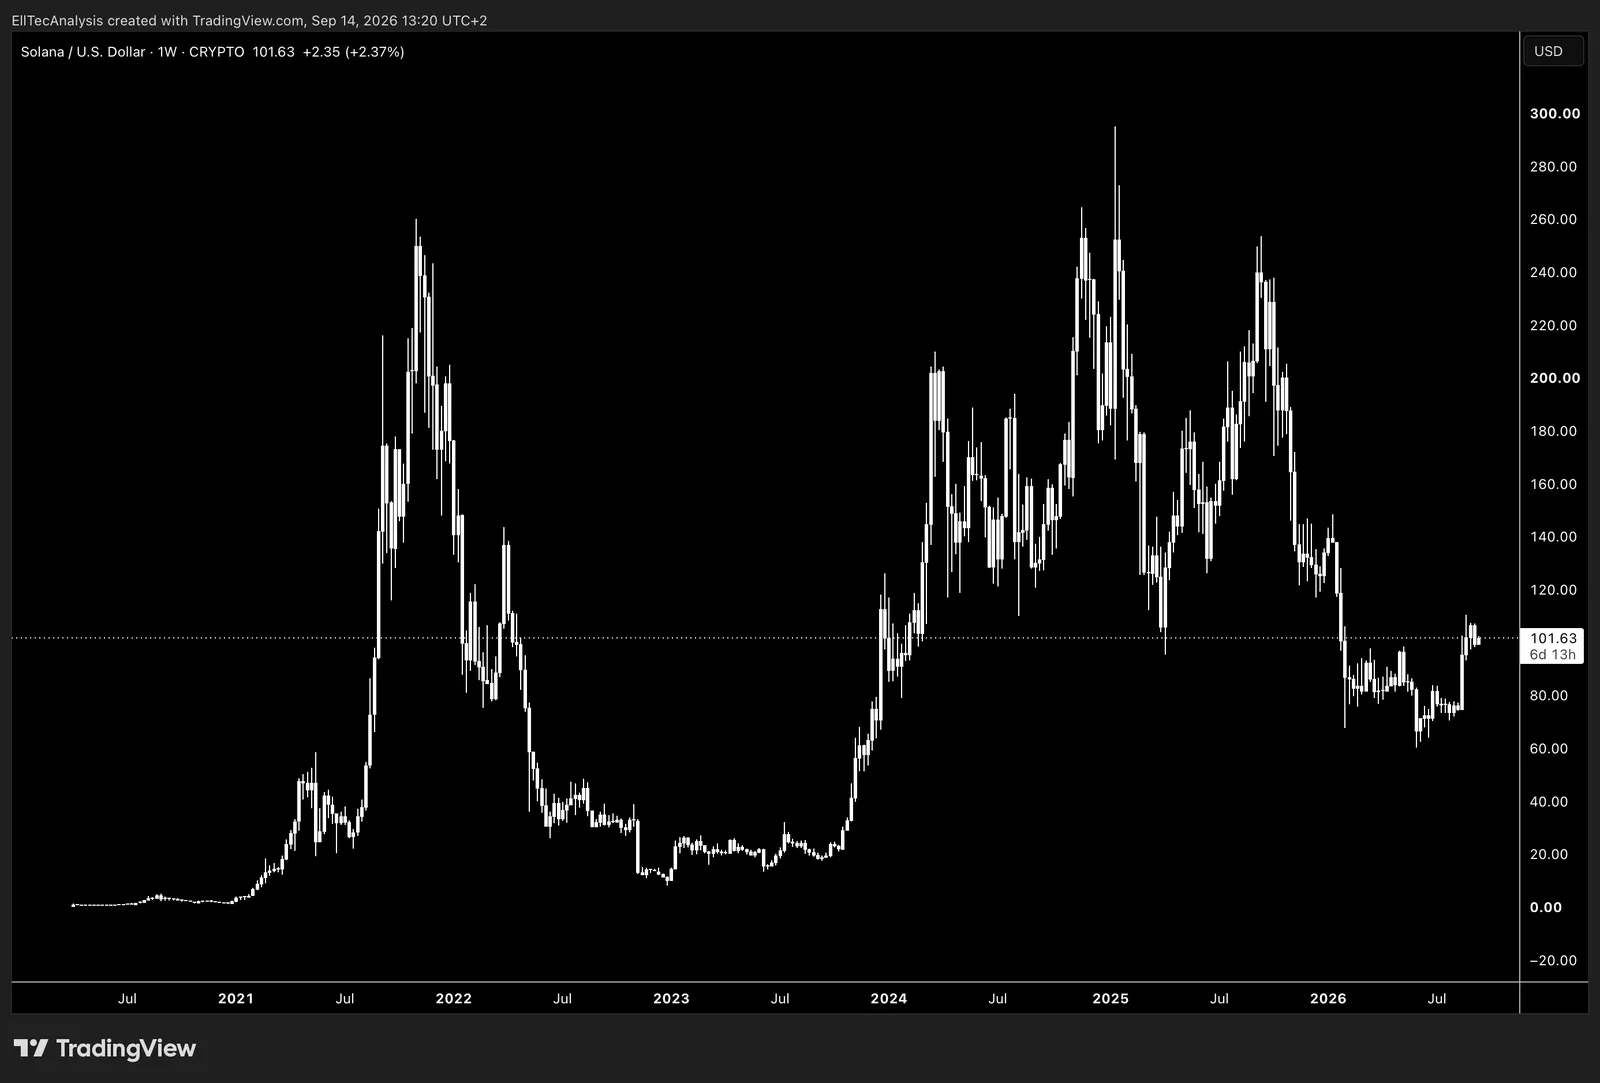
Shows how the Solana/USD price has moved over time, offering a clear view of shifts in Solana’s market value and how broader macro, liquidity, or monetary conditions influence its long‑term behavior.
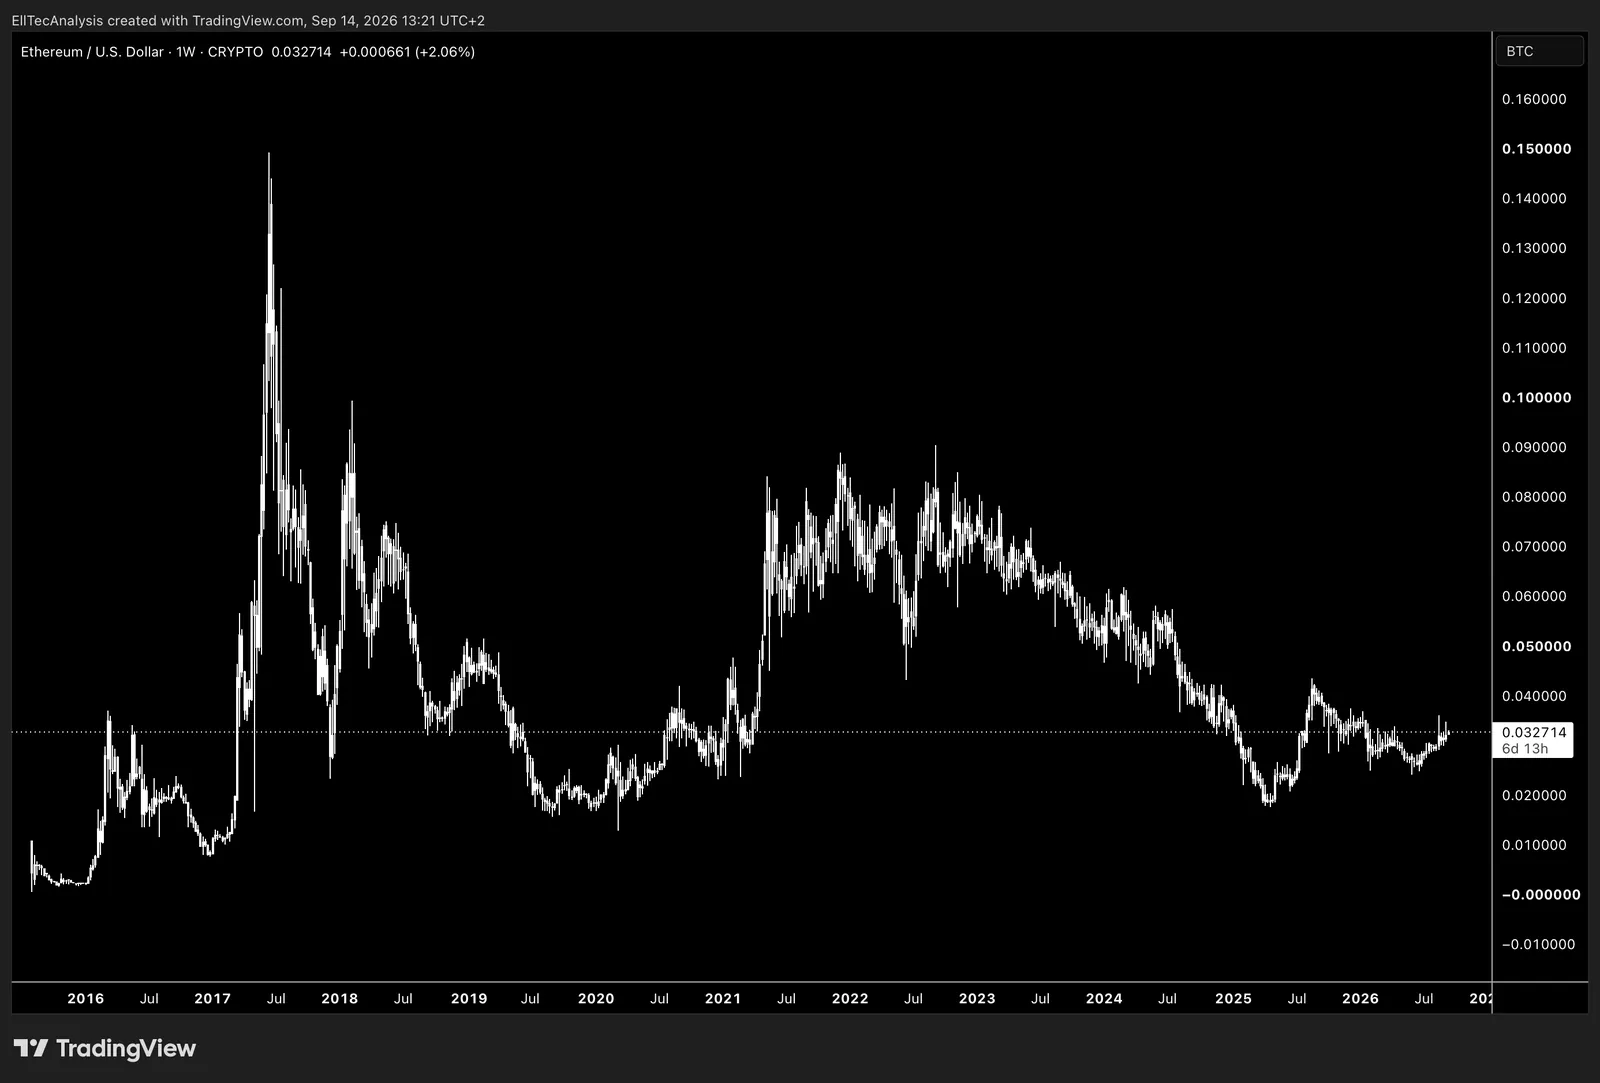
Shows how the Ethereum/Bitcoin price has moved over time, offering a clear view of shifts in Ethereum’s relative strength versus Bitcoin and how broader macro, liquidity, or monetary conditions influence its long‑term behavior.
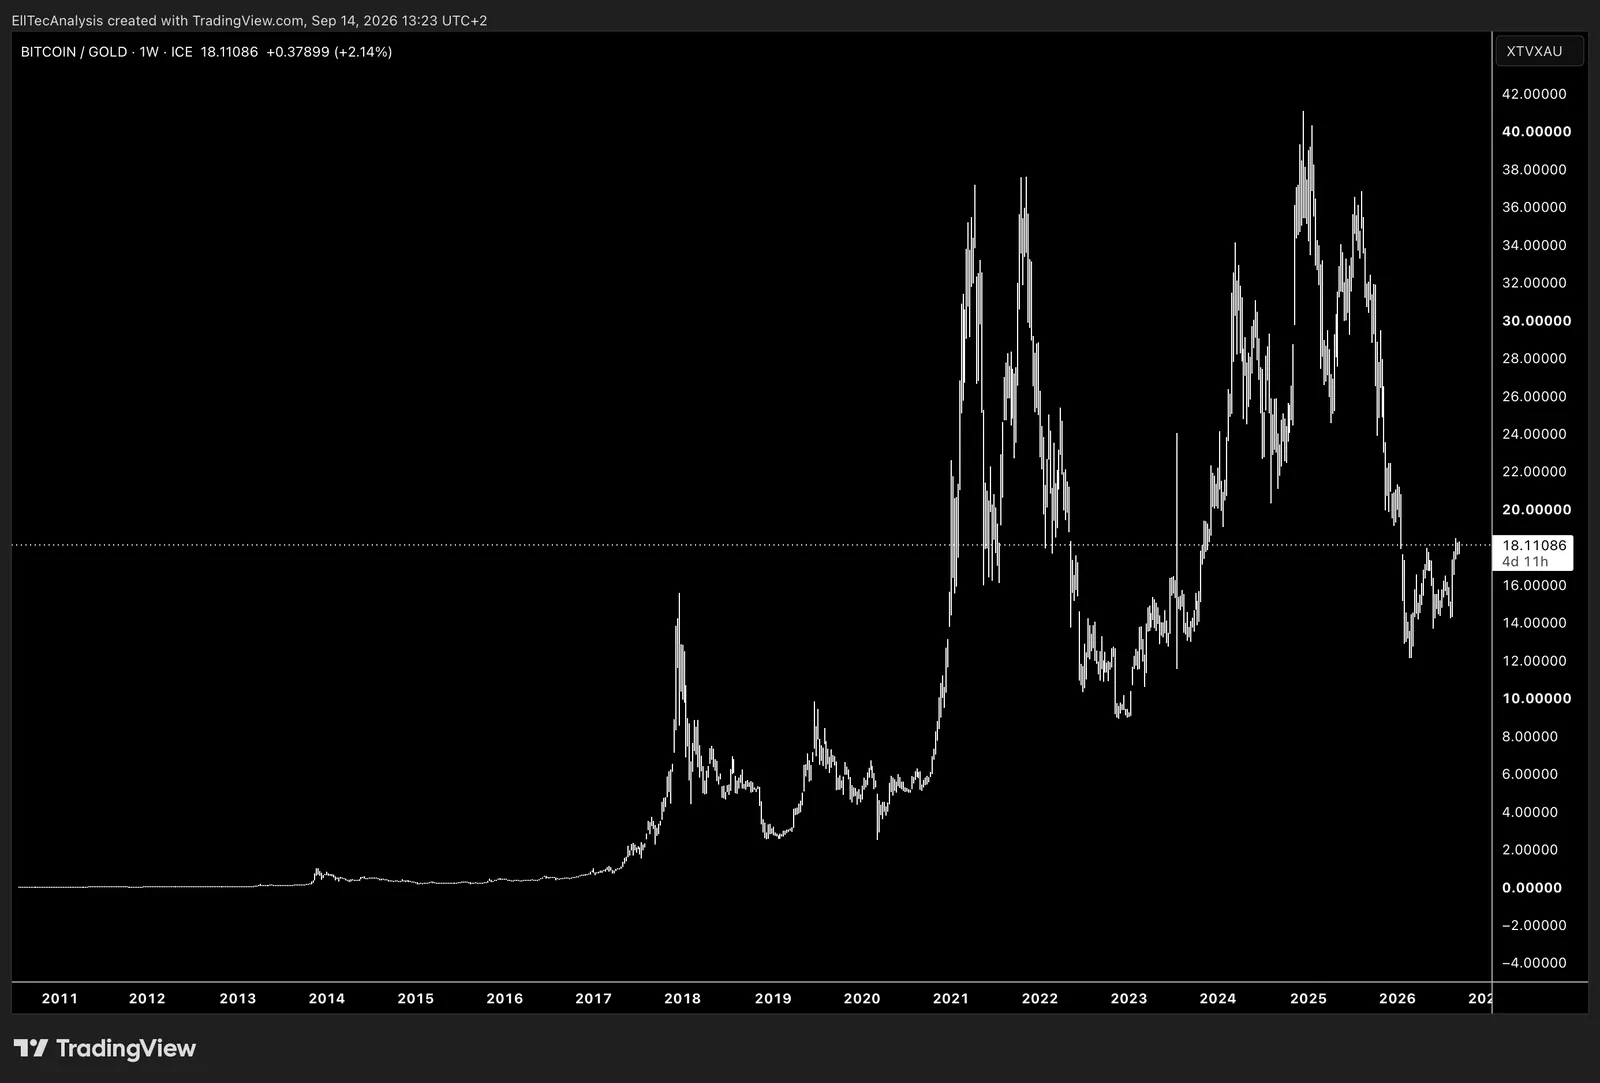
Shows how the Bitcoin/Gold price has moved over time, offering a clear view of Bitcoin’s relative strength versus Gold and how broader macro, liquidity, or monetary conditions influence its long‑term behavior.
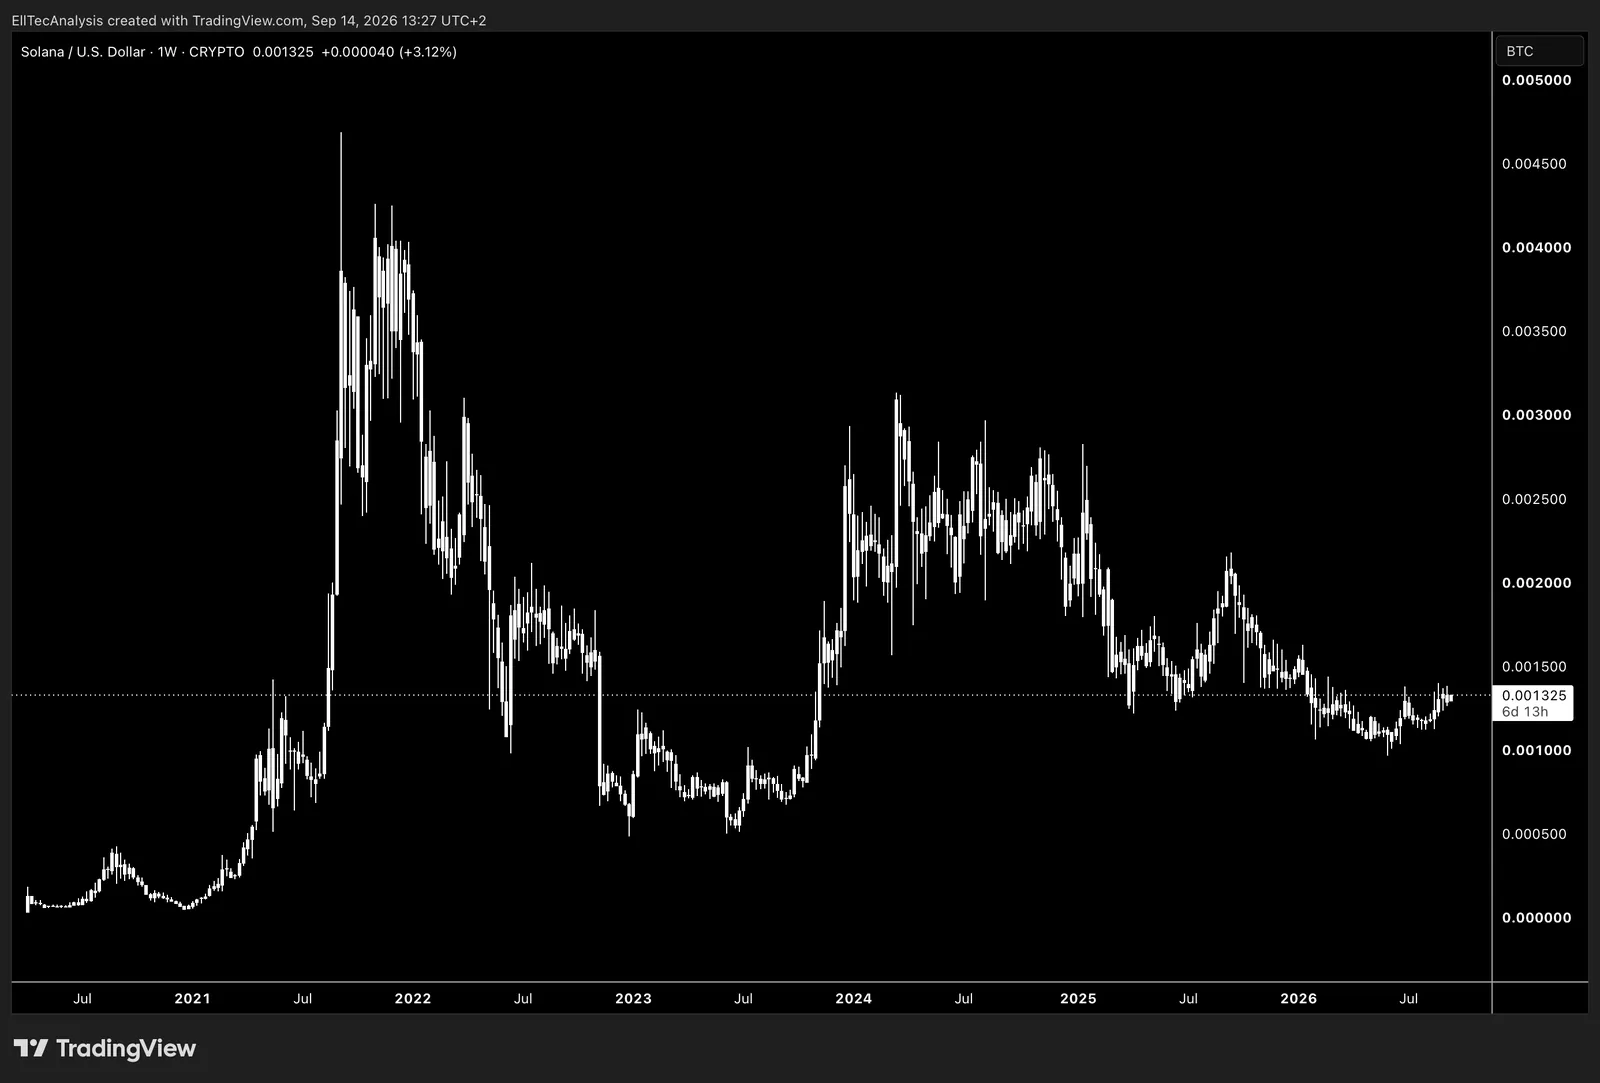
Shows how the Solana/Bitcoin price has moved over time, offering a clear view of Solana’s relative strength versus Bitcoin and how broader macro, liquidity, or monetary conditions influence its long‑term behavior.
Market Cap
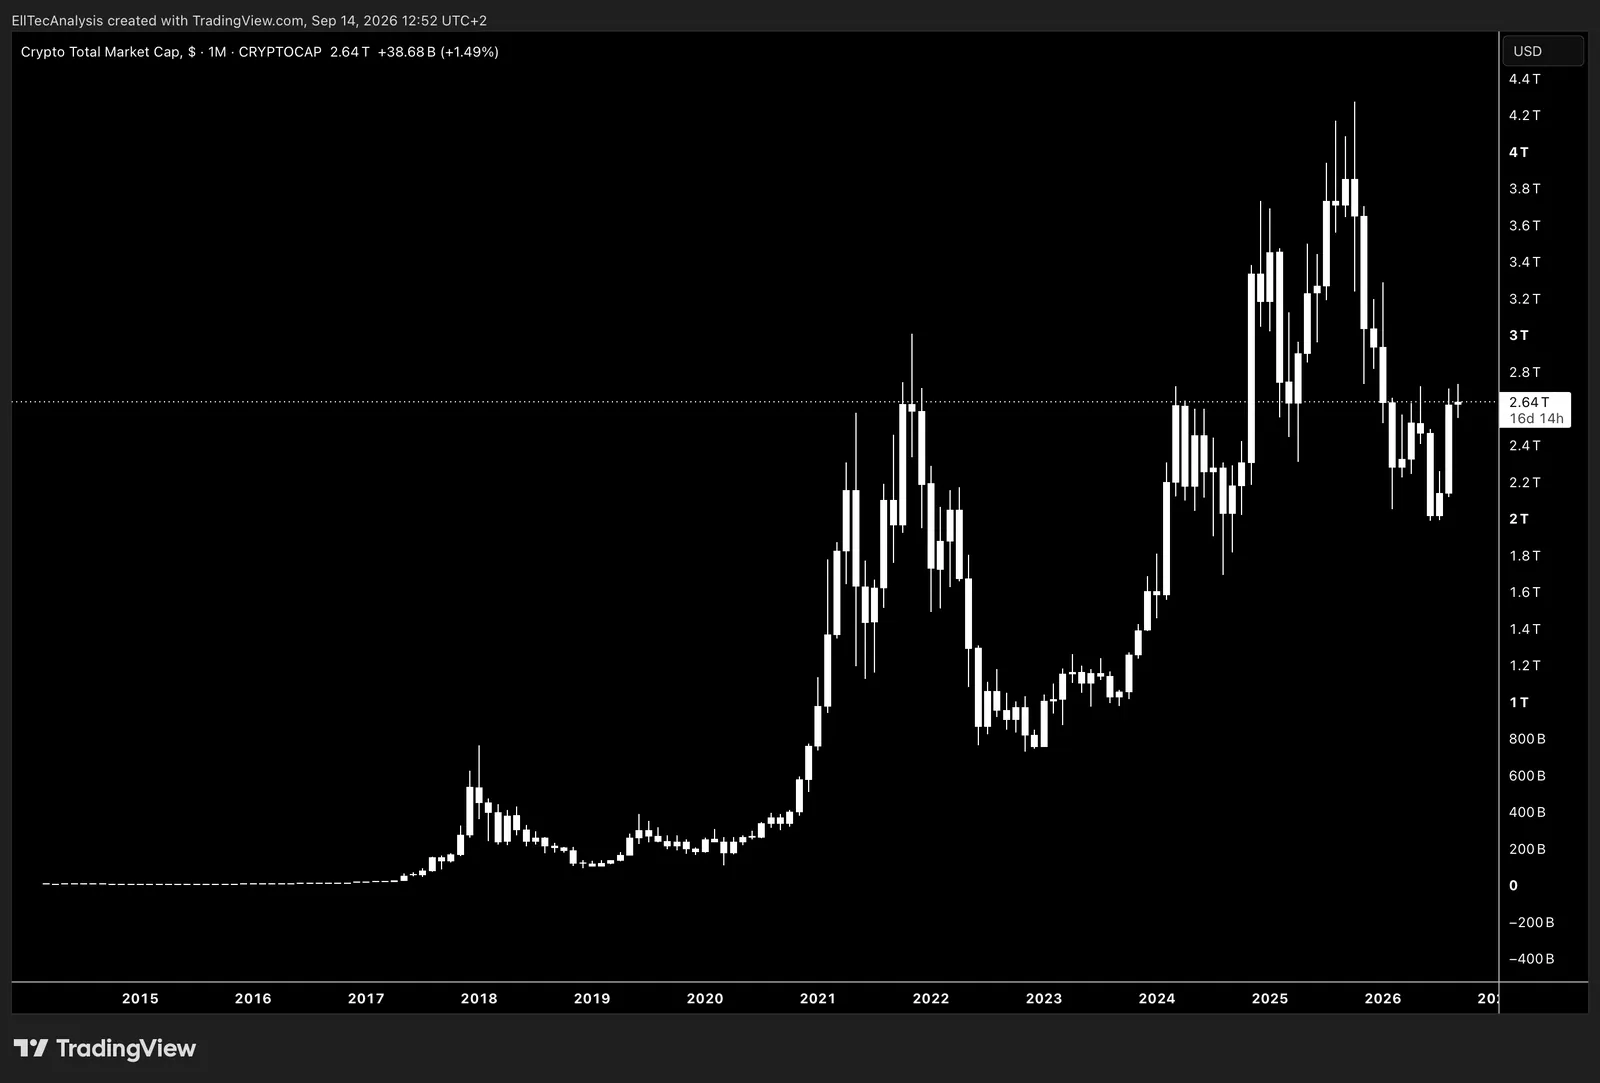
Shows how the Crypto Total Market Capitalisation has moved over time, offering a clear view of shifts in overall crypto‑asset valuations and how broader macro, liquidity, or monetary conditions influence the long‑term behavior of the entire digital‑asset ecosystem.
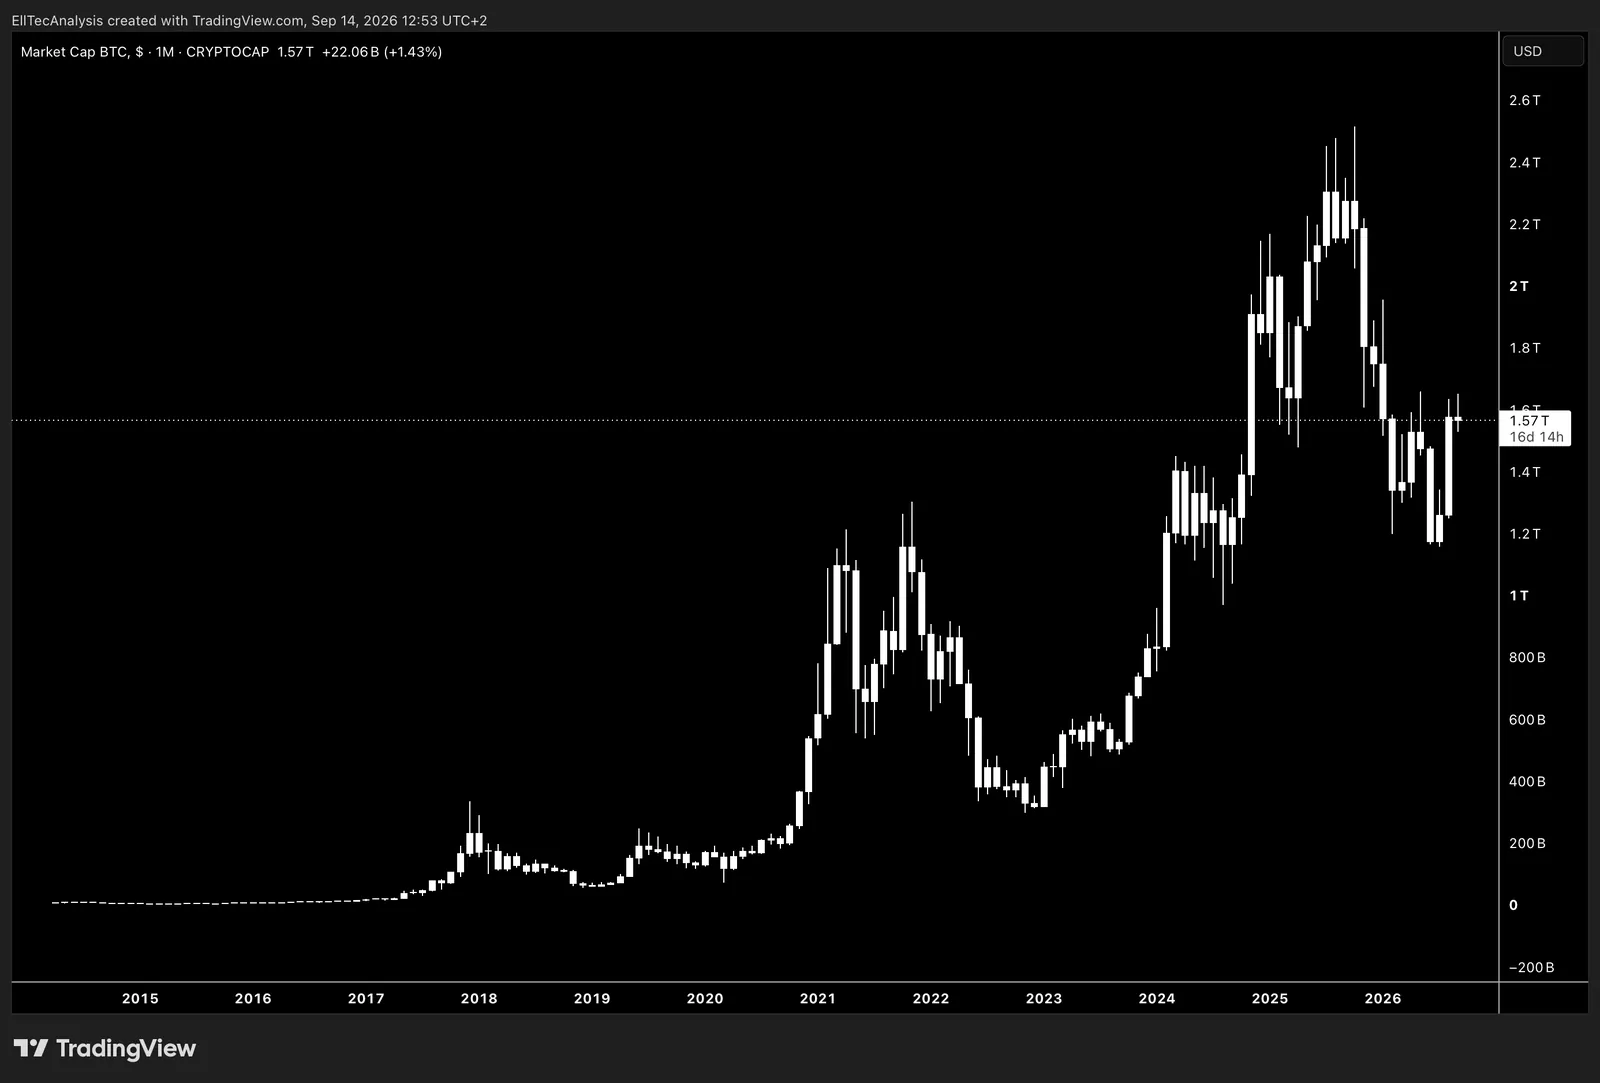
Shows how the Bitcoin Market Capitalisation has moved over time, offering a clear view of shifts in Bitcoin’s aggregate valuation and how broader macro, liquidity, or monetary conditions influence its long‑term behavior.
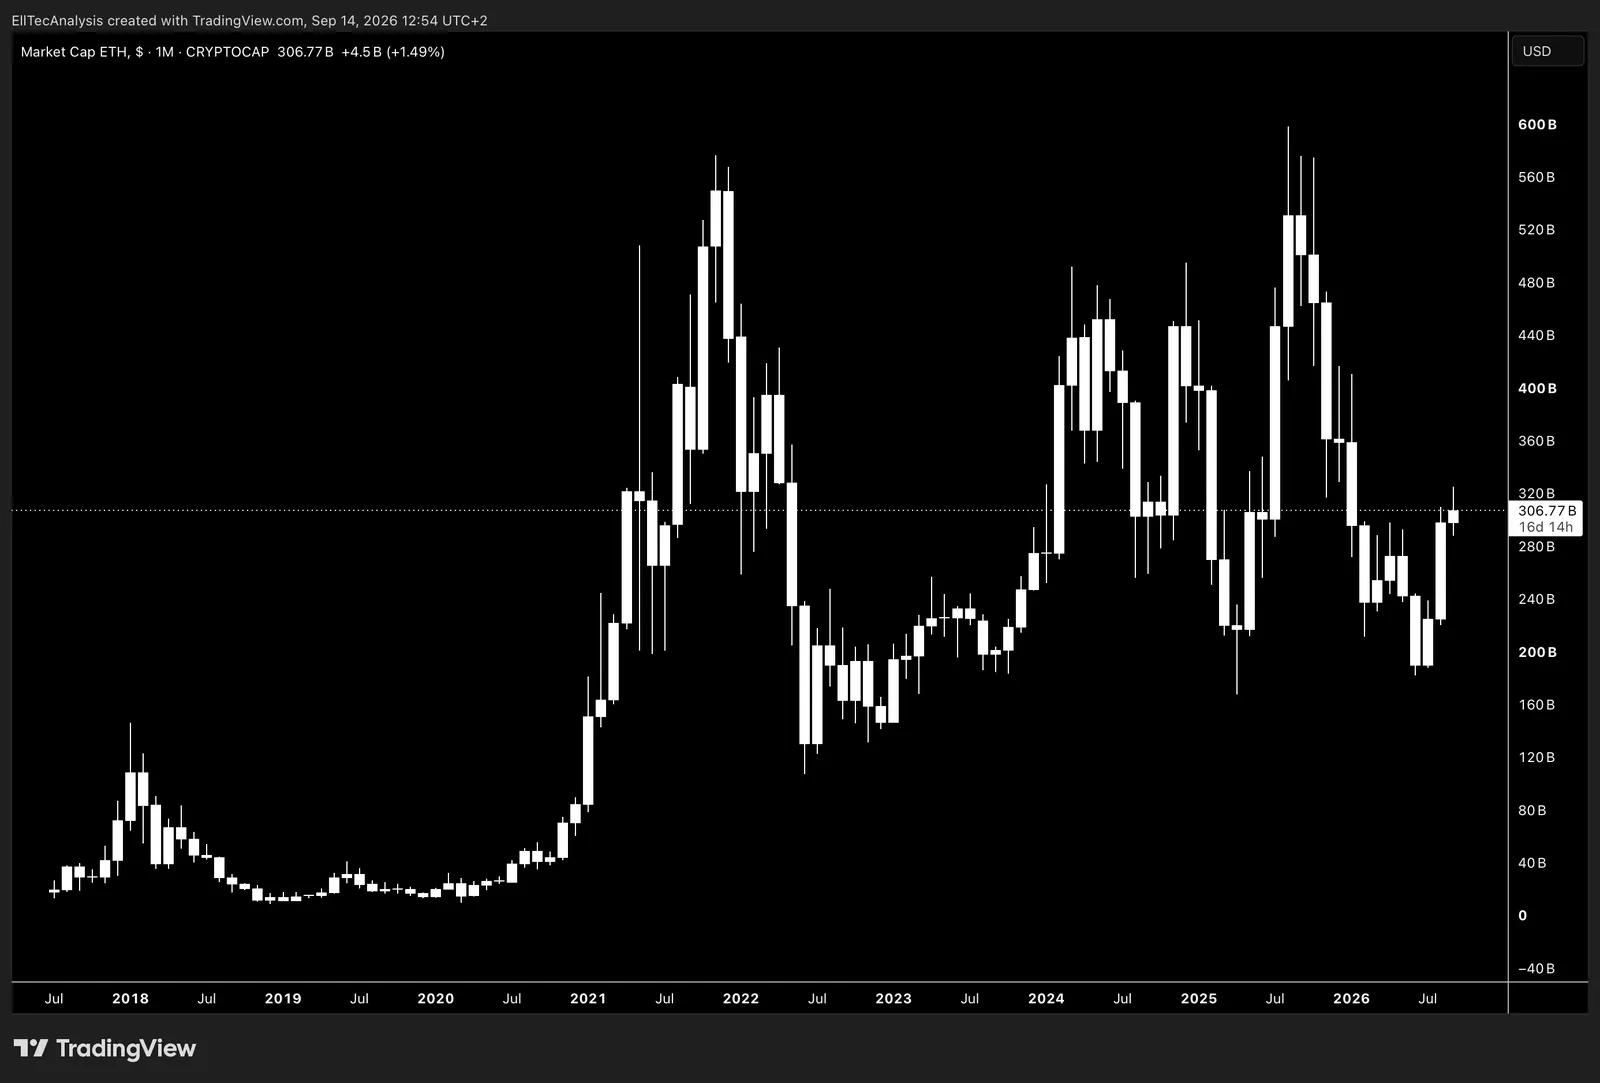
Shows how the Ethereum Market Capitalisation has moved over time, offering a clear view of shifts in Ethereum’s aggregate valuation and how broader macro, liquidity, or monetary conditions influence its long‑term behavior
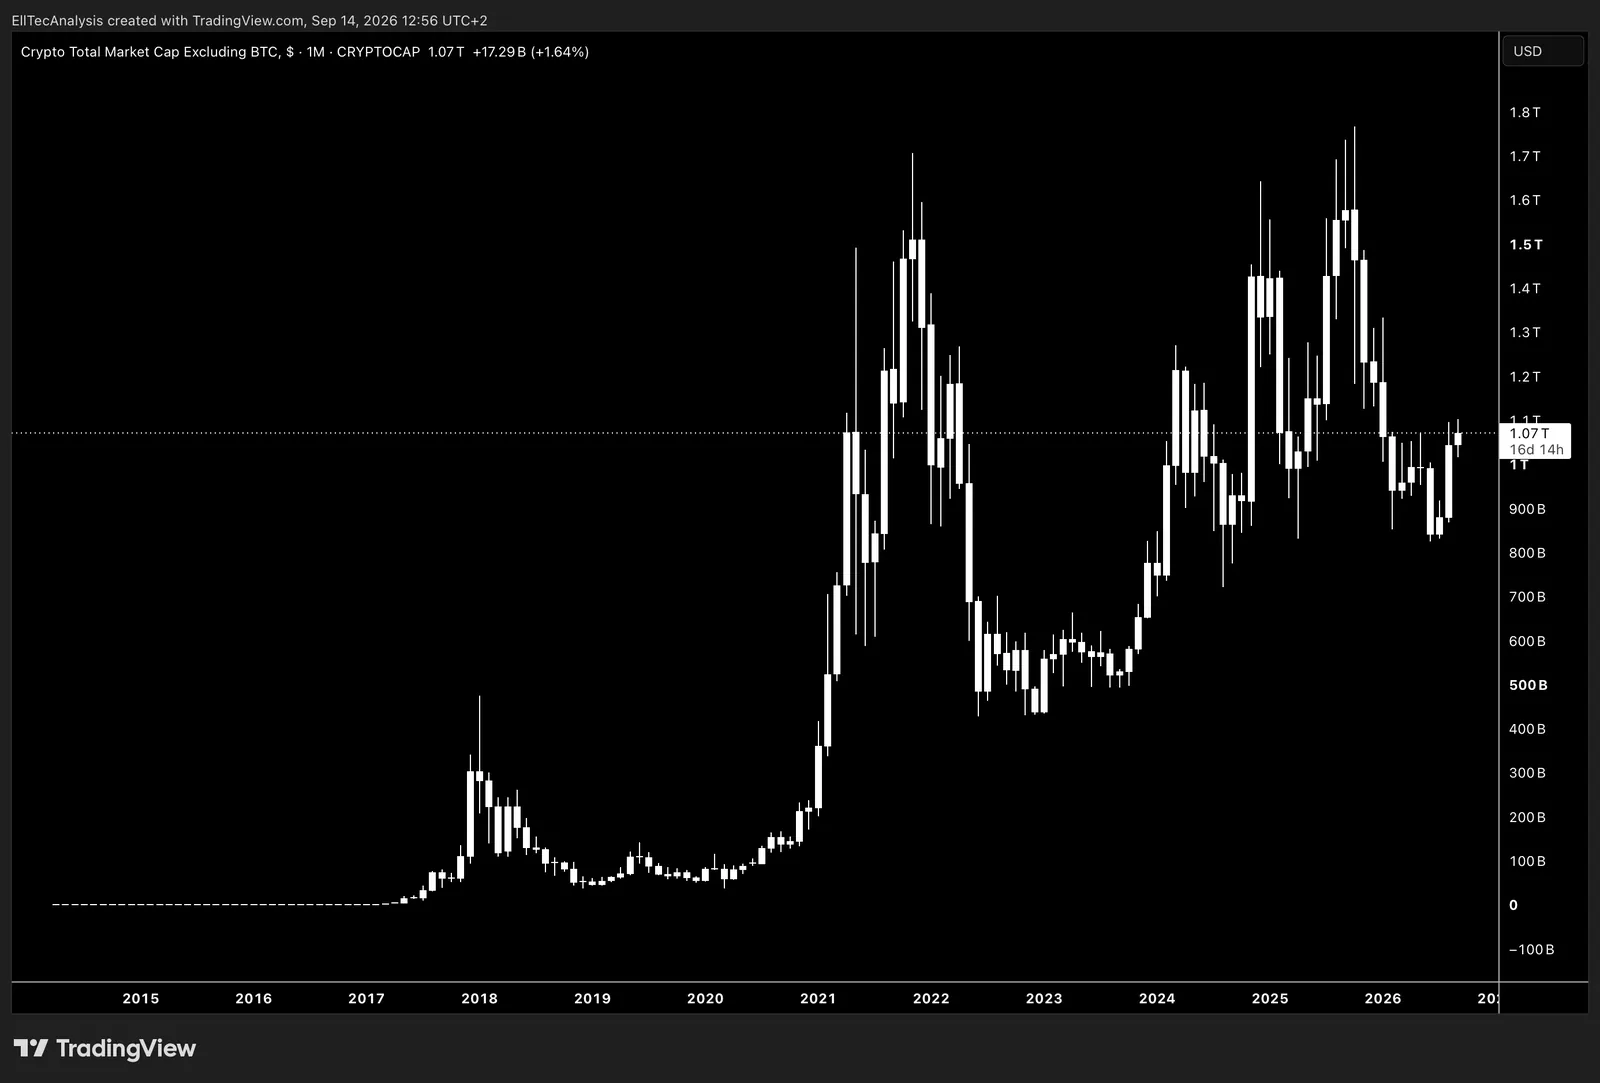
Shows how the Crypto Total Market Capitalisation excluding Bitcoin has moved over time, offering a clear view of shifts in the broader altcoin market and how macro, liquidity, or monetary conditions influence the long‑term behavior of non‑Bitcoin digital assets.
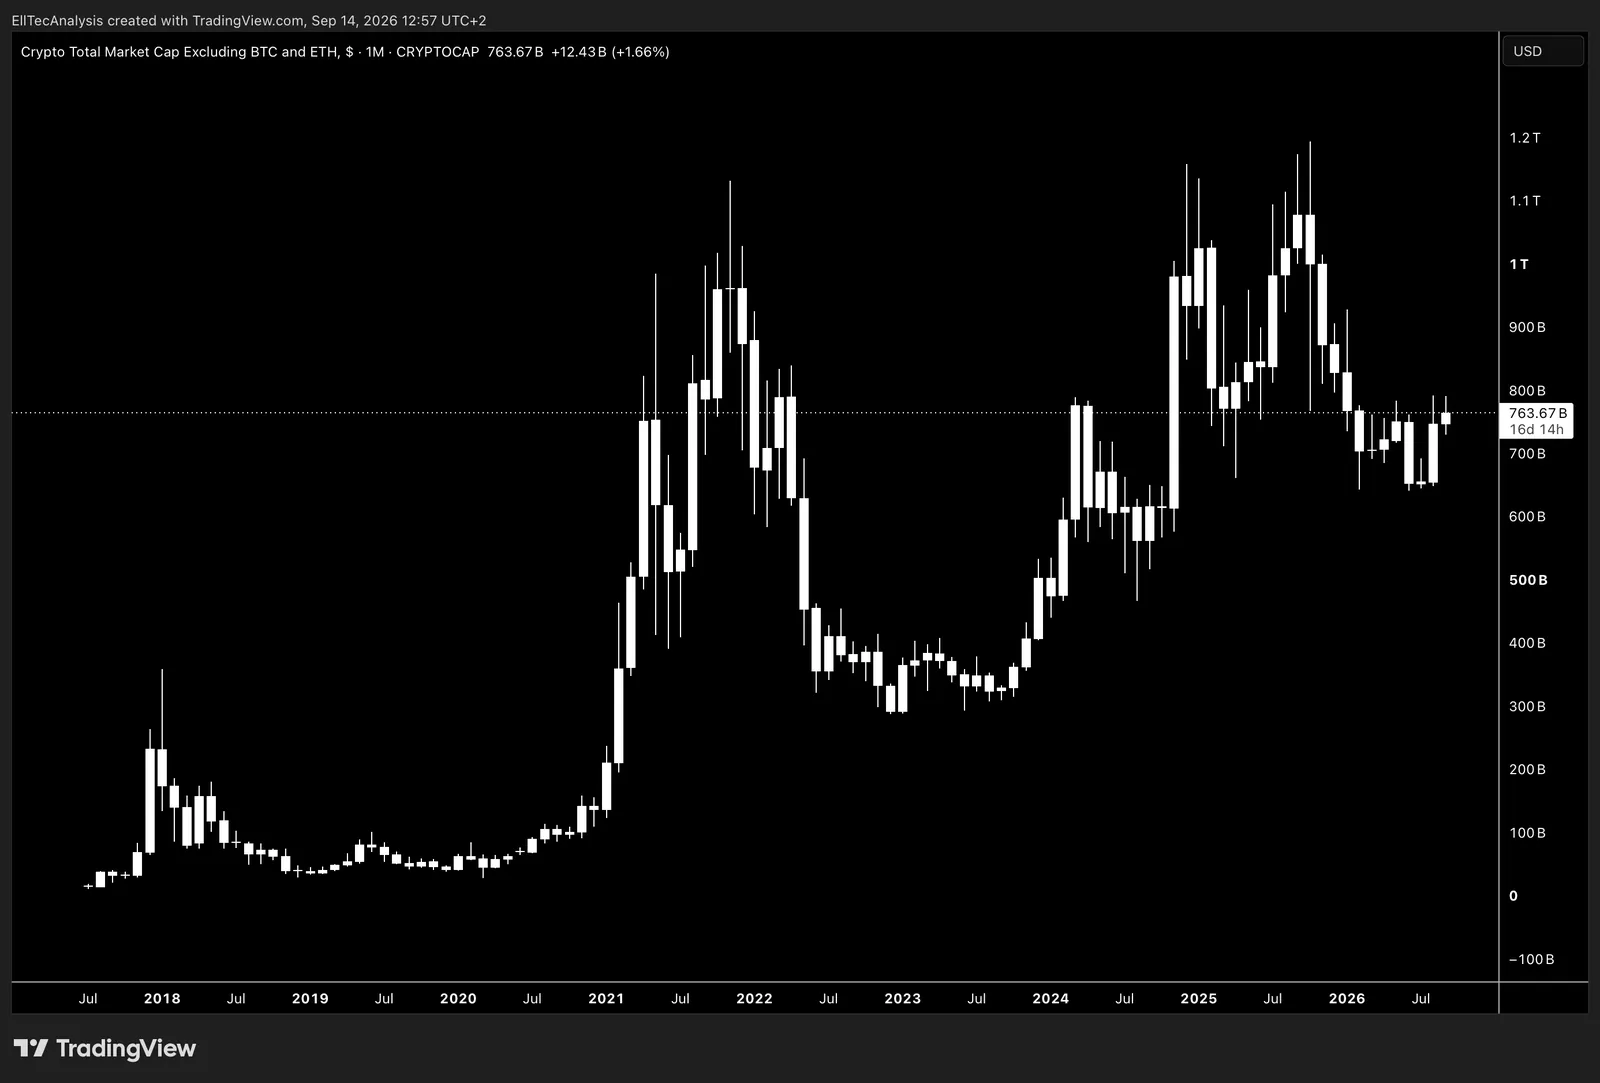
Shows how the Crypto Total Market Capitalisation excluding Bitcoin and Ethereum has moved over time, offering a clear view of shifts in the broader altcoin market and how macro, liquidity, or monetary conditions influence the long‑term behavior of all non‑BTC, non‑ETH digital assets.
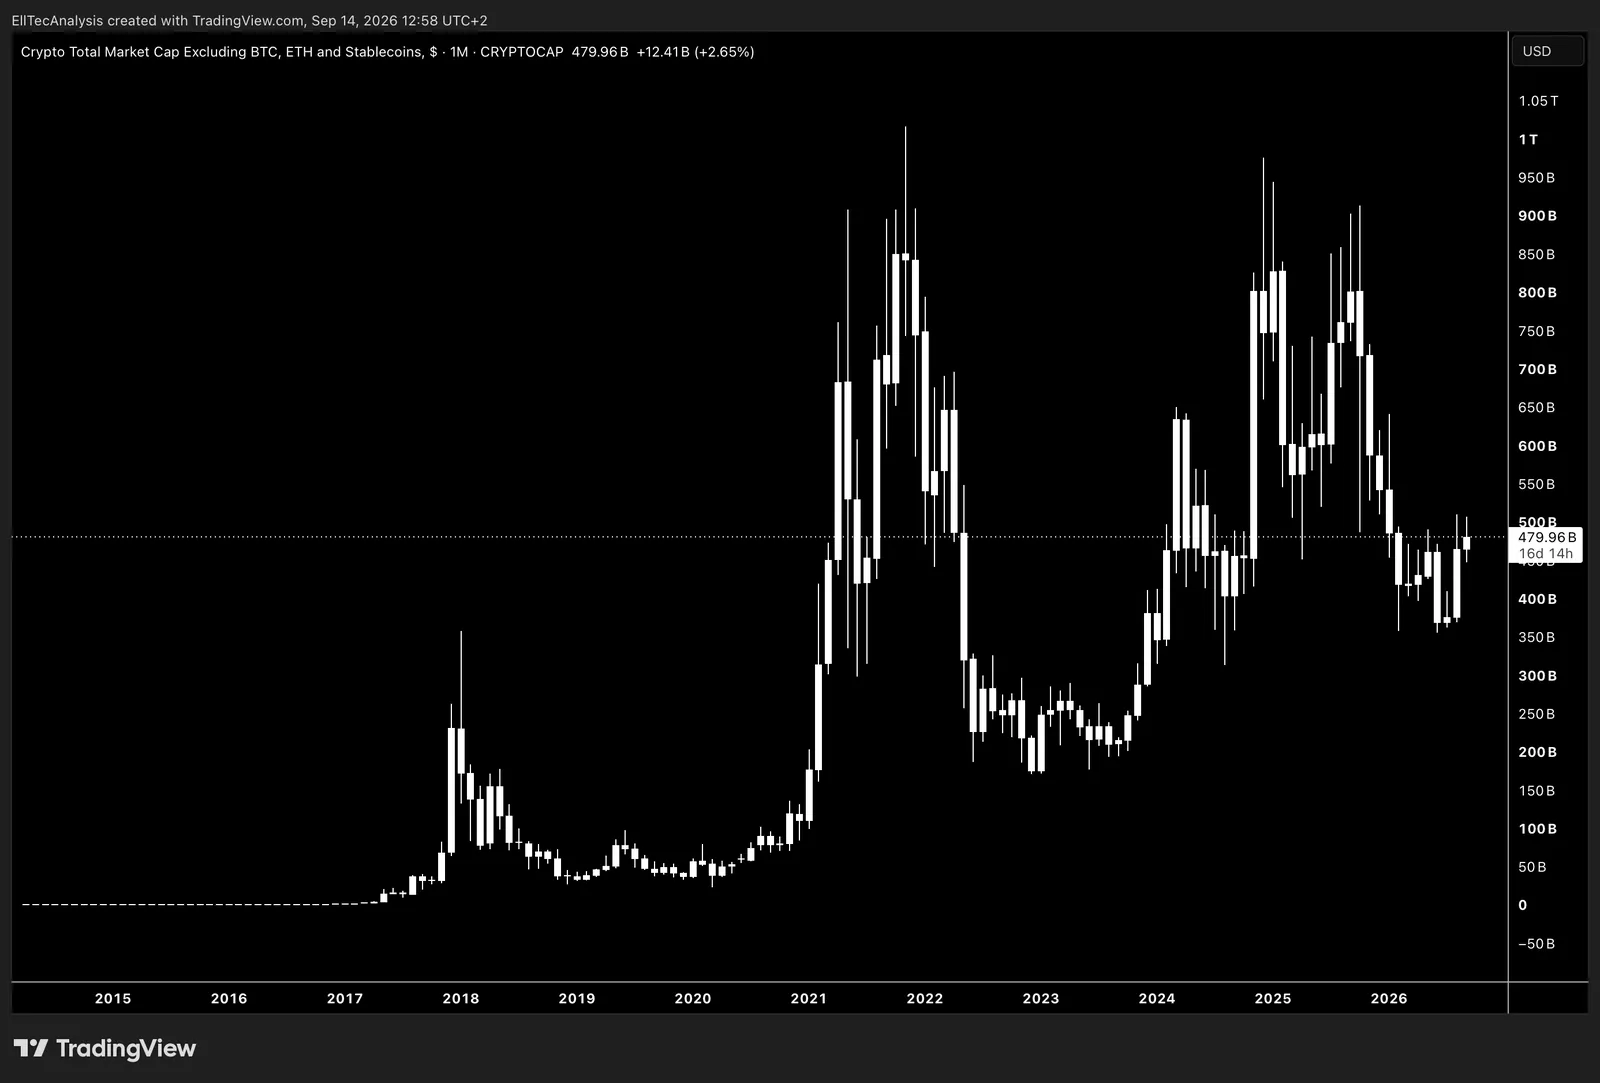
Shows how the Crypto Total Market Capitalisation excluding Bitcoin, Ethereum, and Stablecoins has moved over time, offering a clear view of shifts in the true altcoin market and how macro, liquidity, or monetary conditions influence the long‑term behavior of all non‑BTC, non‑ETH, non‑stablecoin digital assets.
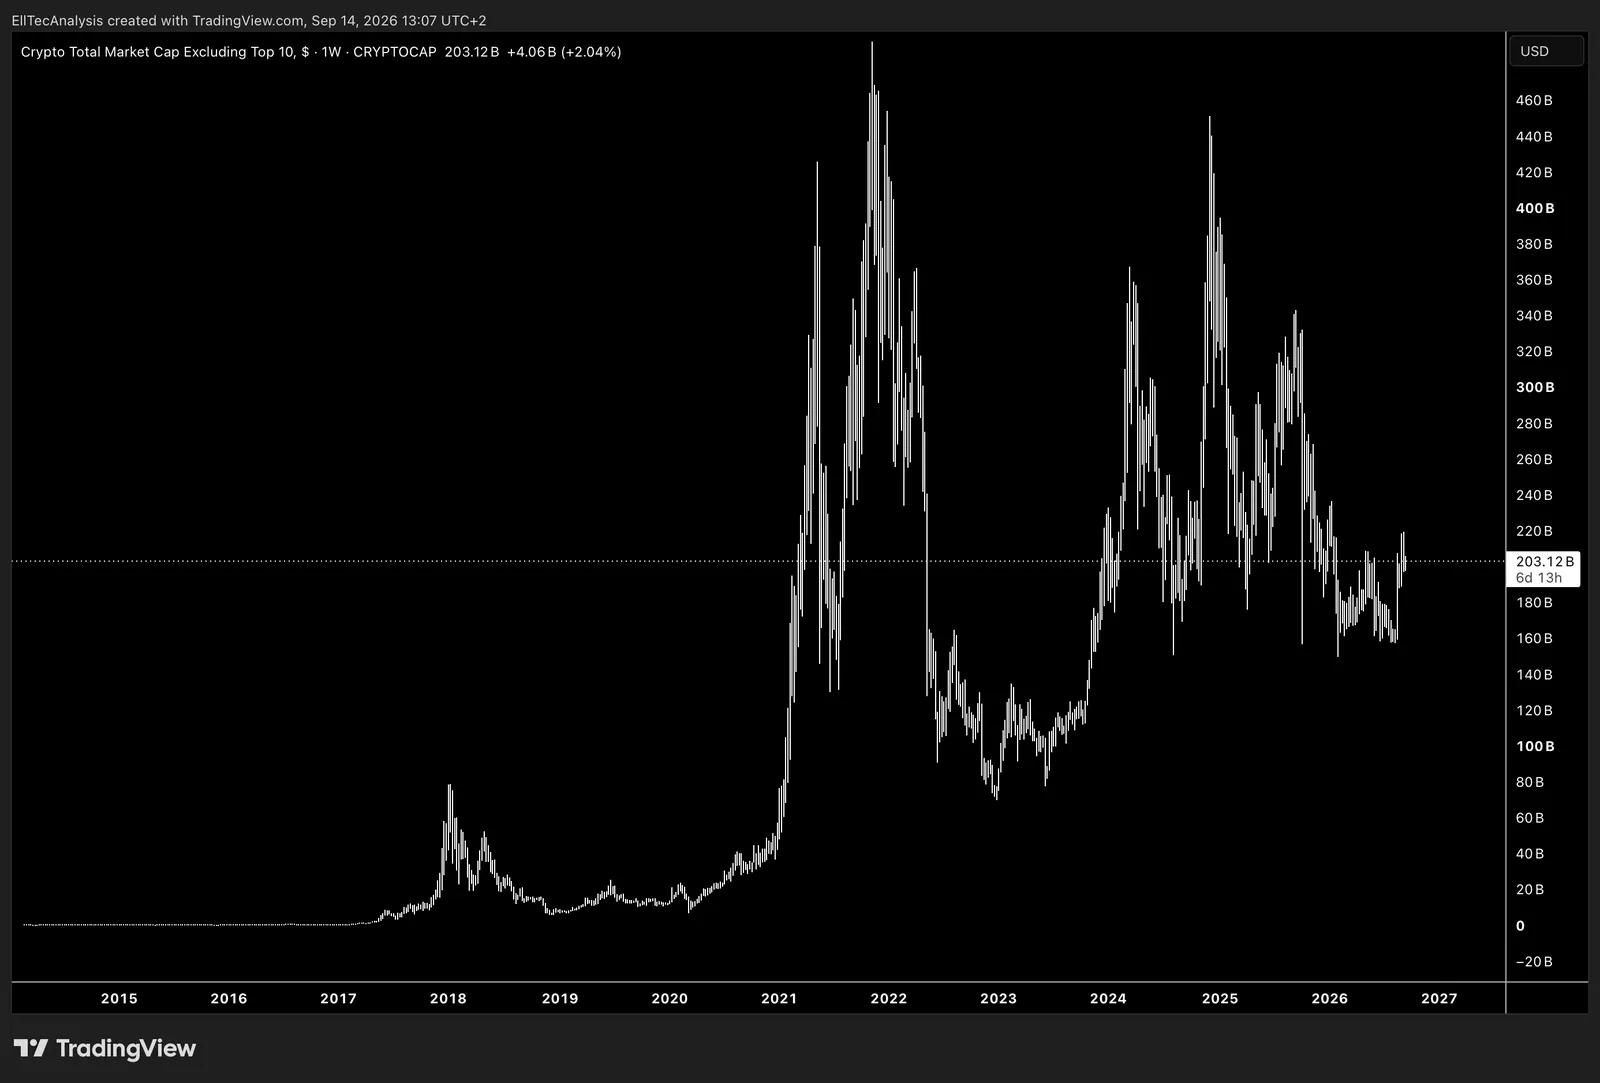
Shows how the Crypto Total Market Capitalisation excluding the Top 10 assets has moved over time, offering a clear view of shifts in the mid‑cap and small‑cap altcoin sector and how macro, liquidity, or monetary conditions influence the long‑term behavior of the broader, high‑beta portion of the crypto market.
Dominance
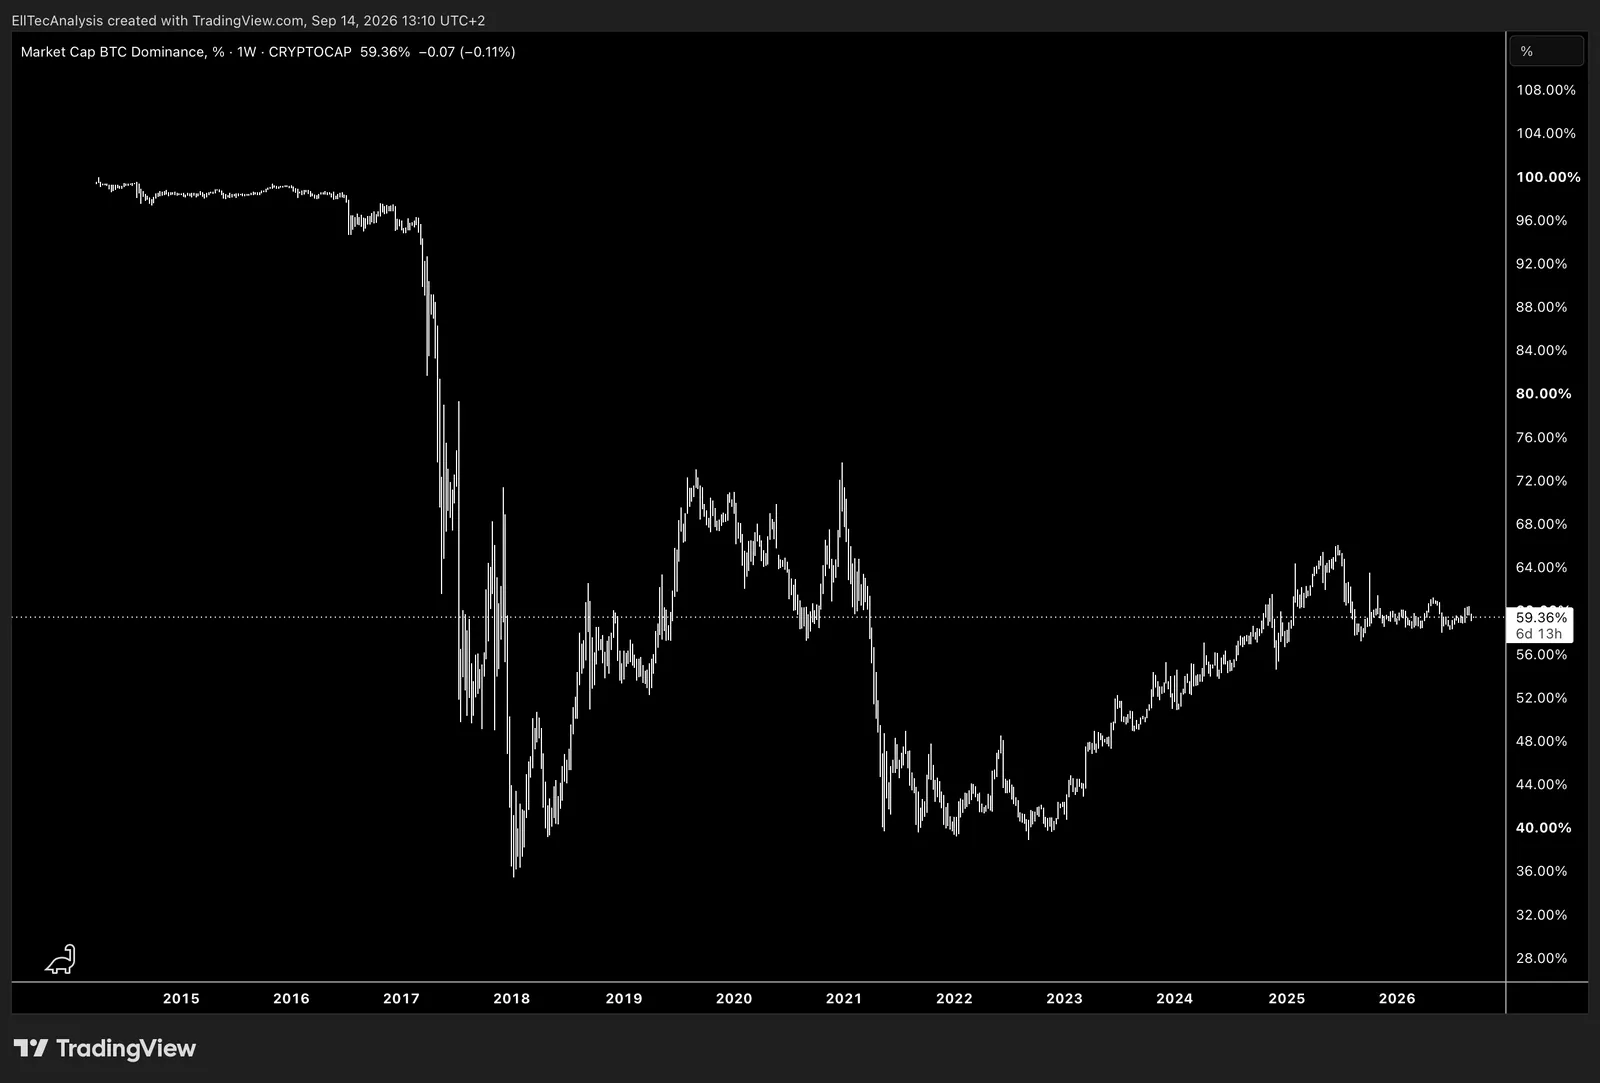
Shows how Bitcoin Dominance, Bitcoin’s share of the total crypto market capitalisation, has moved over time, offering a clear view of shifts in Bitcoin’s relative strength versus the broader crypto market and how macro, liquidity, or monetary conditions influence long‑term market structure.
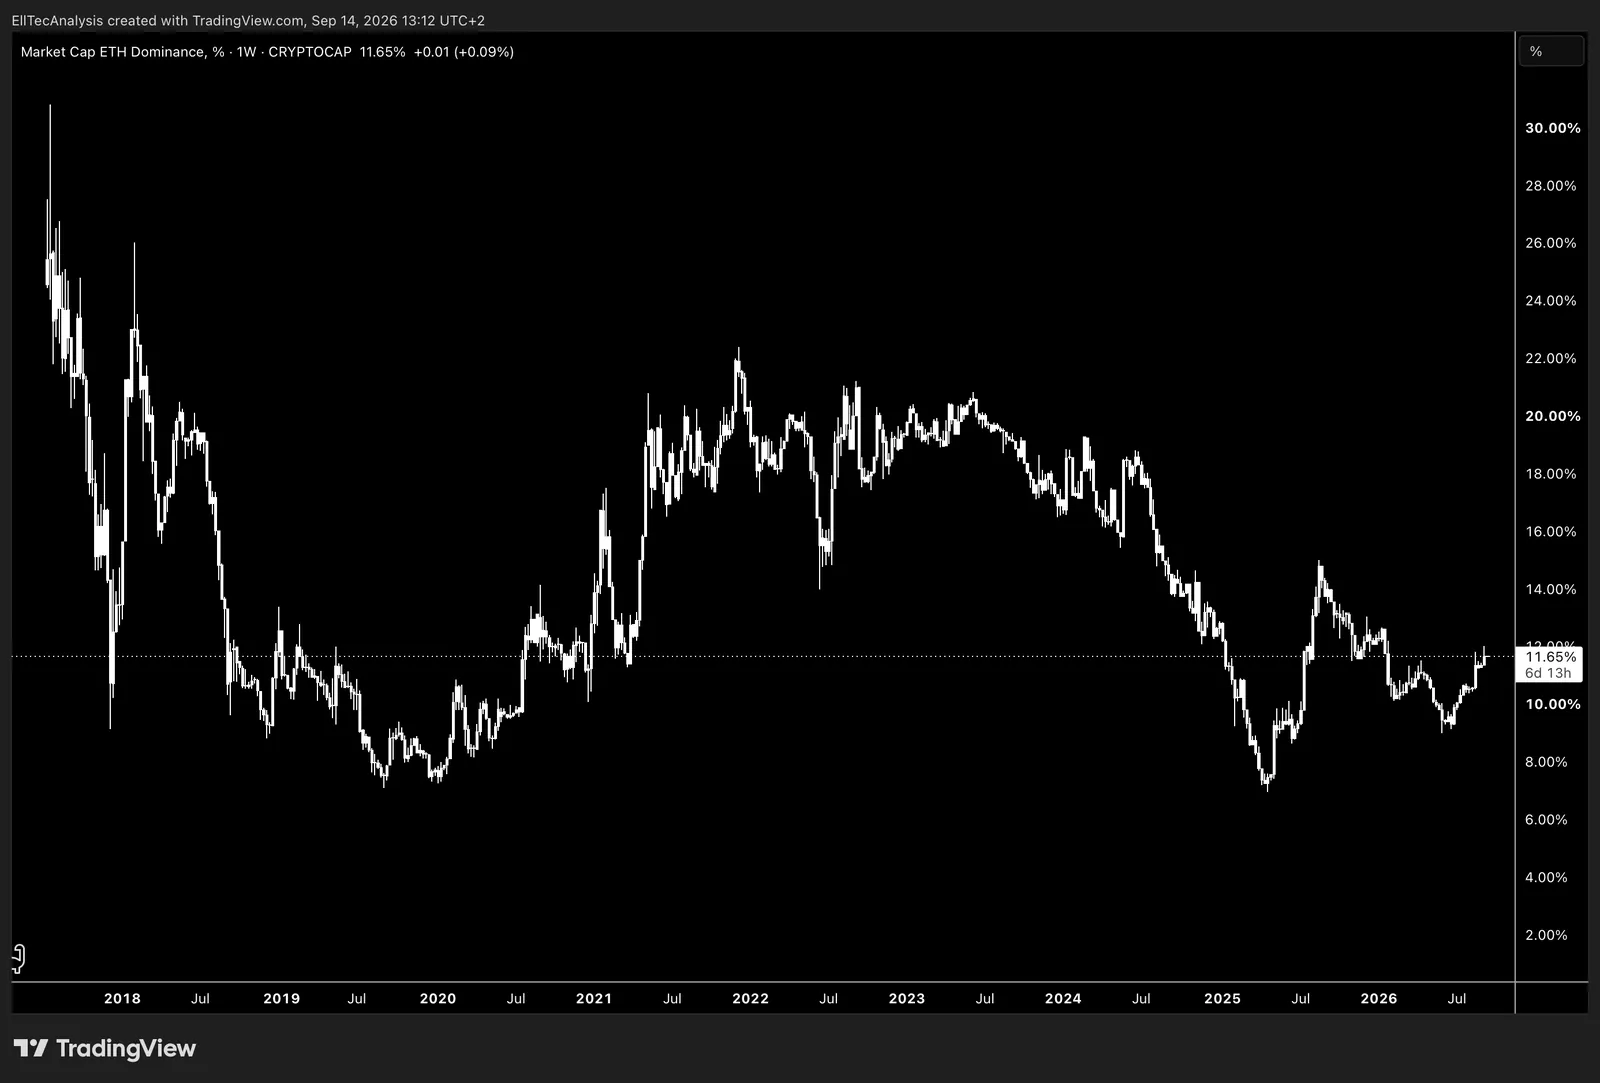
Shows how Ethereum Dominance, Ethereum’s share of the total crypto market capitalisation, has moved over time, offering a clear view of shifts in Ethereum’s relative strength versus the broader crypto market and how macro, liquidity, or monetary conditions influence long‑term market structure.
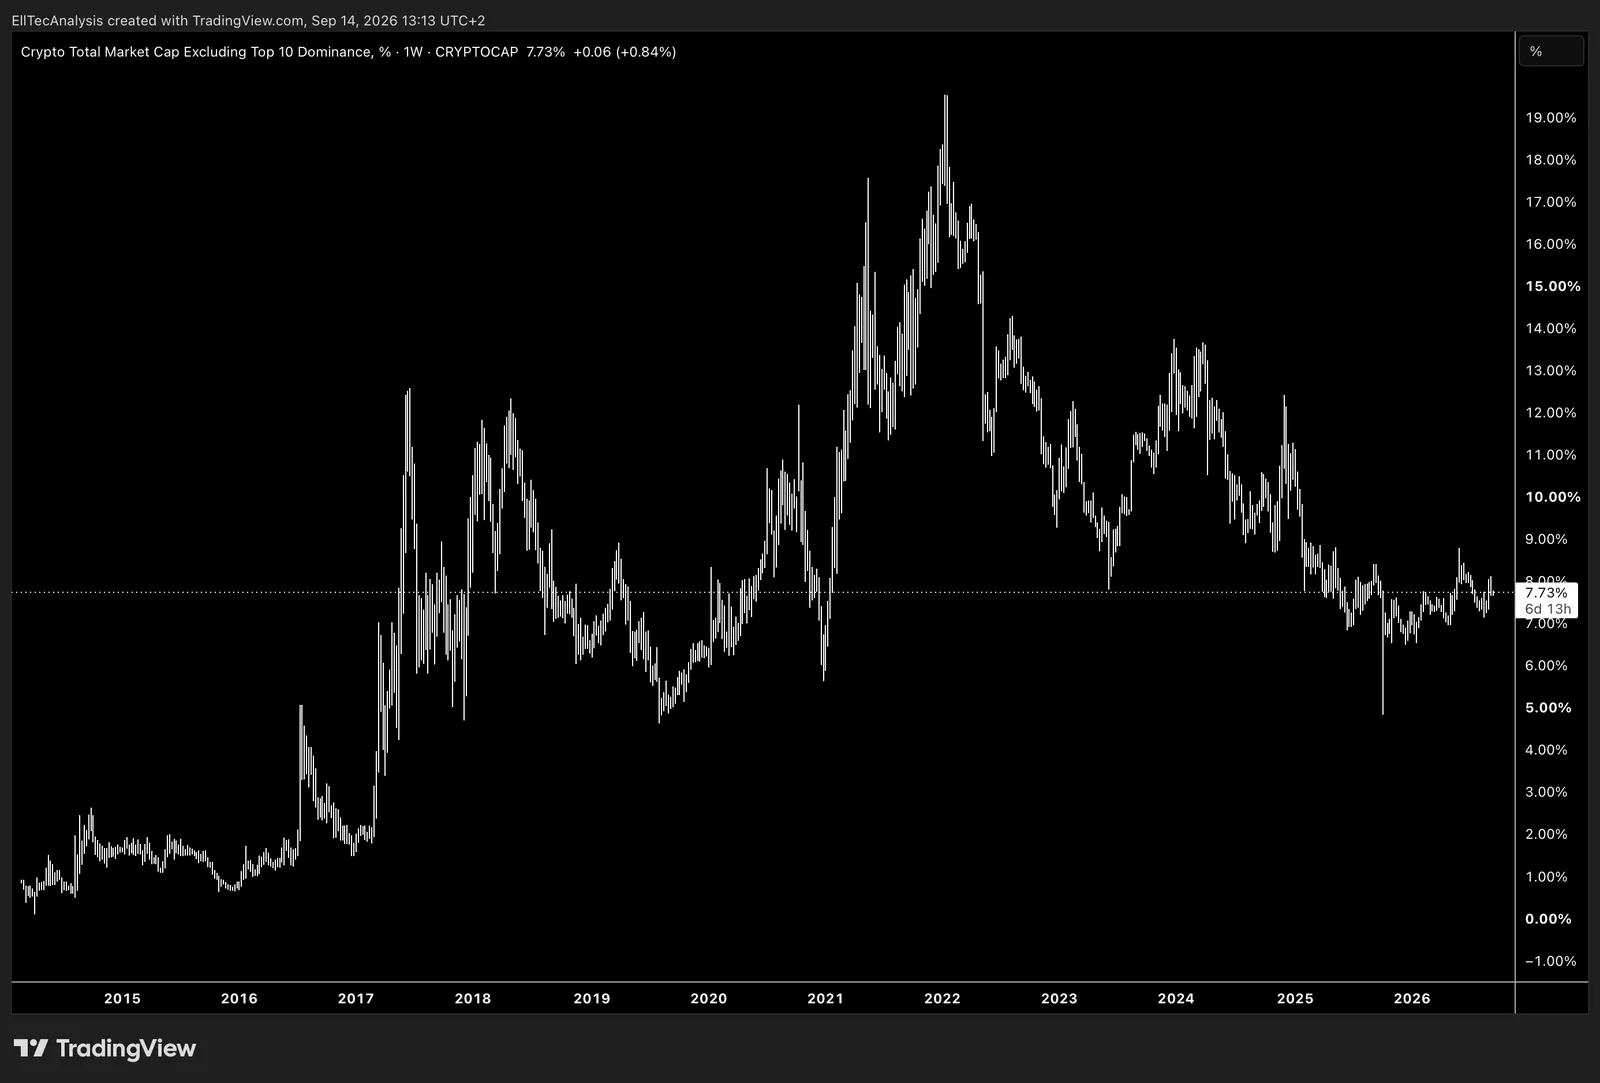
Shows how the Crypto Total Market Capitalisation excluding the Top 10, expressed as Dominance has moved over time, offering a clear view of how the mid‑cap and small‑cap sector behaves relative to the entire crypto market and how macro, liquidity, or monetary conditions influence the long‑term structure of high‑beta altcoins.
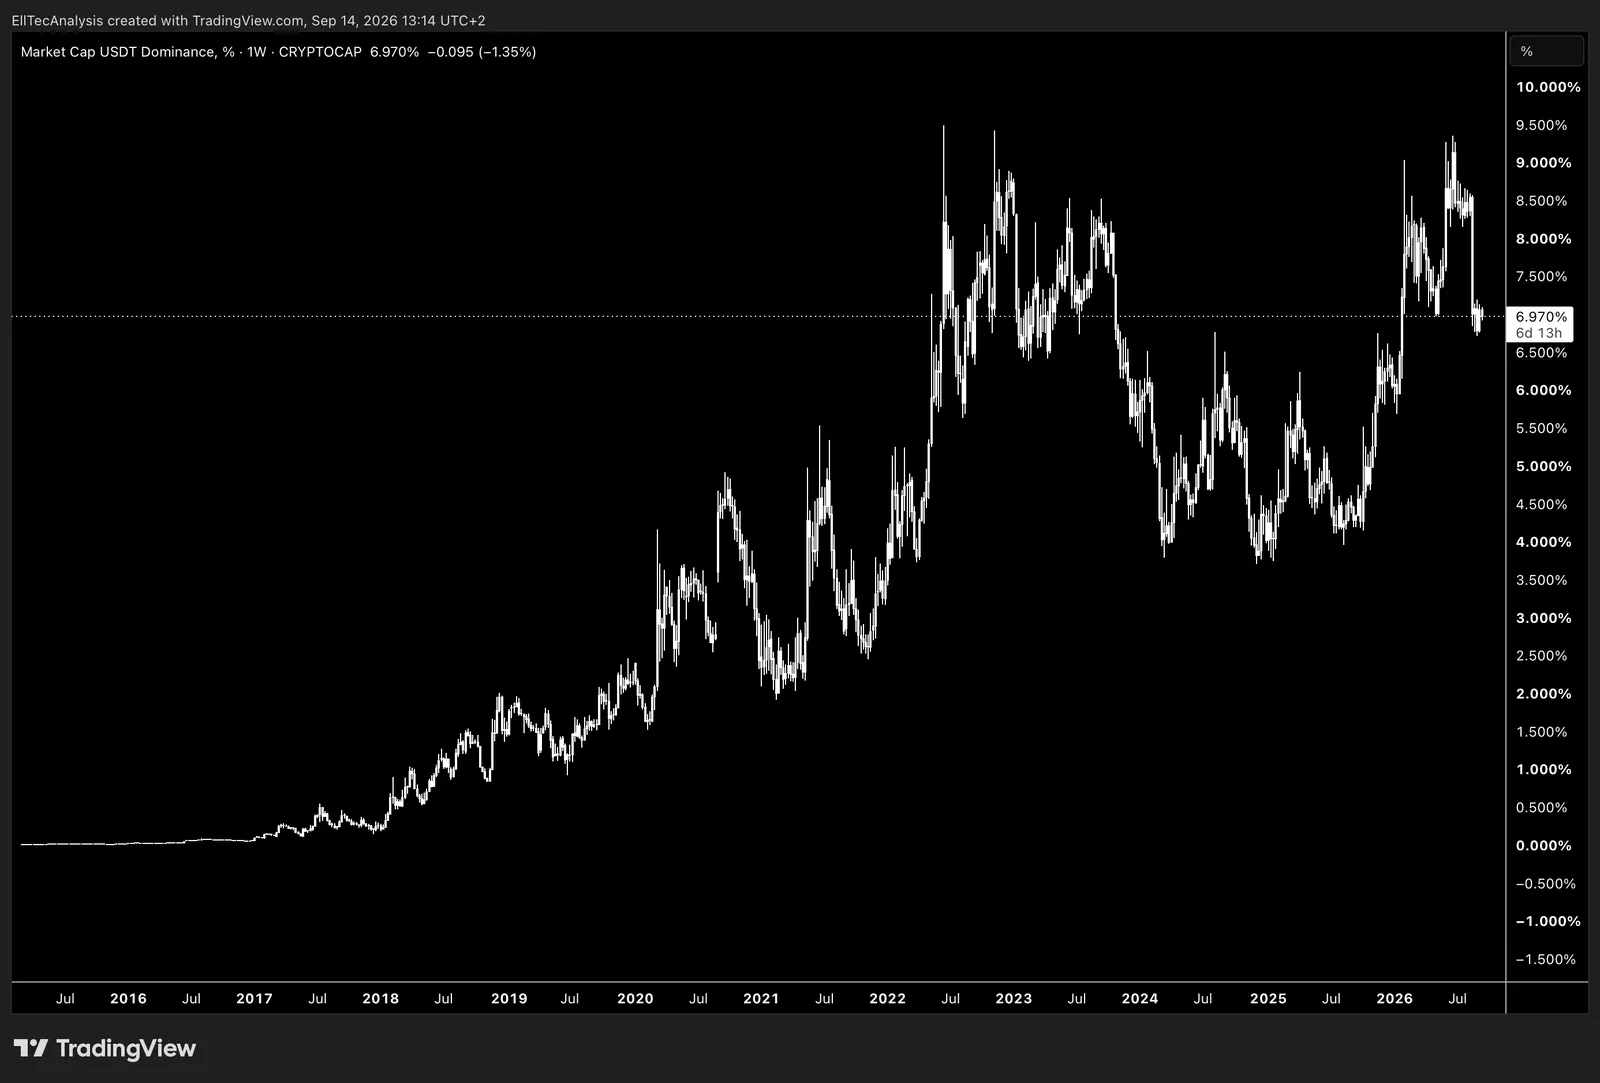
Shows how USDT Dominance has moved over time, offering a clear view of how liquidity preference, risk‑off behavior, and macro or monetary conditions influence the proportion of capital parked in stablecoins versus risk assets.
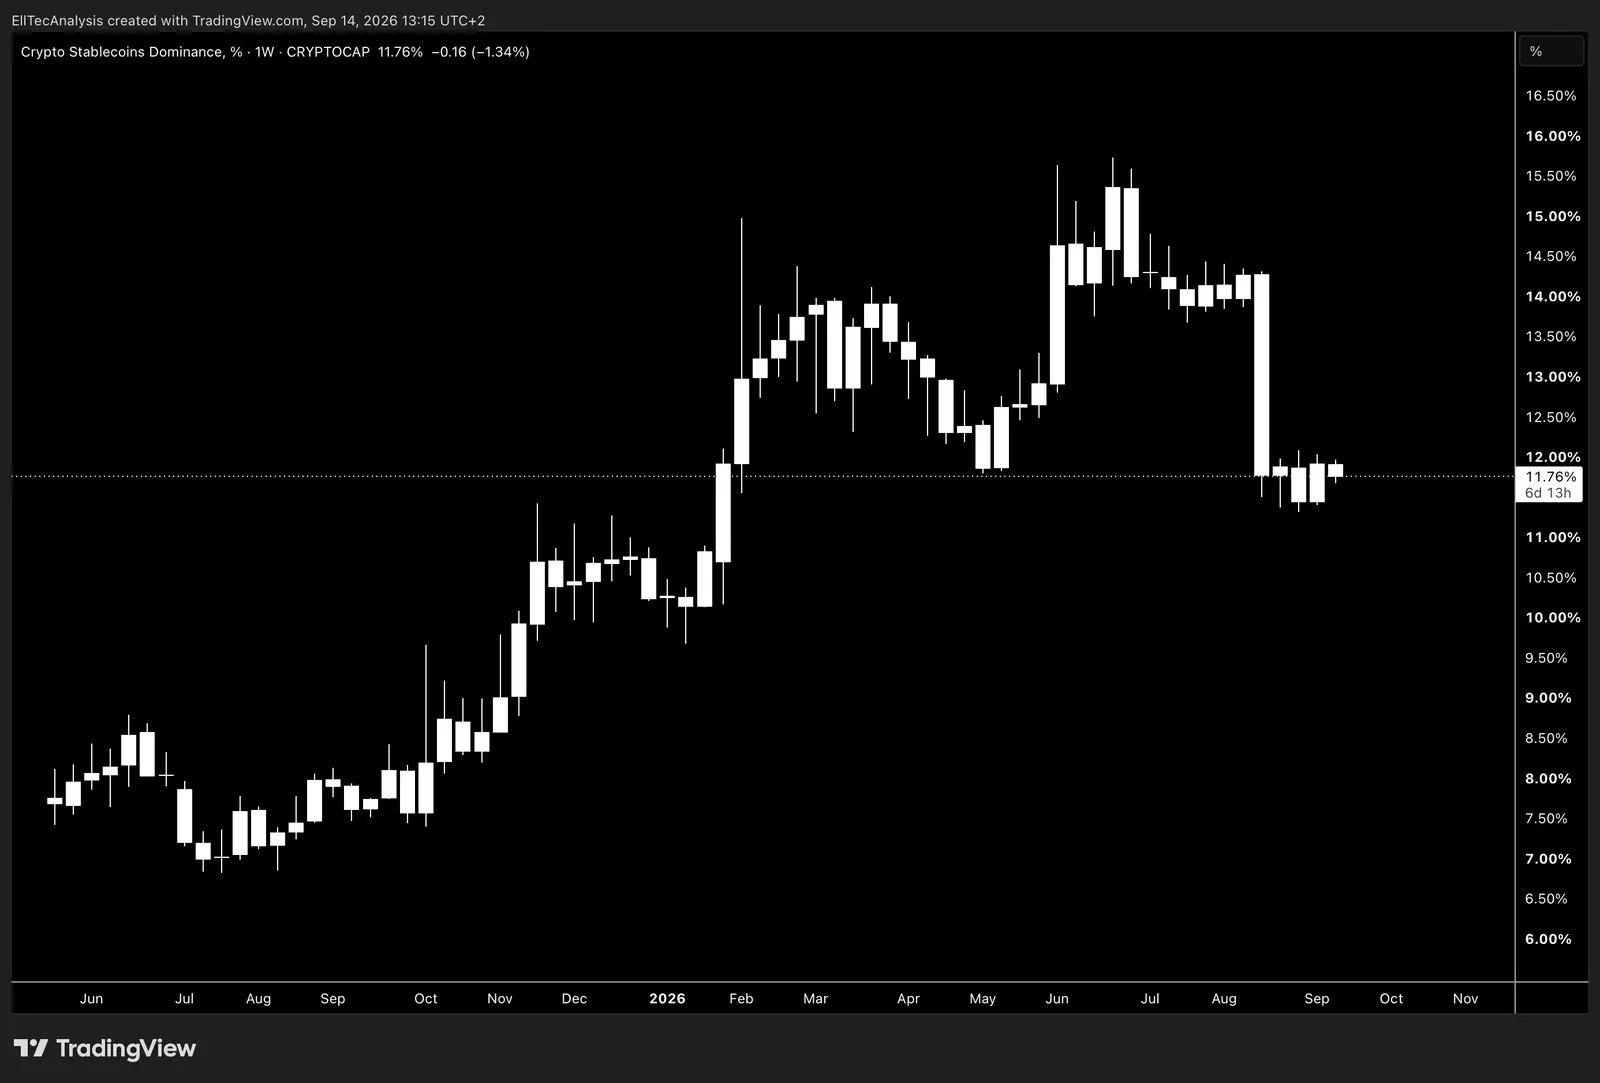
Shows how Stablecoin Dominance, the combined share of all major stablecoins within the total crypto market capitalisation, has moved over time, offering a clear view of how liquidity preference, risk‑off positioning, and macro or monetary conditions influence the proportion of capital parked in stable‑value assets versus volatile crypto risk assets.
Further Crypto Metrics
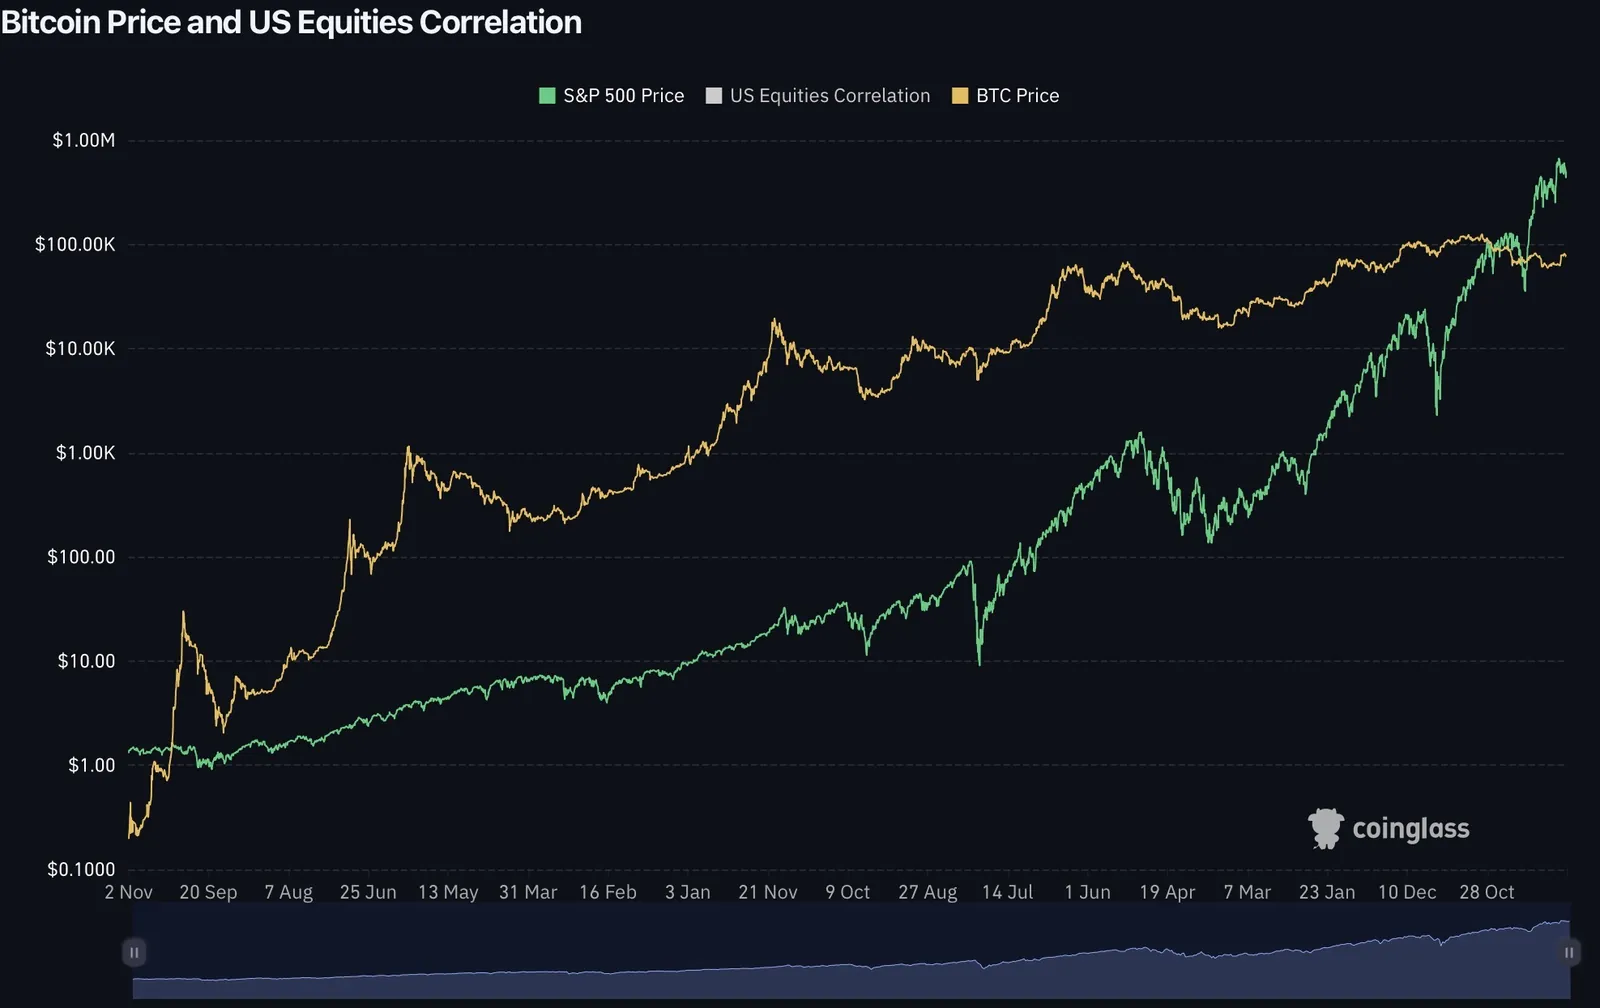
Shows how the Bitcoin Price relative to US Equities has moved over time, offering a clear view of how Bitcoin behaves versus traditional risk assets and how macro, liquidity, or monetary conditions influence the long‑term relationship between crypto and the broader equity market.
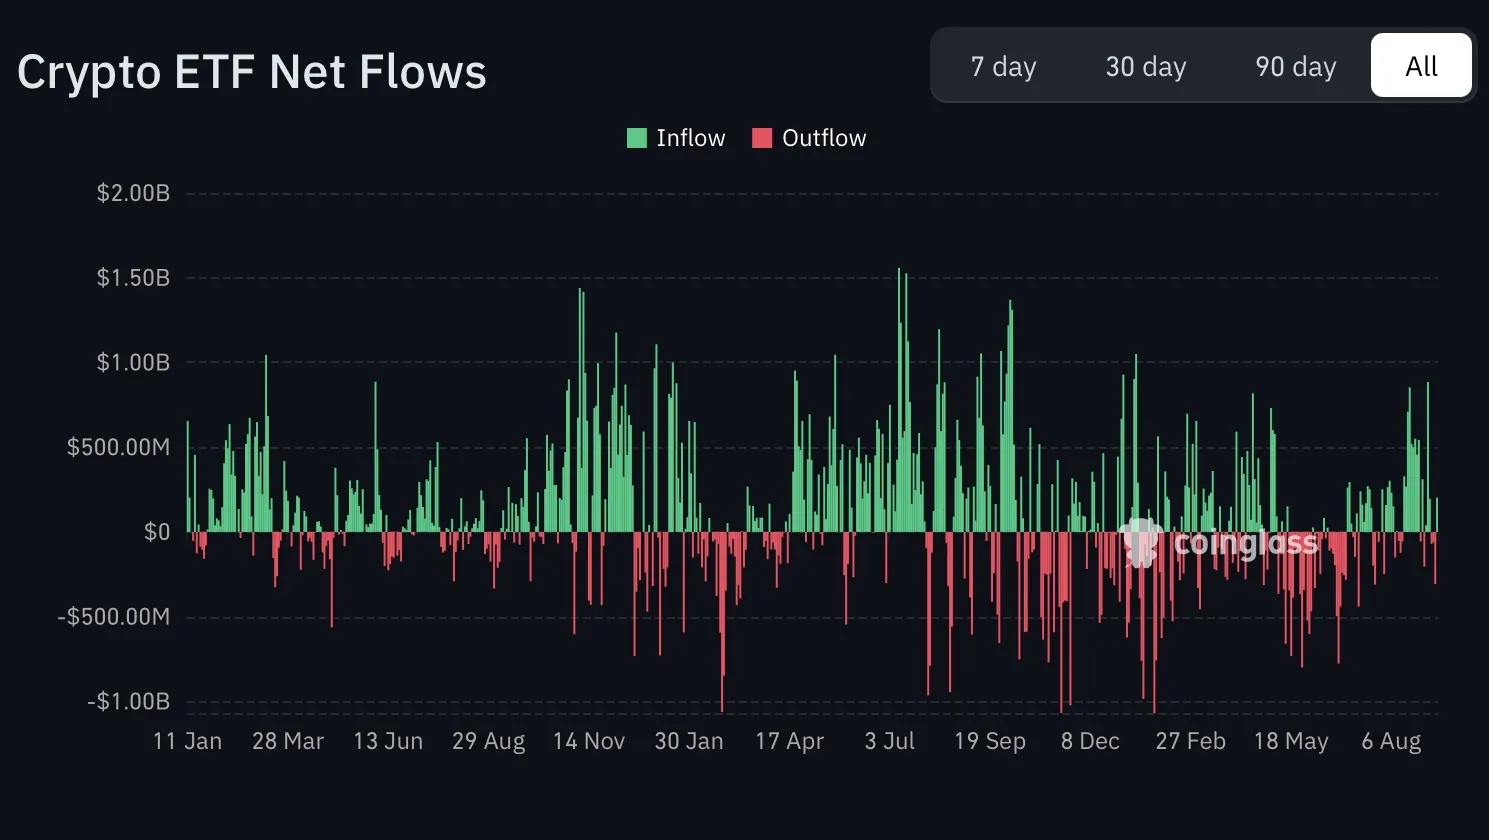
Shows how Bitcoin ETF Net Flows have moved over time, offering a clear view of how institutional demand, liquidity conditions, and macro‑driven allocation behavior influence the strength and sustainability of Bitcoin’s broader market cycle.
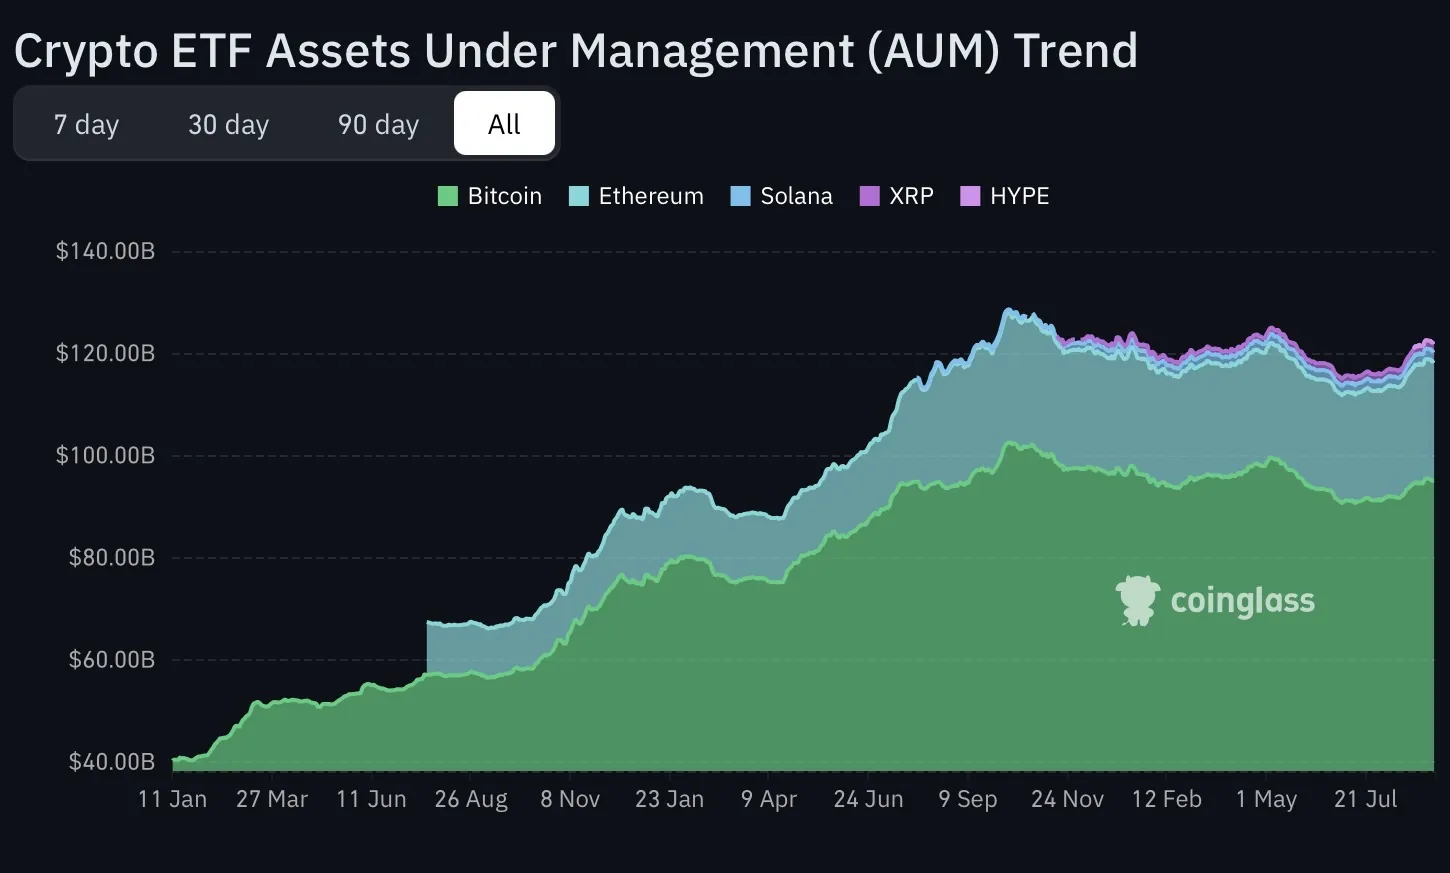
Shows how Crypto ETF Assets Under Management (AUM) have trended over time, offering a clear view of how institutional participation, product adoption, and macro‑driven allocation behavior influence the scale and maturity of exchange‑traded crypto investment vehicles.
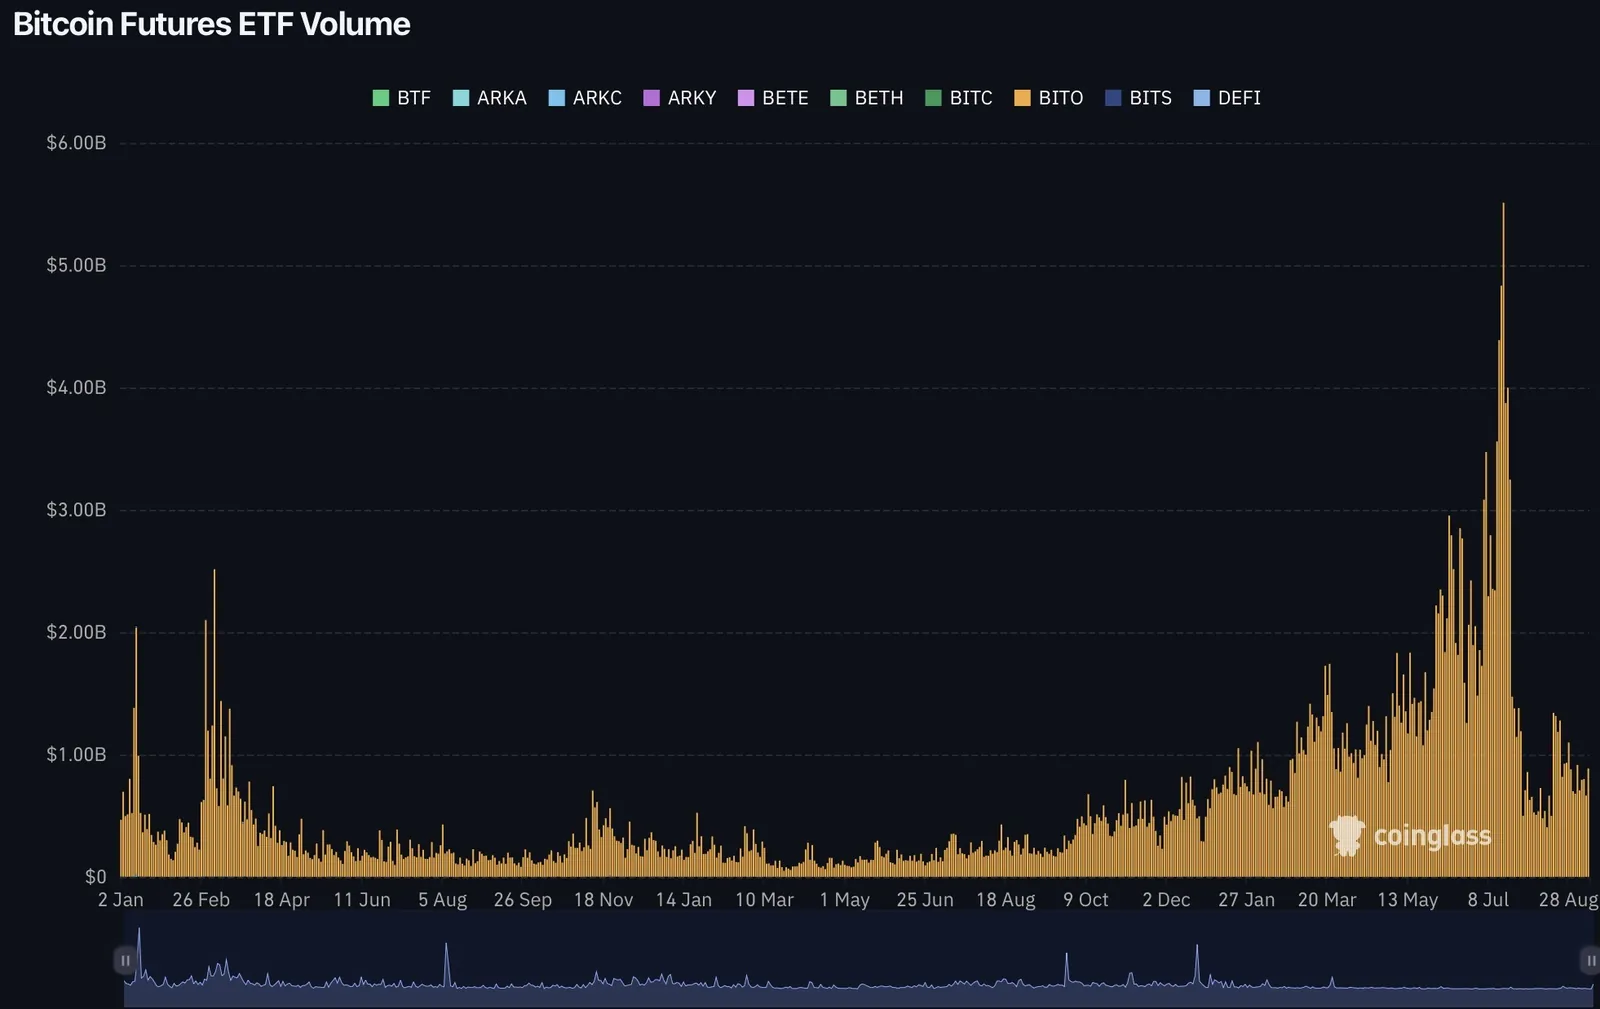
Shows how Bitcoin Futures ETF Volume has moved over time, offering a clear view of how derivatives‑based ETF activity reflects institutional trading appetite, leverage conditions, and macro‑driven shifts in speculative versus hedging demand within the broader Bitcoin market.
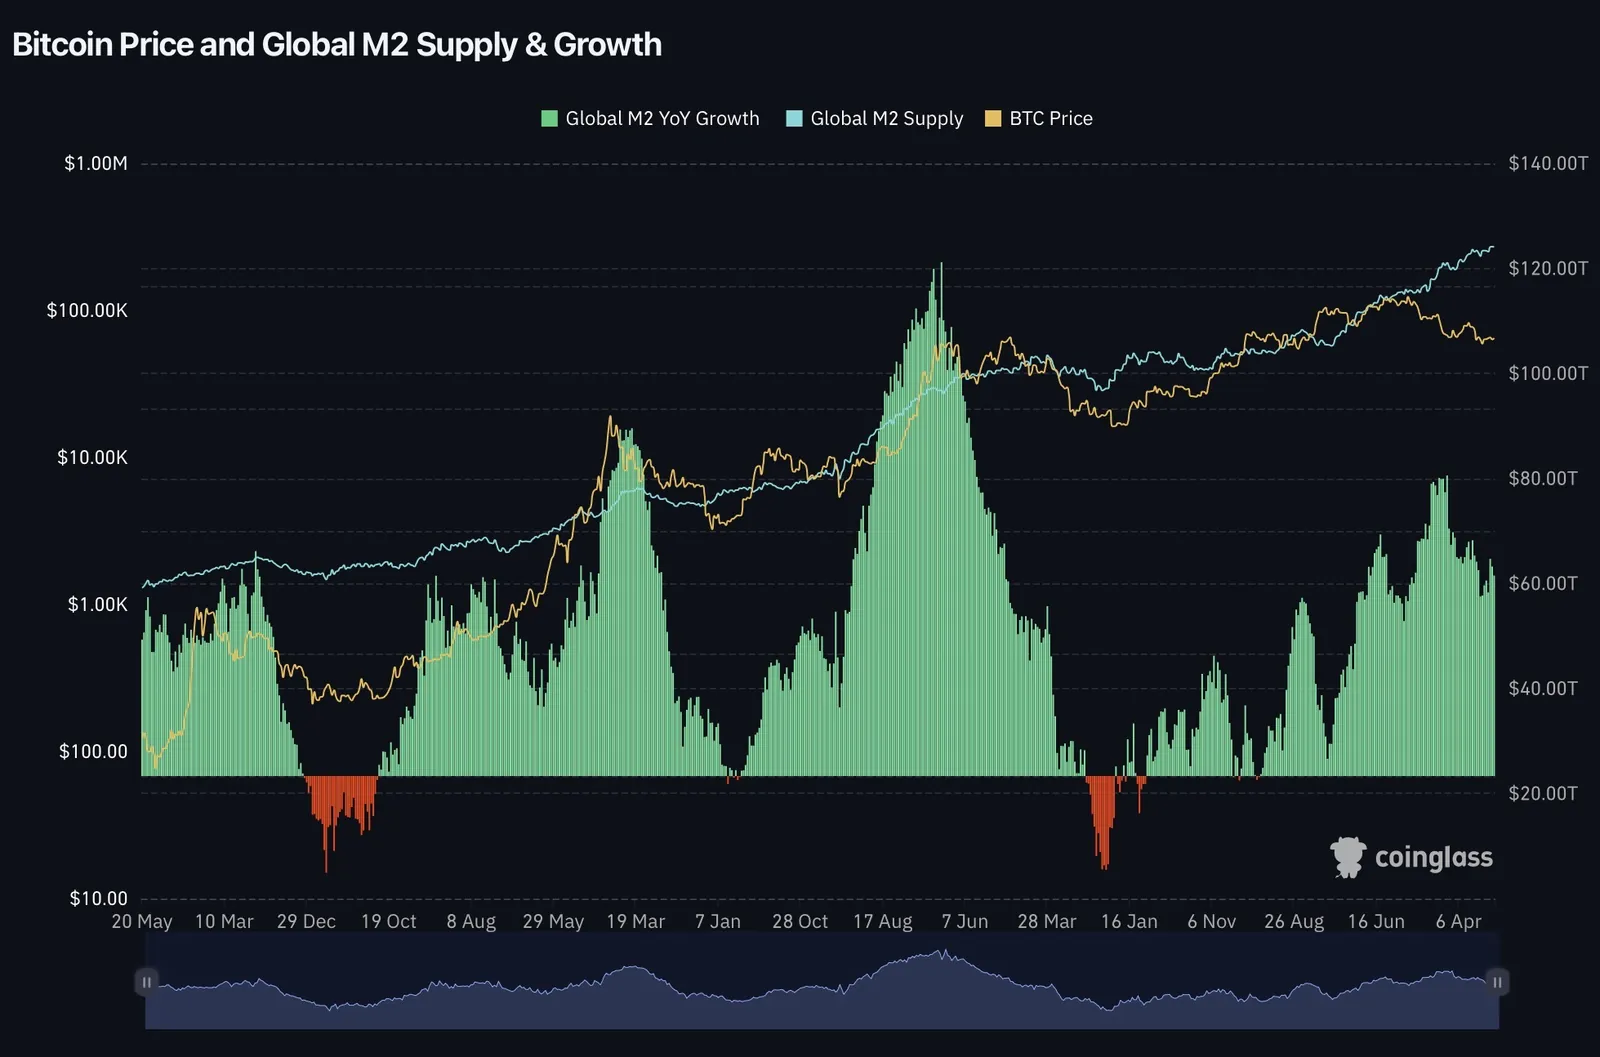
Shows how the Bitcoin Price relative to Global M2 supply and M2 growth has moved over time, offering a clear view of how Bitcoin reacts to global liquidity expansion, monetary conditions, and long‑term shifts in the worldwide money supply.
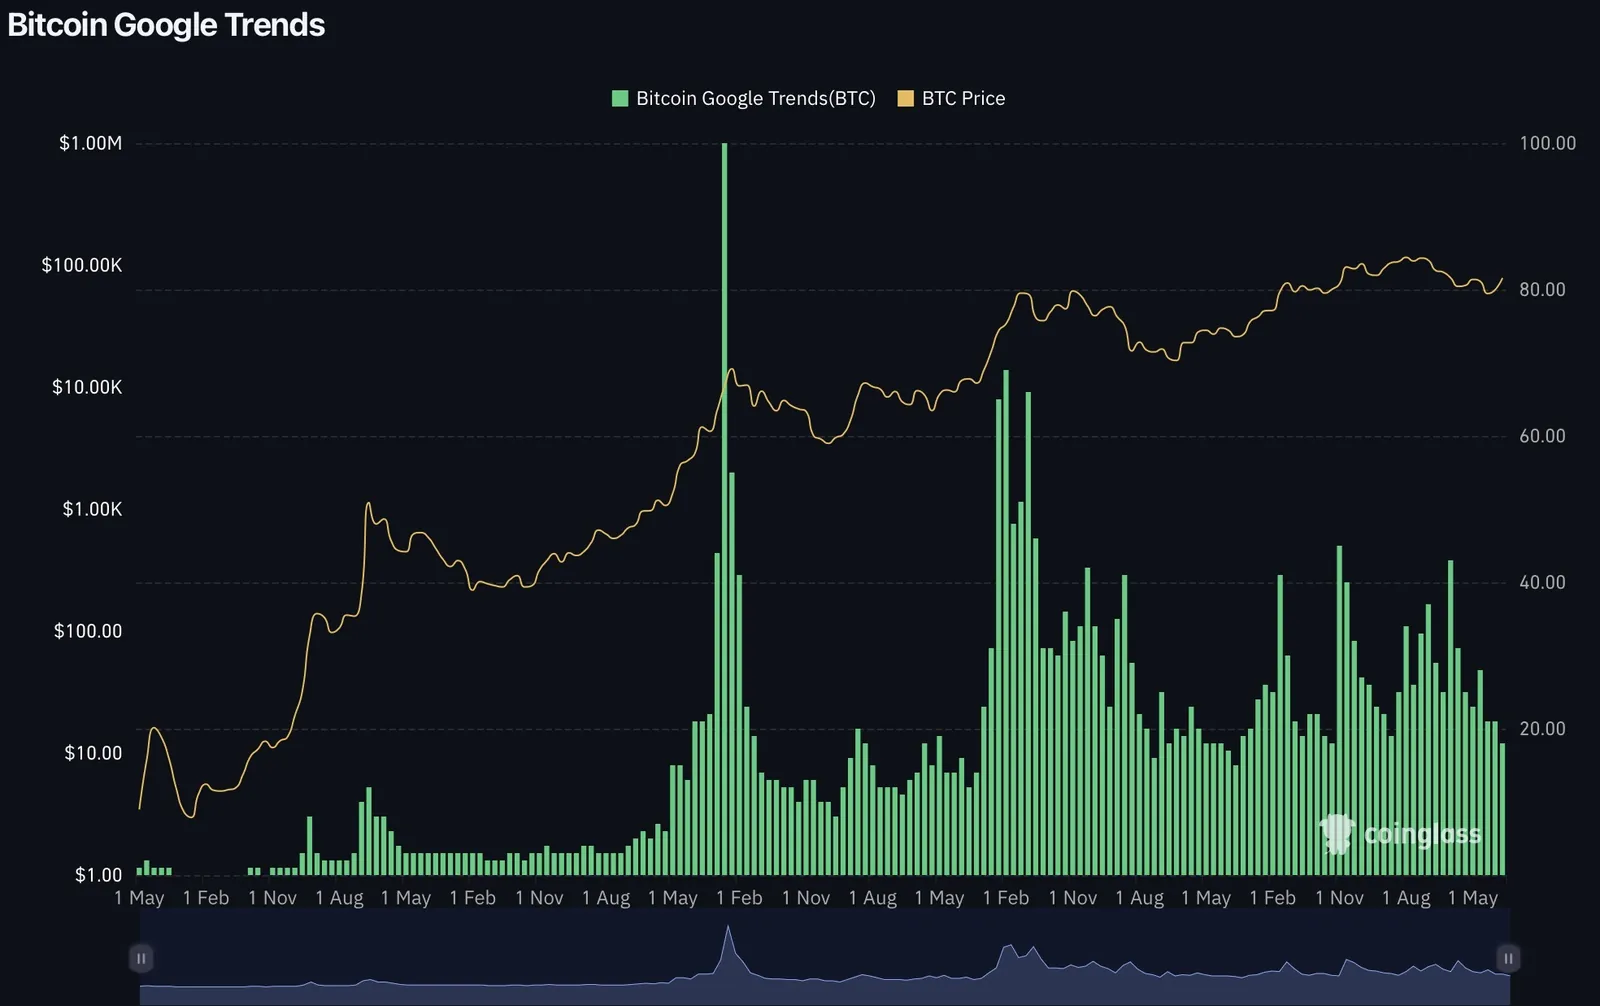
Shows how Bitcoin Google Trends, global search interest for ‘Bitcoin’, has moved over time, offering a clear view of how retail attention, narrative cycles, and macro‑driven sentiment shifts influence the public’s curiosity and engagement with Bitcoin.
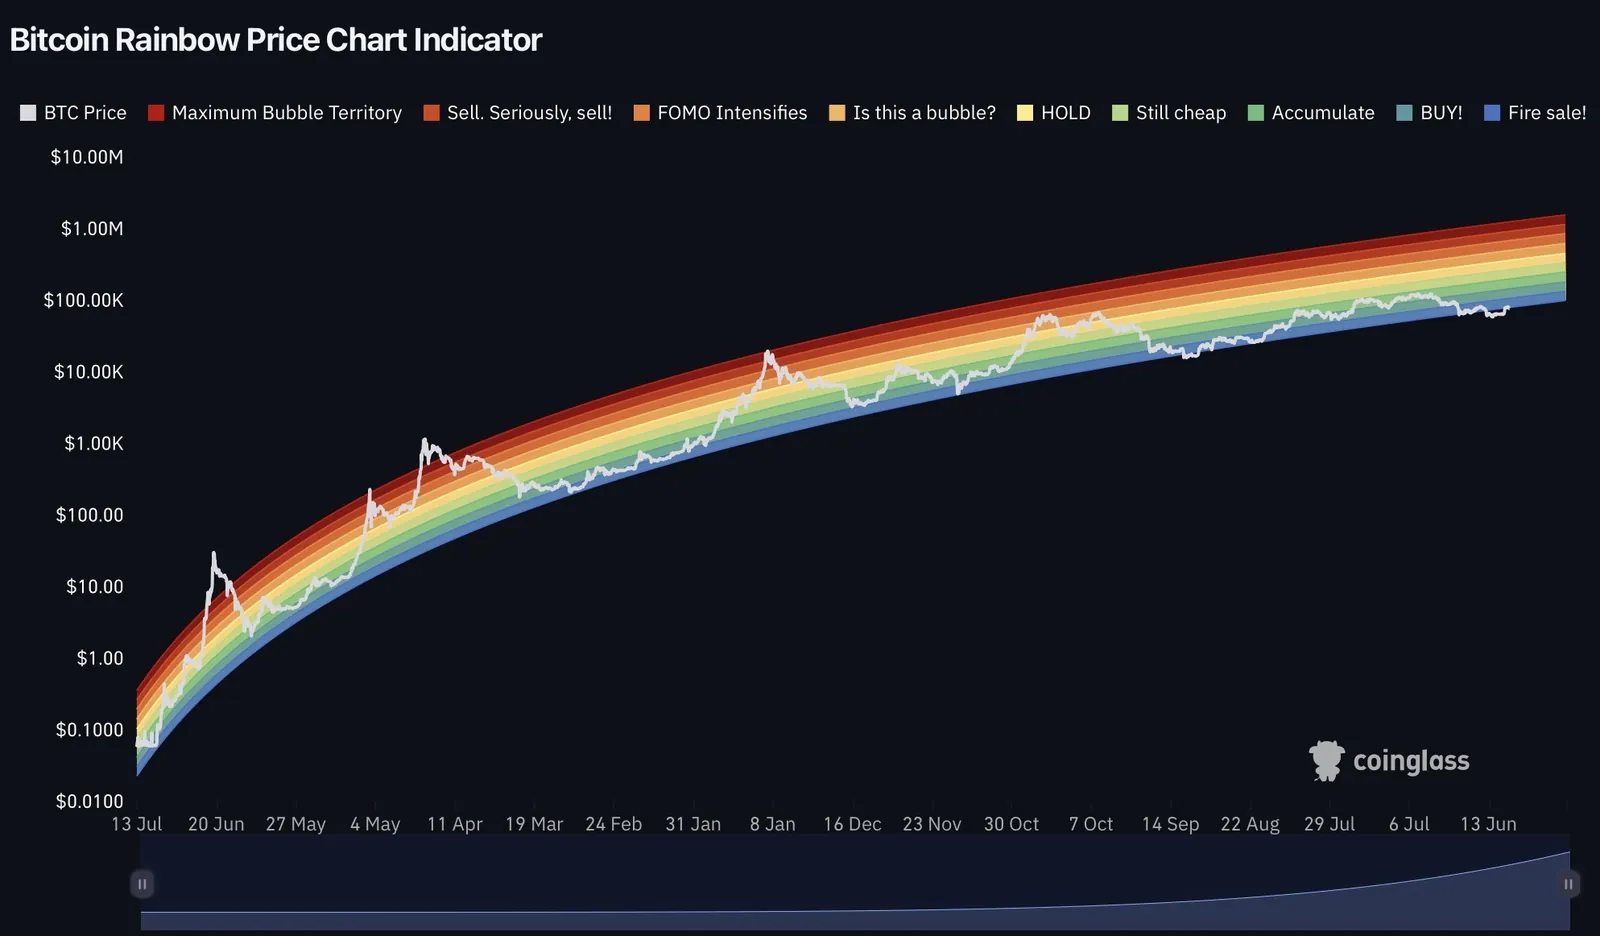
Shows how the Bitcoin Rainbow Price Chart has evolved over time, offering a clear view of Bitcoin’s long‑term logarithmic trend and how market cycles, sentiment extremes, and macro‑driven liquidity conditions interact with Bitcoin’s multi‑year growth trajectory.
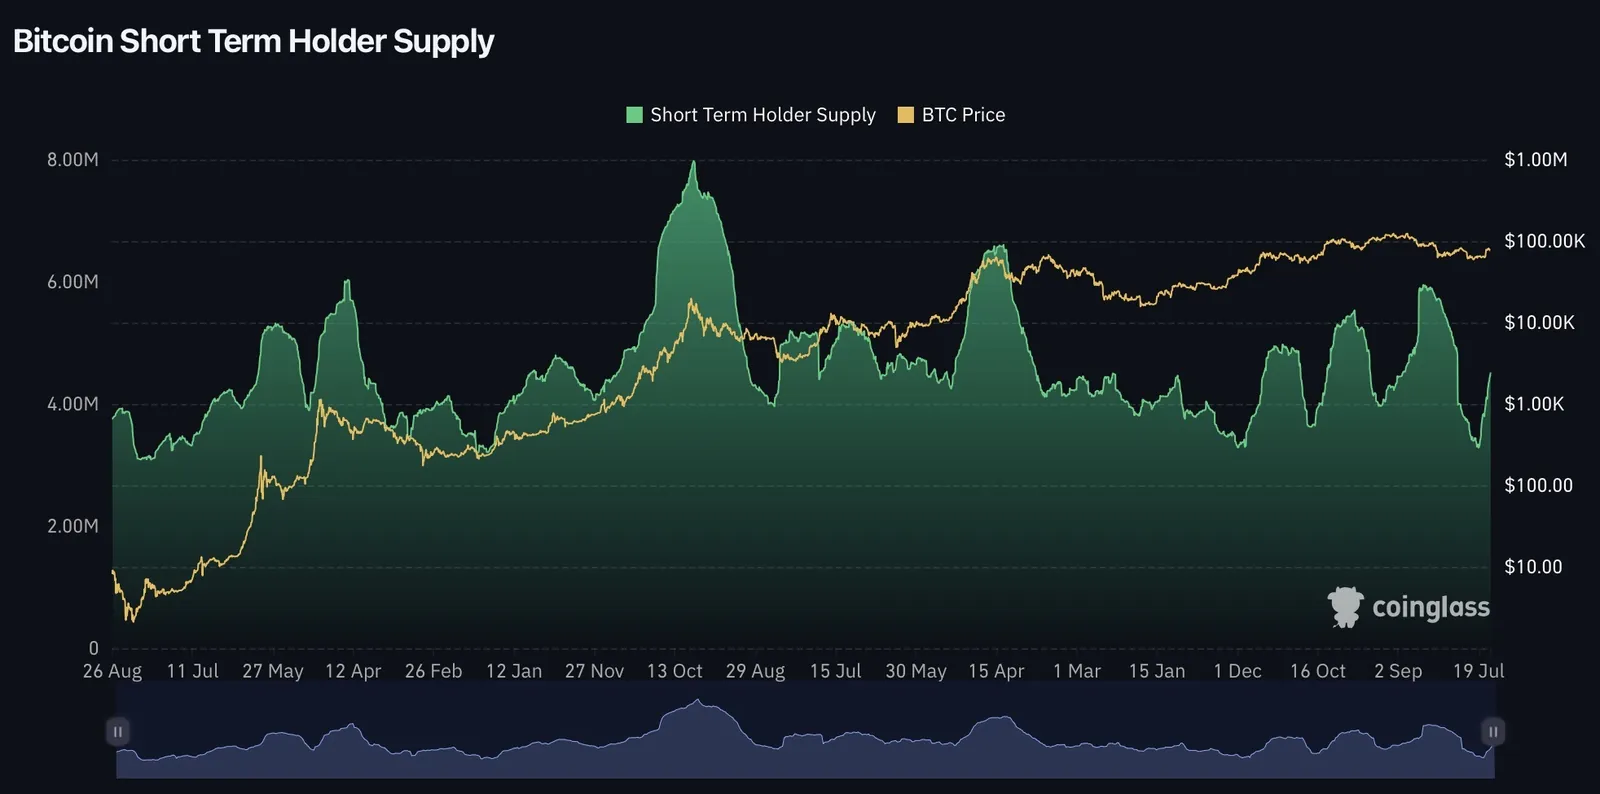
Shows how Bitcoin Short‑Term Holder Supply, the amount of BTC held by addresses with a holding period of less than ~155 days, has moved over time, offering a clear view of how speculative cohorts accumulate or distribute Bitcoin and how macro, liquidity, or monetary conditions influence short‑term conviction and market‑cycle positioning.
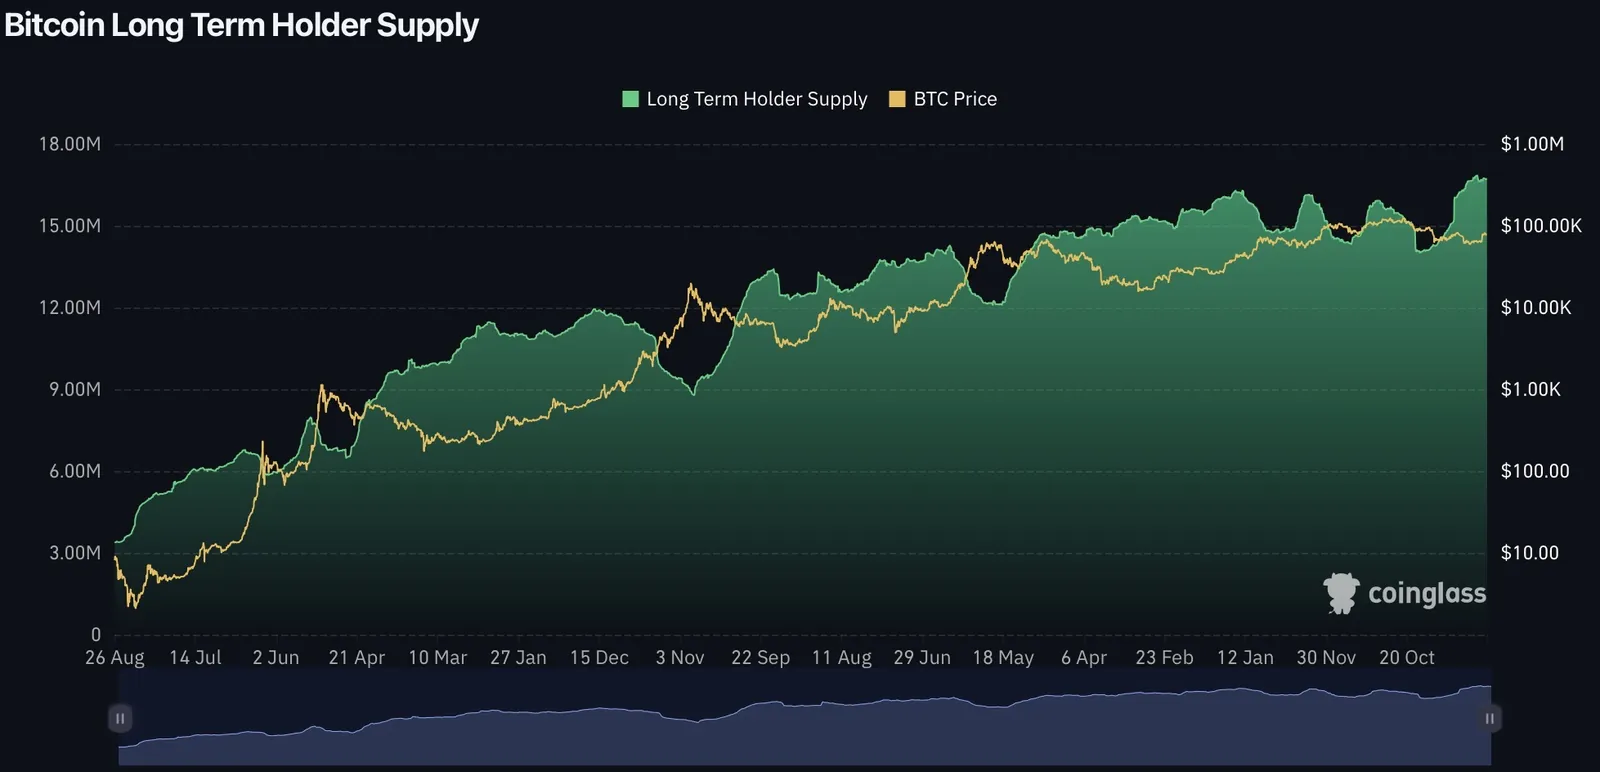
Shows how Bitcoin Long‑Term Holder Supply, the amount of BTC held by addresses with a holding period greater than ~155 days, has moved over time, offering a clear view of how high‑conviction cohorts accumulate Bitcoin, how illiquid supply grows during early‑cycle phases, and how macro, liquidity, or monetary conditions influence long‑term investor behavior across market cycles.
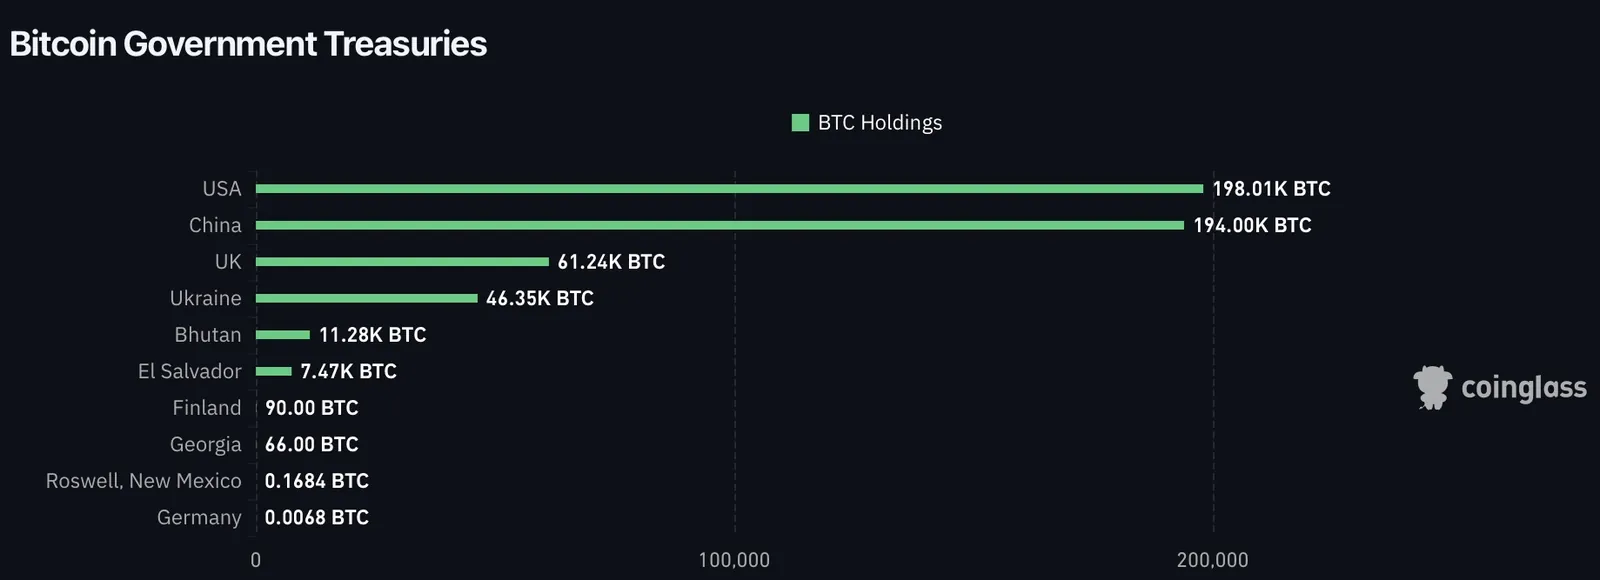
Shows how Bitcoin Government Treasuries, the amount of BTC held directly by national governments, has changed over time, offering a clear view of how sovereign entities accumulate, seize, or liquidate Bitcoin holdings and how macro, regulatory, or geopolitical conditions influence the role of Bitcoin within state‑level balance sheets.
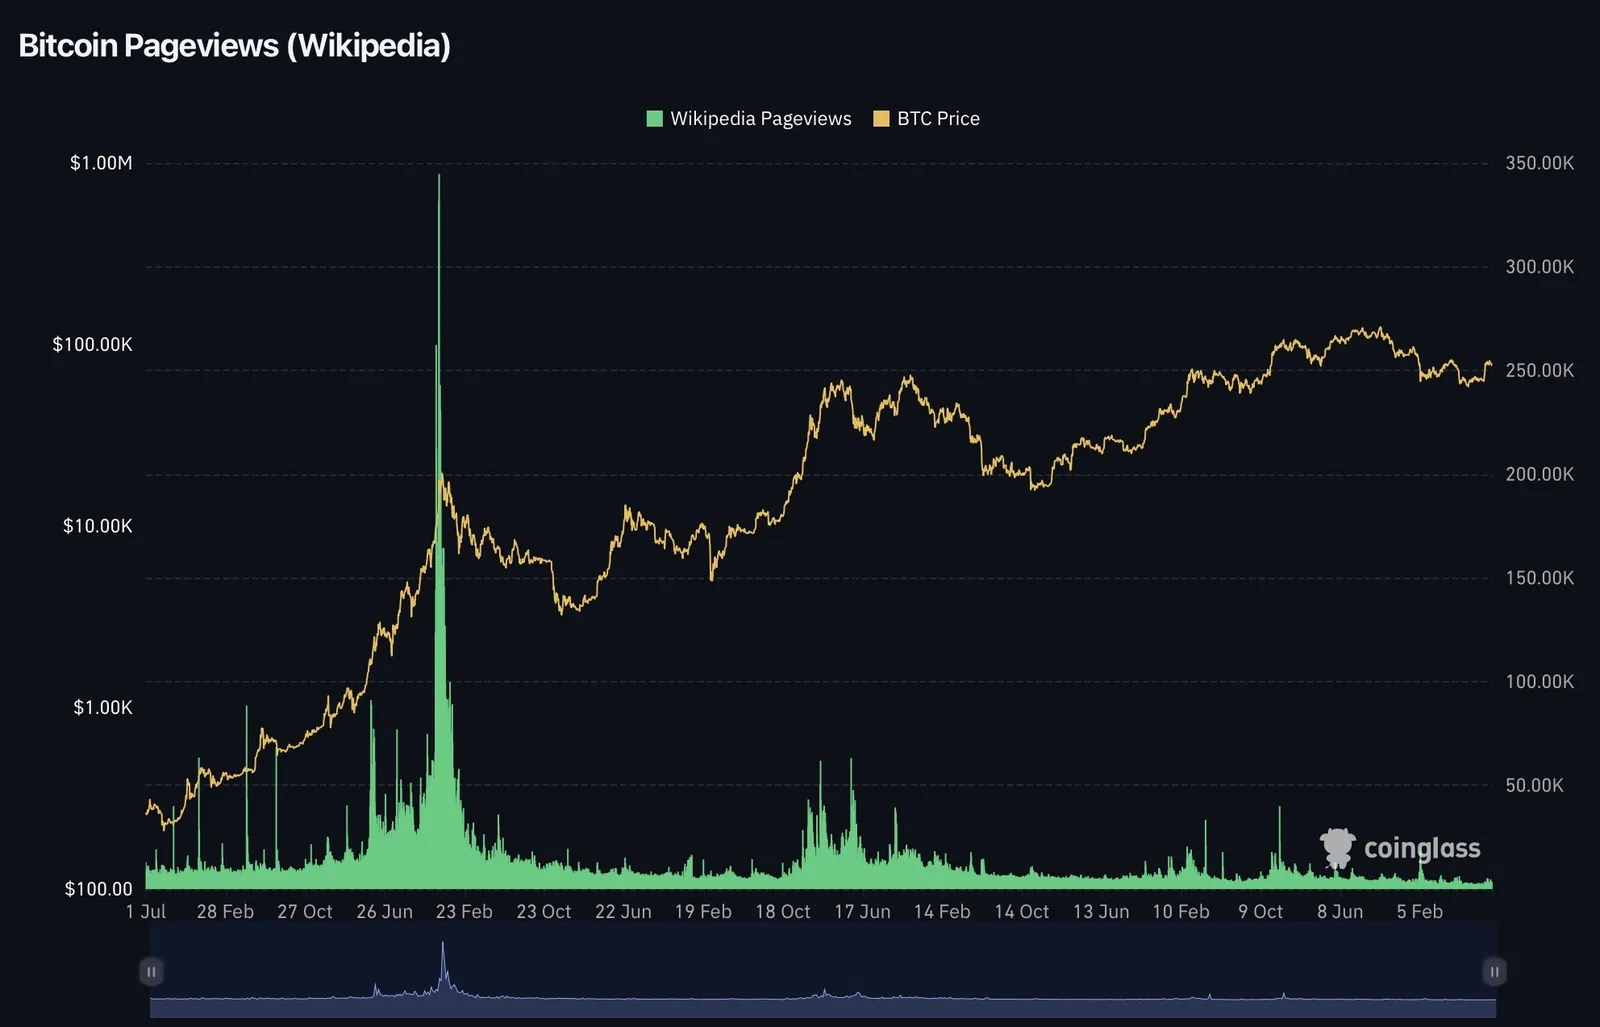
Shows how Bitcoin Wikipedia Pageviews, the number of people searching for and reading the Bitcoin article on Wikipedia, has moved over time, offering a clear view of how retail curiosity, narrative cycles, and macro‑driven sentiment shifts influence public attention toward Bitcoin.
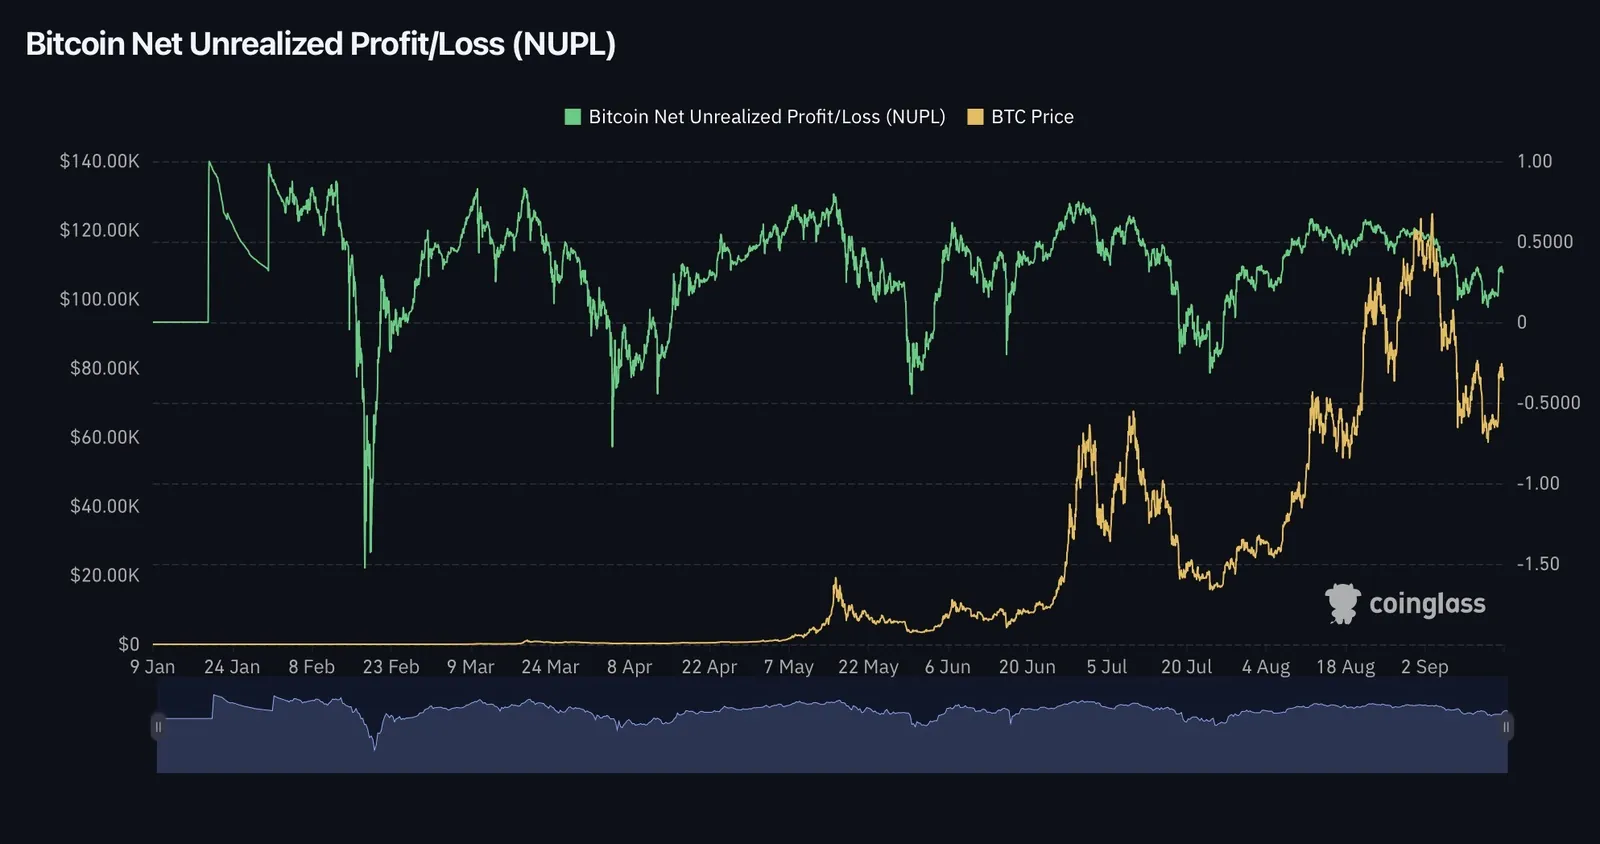
Shows how Bitcoin Net Unrealised Profit/Loss (NUPL), the on‑chain metric capturing the aggregate unrealised profit or loss of all Bitcoin holders, has moved over time, offering a clear view of how investor sentiment transitions between fear, capitulation, hope, optimism, and euphoria across market cycles, and how macro, liquidity, or monetary conditions influence the collective profitability of the Bitcoin network.
Crypto Liquidity
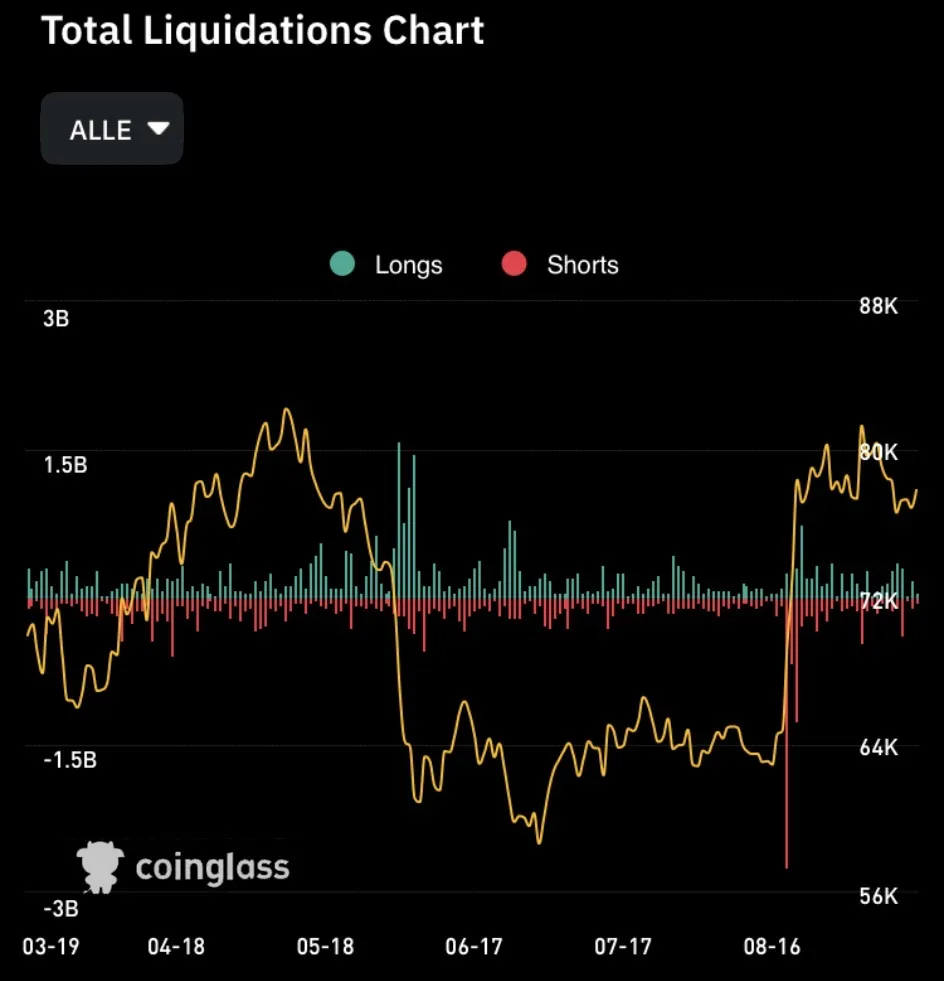
Shows how Total Liquidations, the aggregate value of forced long and short position closures across major crypto derivatives exchanges, has moved over time, offering a clear view of how leverage, volatility spikes, and macro‑driven liquidity shocks influence the scale and frequency of market‑wide deleveraging events.
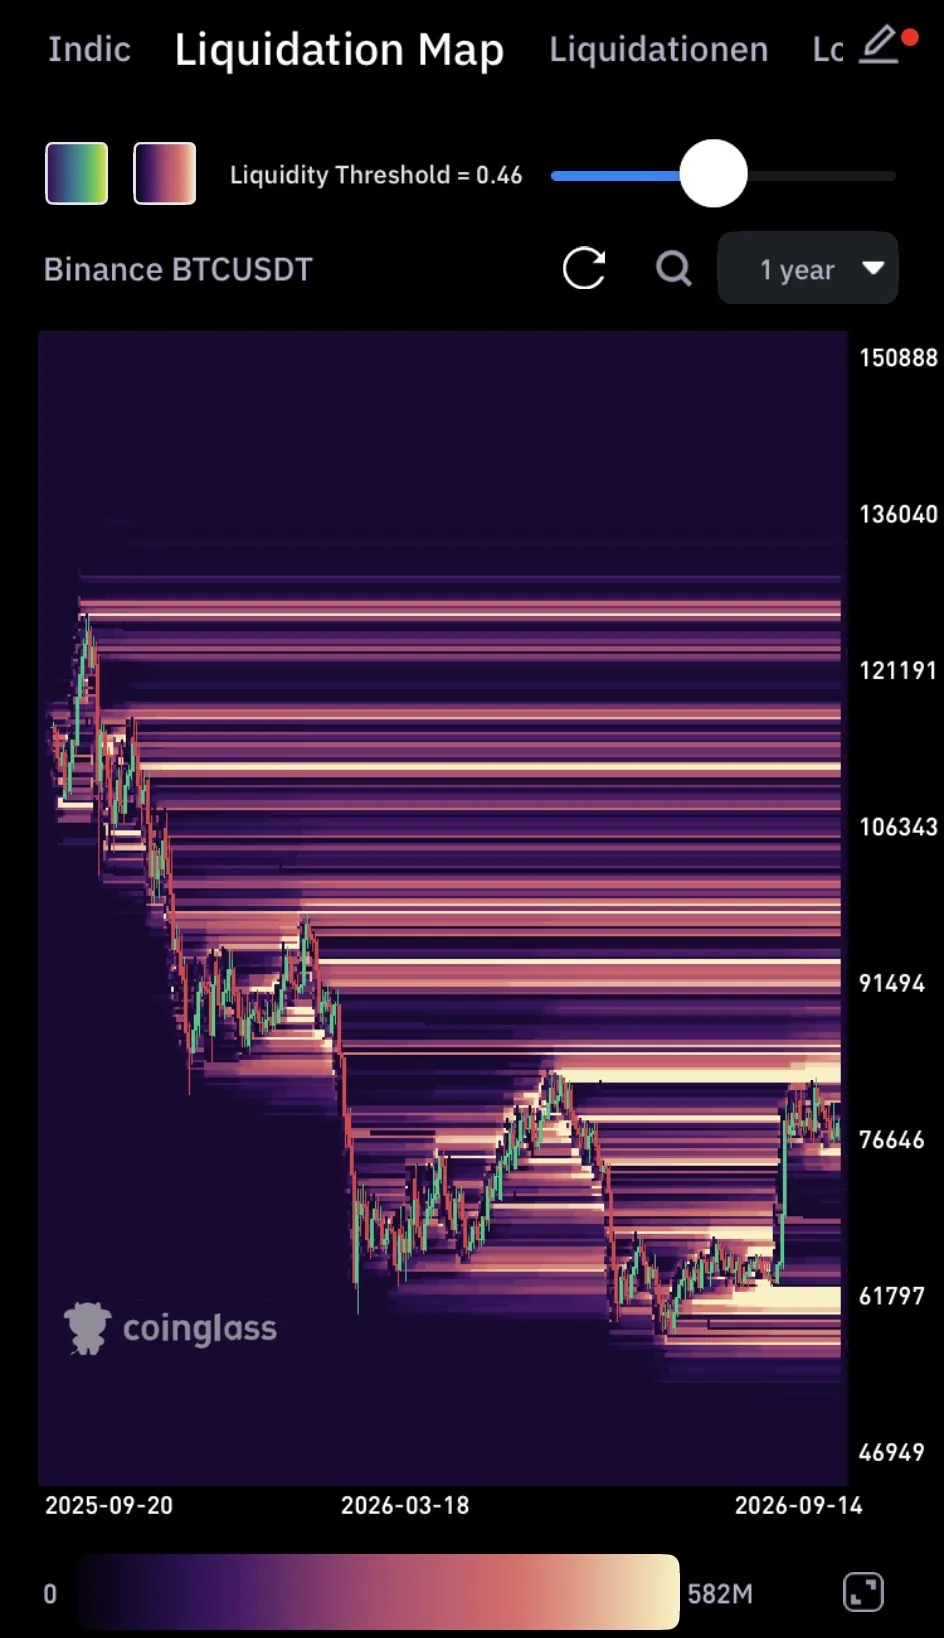
Shows how the Bitcoin Liquidation Heatmap, a visual map of clustered long and short liquidations across major crypto derivatives venues, has evolved over time, offering a clear view of where leveraged positions are concentrated, how market‑moving liquidity pockets form, and how volatility shocks interact with zones of forced buying or selling to shape short‑term price dynamics.
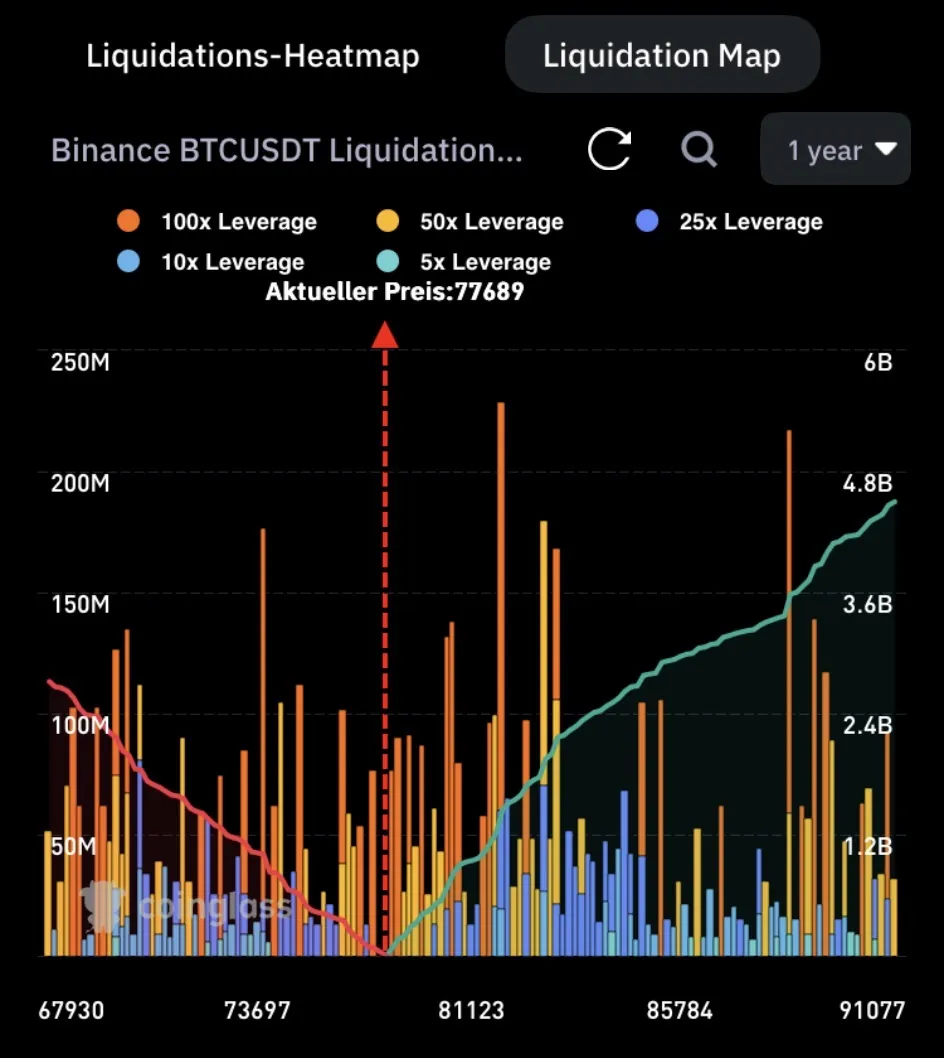
Shows how the Binance Bitcoin/USDT Liquidation Map, a visual distribution of clustered long and short liquidations specifically on Binance’s BTC/USDT perpetual futures market, has evolved over time, offering a clear view of where leveraged positions are concentrated, how liquidity pockets form, and how volatility shocks interact with zones of forced buying or selling to shape short‑term price dynamics.
Sentiment
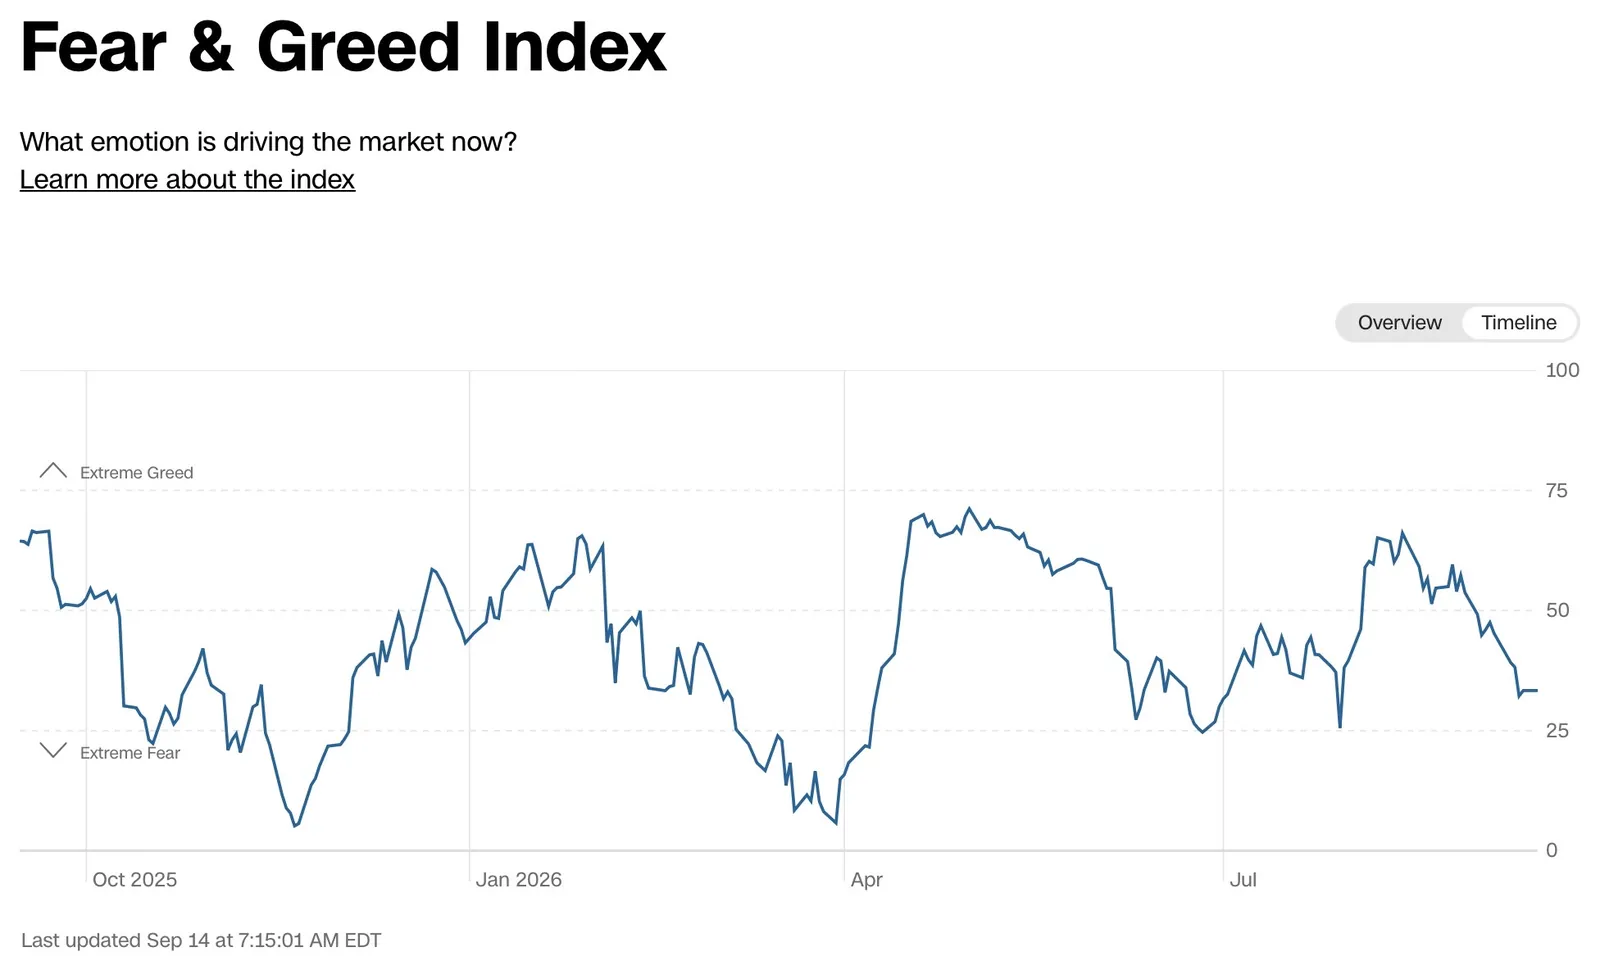
Shows how the US Market Fear and Greed Index, a composite measure of market sentiment derived from volatility, momentum, safe‑haven demand, and risk appetite, has moved over time, offering a clear view of how investor psychology oscillates between fear‑driven risk aversion and greed‑driven risk‑taking, and how macro, liquidity, or monetary conditions shape these sentiment cycles across US equities.
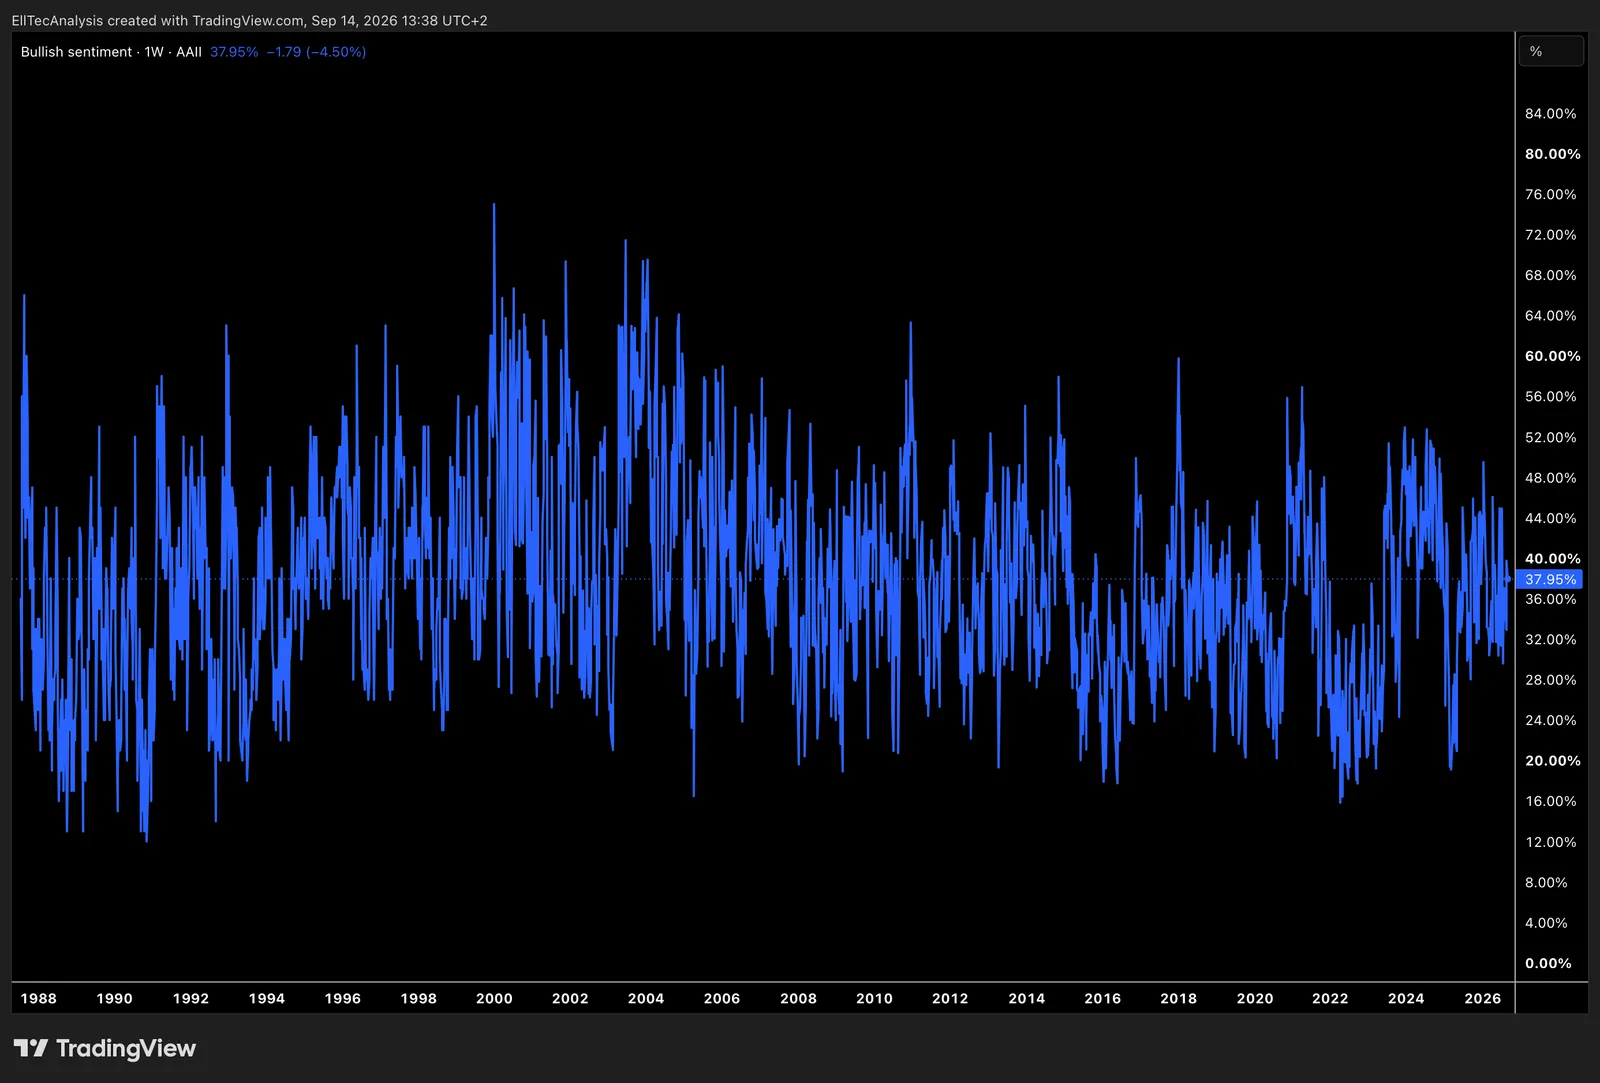
Shows how US Market Bullish Sentiment, typically measured through surveys like AAII Bullish Sentiment, options‑market positioning, and equity‑market breadth, has moved over time, offering a clear view of how investor optimism expands and contracts across macro cycles, liquidity regimes, and risk‑appetite shifts within US equities.
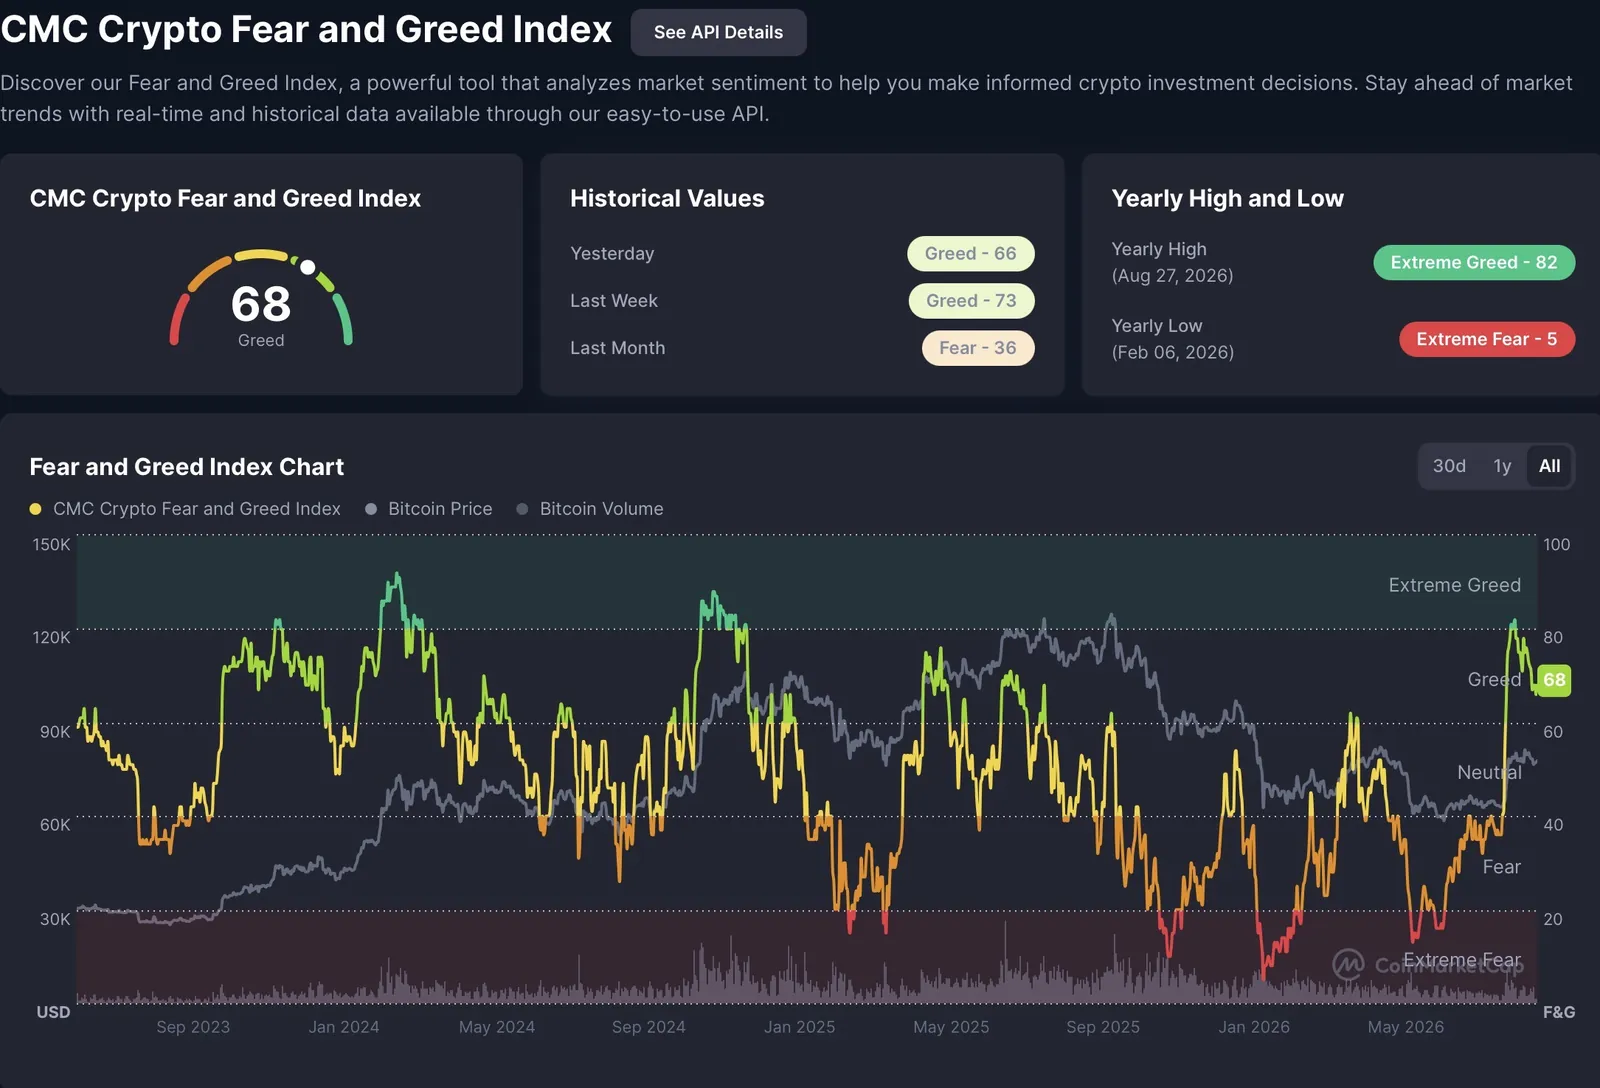
Shows how the Crypto Fear and Greed Index, a composite sentiment gauge built from volatility, market momentum, social trends, dominance shifts, and trading behavior, has moved over time, offering a clear view of how retail psychology oscillates between fear‑driven risk aversion and greed‑driven risk‑taking across crypto market cycles, liquidity regimes, and macro conditions.
Equity Options
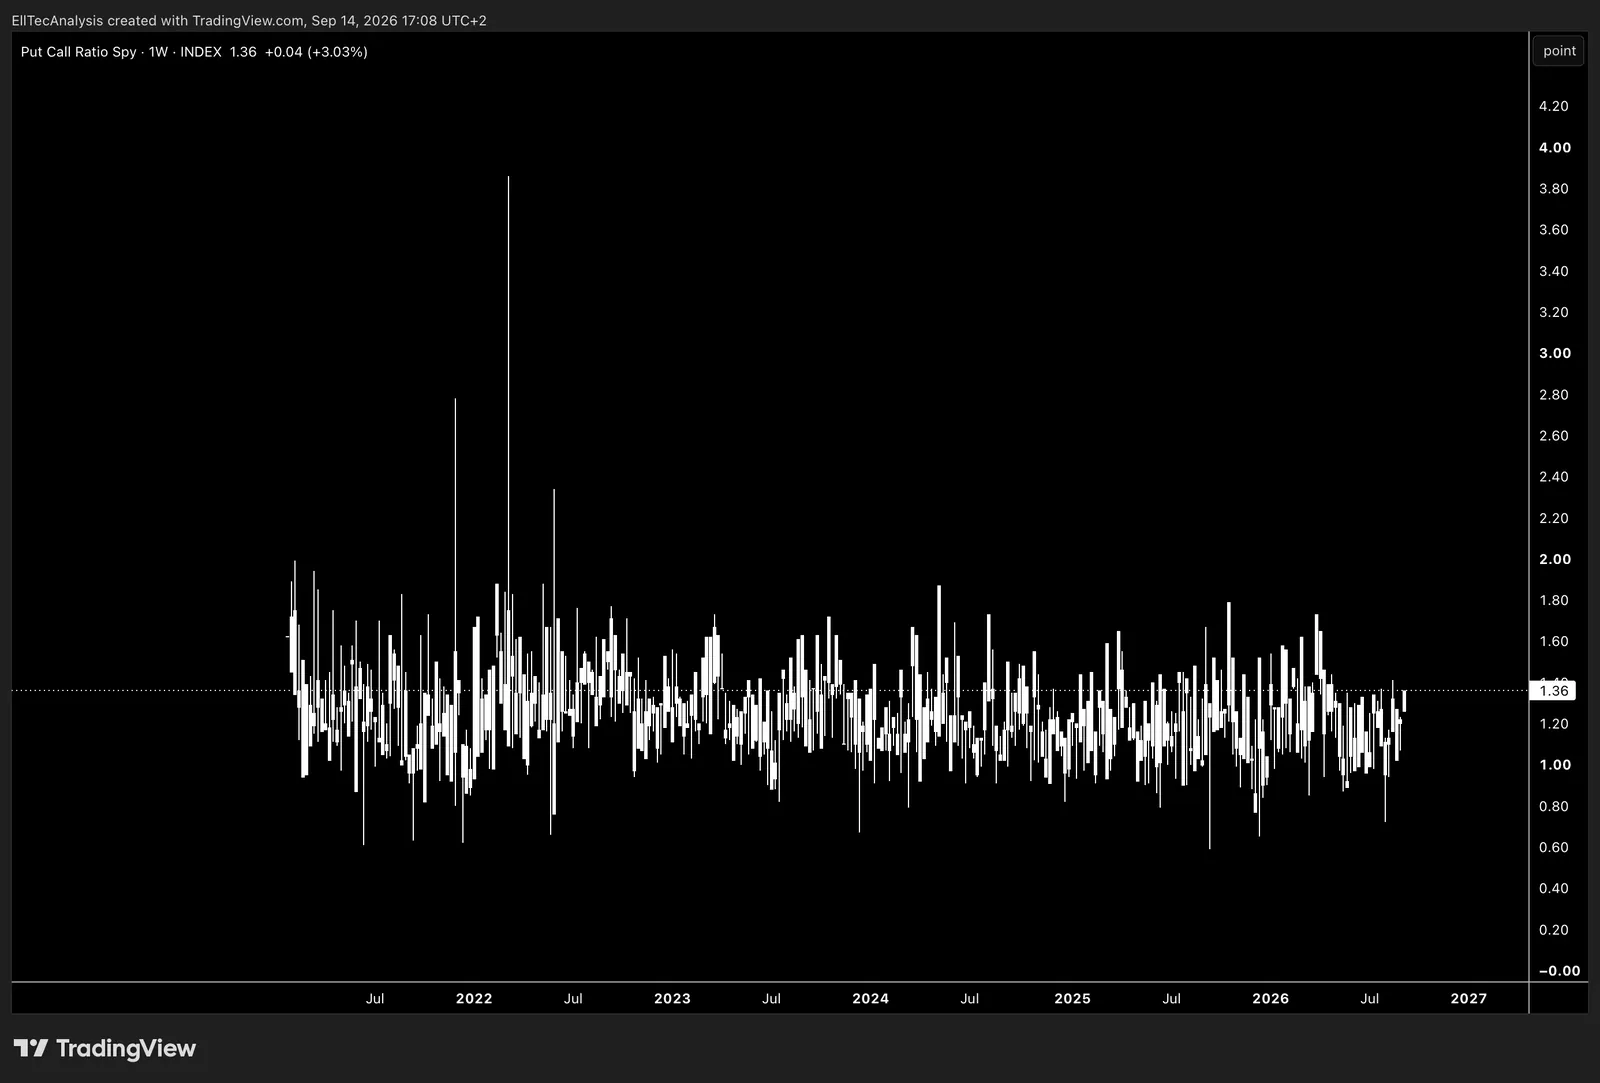
Shows how the SPY Put/Call Ratio, the relative volume of put options versus call options traded on the S&P 500 ETF, has moved over time, offering a clear view of how market participants shift between downside protection and upside speculation, and how macro conditions, liquidity regimes, and volatility cycles influence risk appetite across US equities.
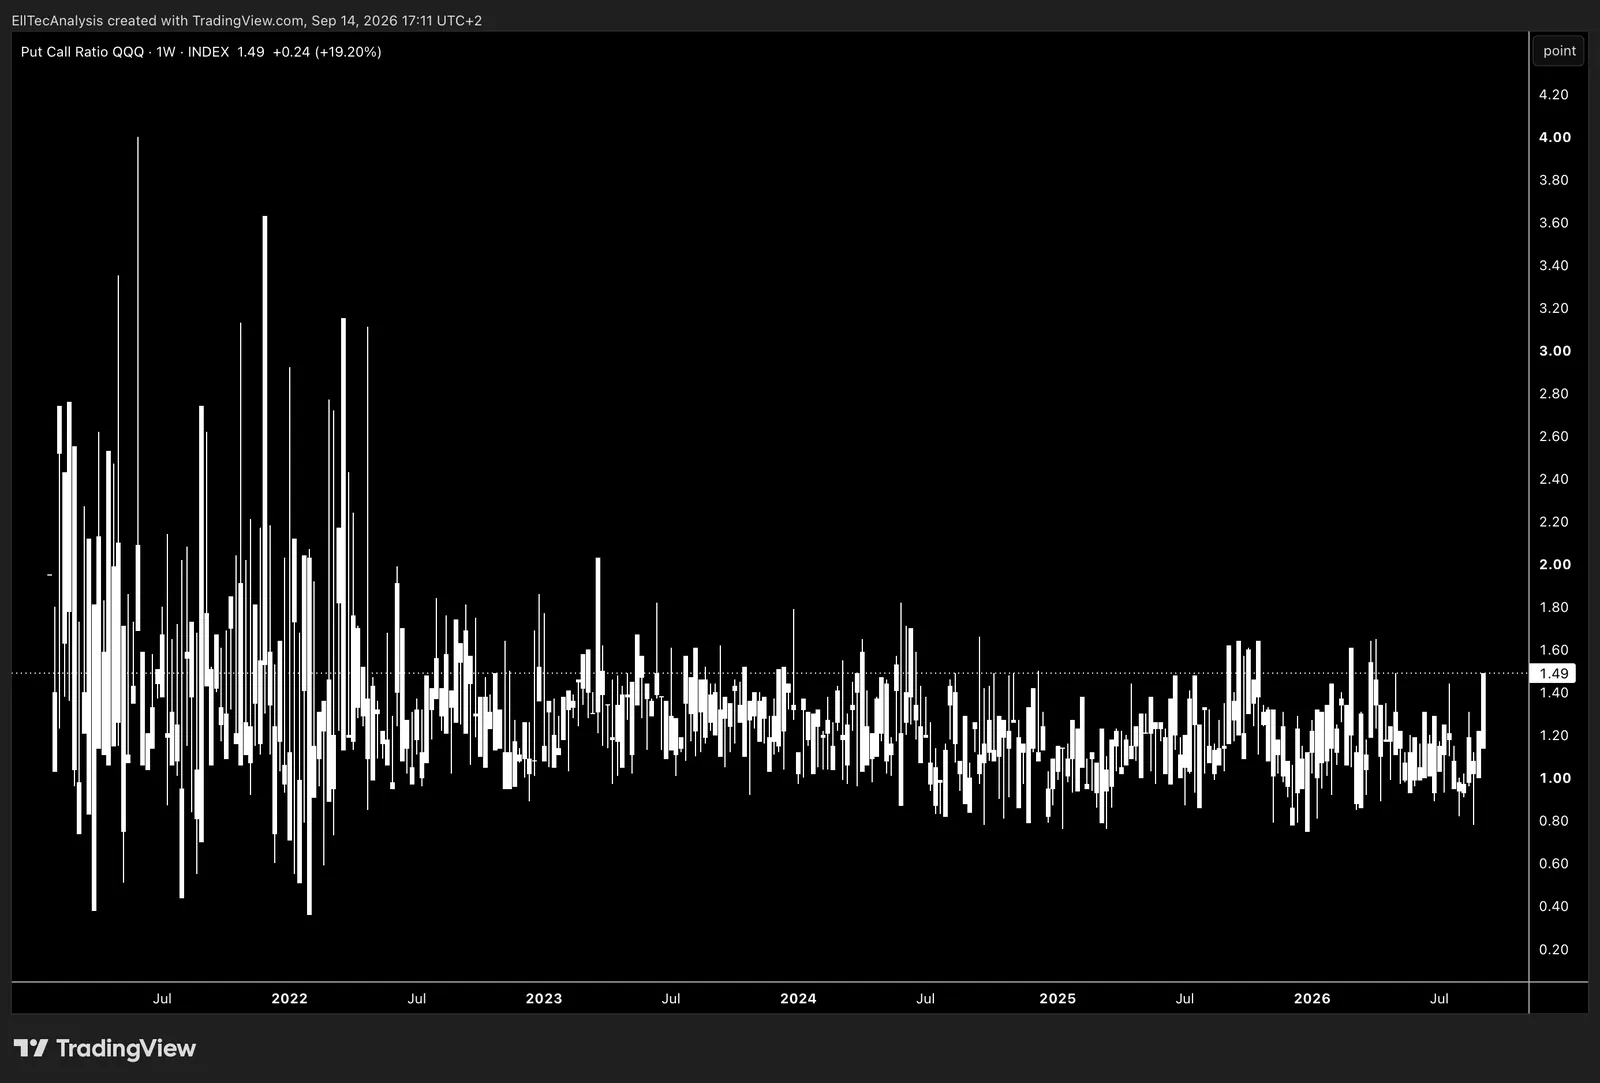
Shows how the QQQ Put/Call Ratio, the relative volume of put options versus call options traded on the Nasdaq‑100 ETF, has moved over time, offering a clear view of how tech‑sector participants shift between downside protection and upside speculation, and how macro conditions, liquidity regimes, and volatility cycles influence risk appetite across US growth equities.
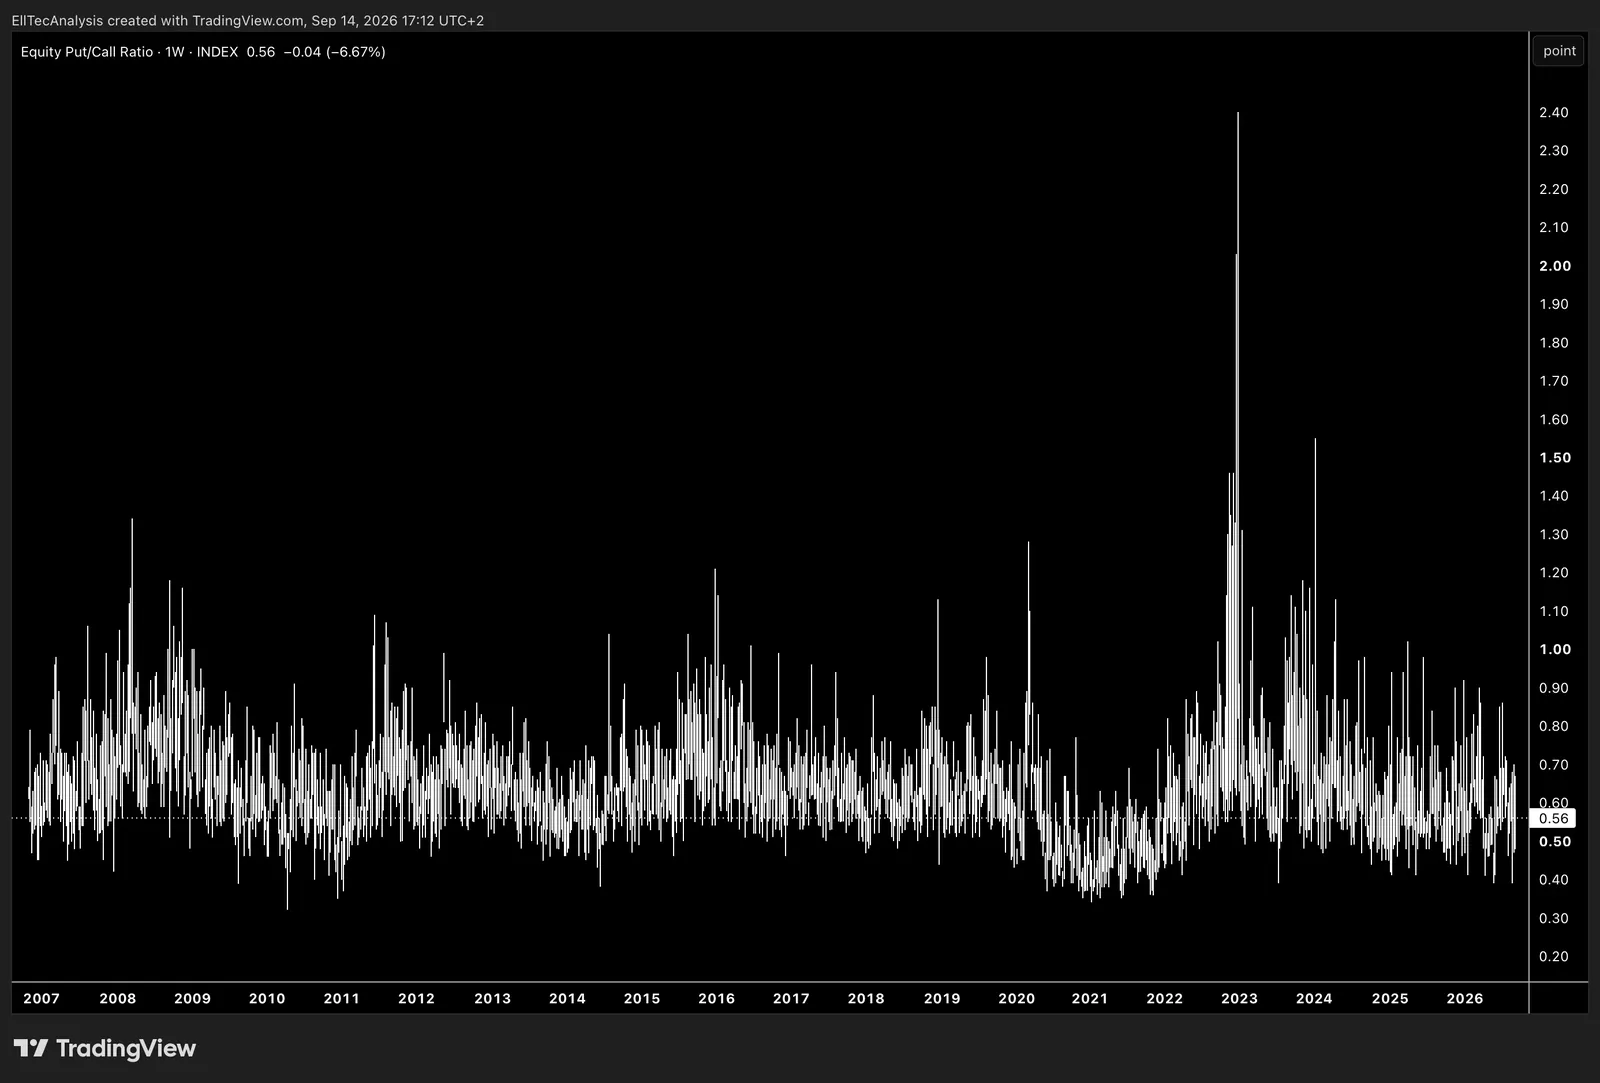
Shows how the Equity Put/Call Ratio, the ratio of single‑stock put option volume to call option volume, has moved over time, offering a clear view of how speculative equity traders shift between downside protection and upside speculation, and how macro conditions, liquidity regimes, and volatility cycles influence fear‑driven hedging versus greed‑driven call‑chasing within the U.S. stock market
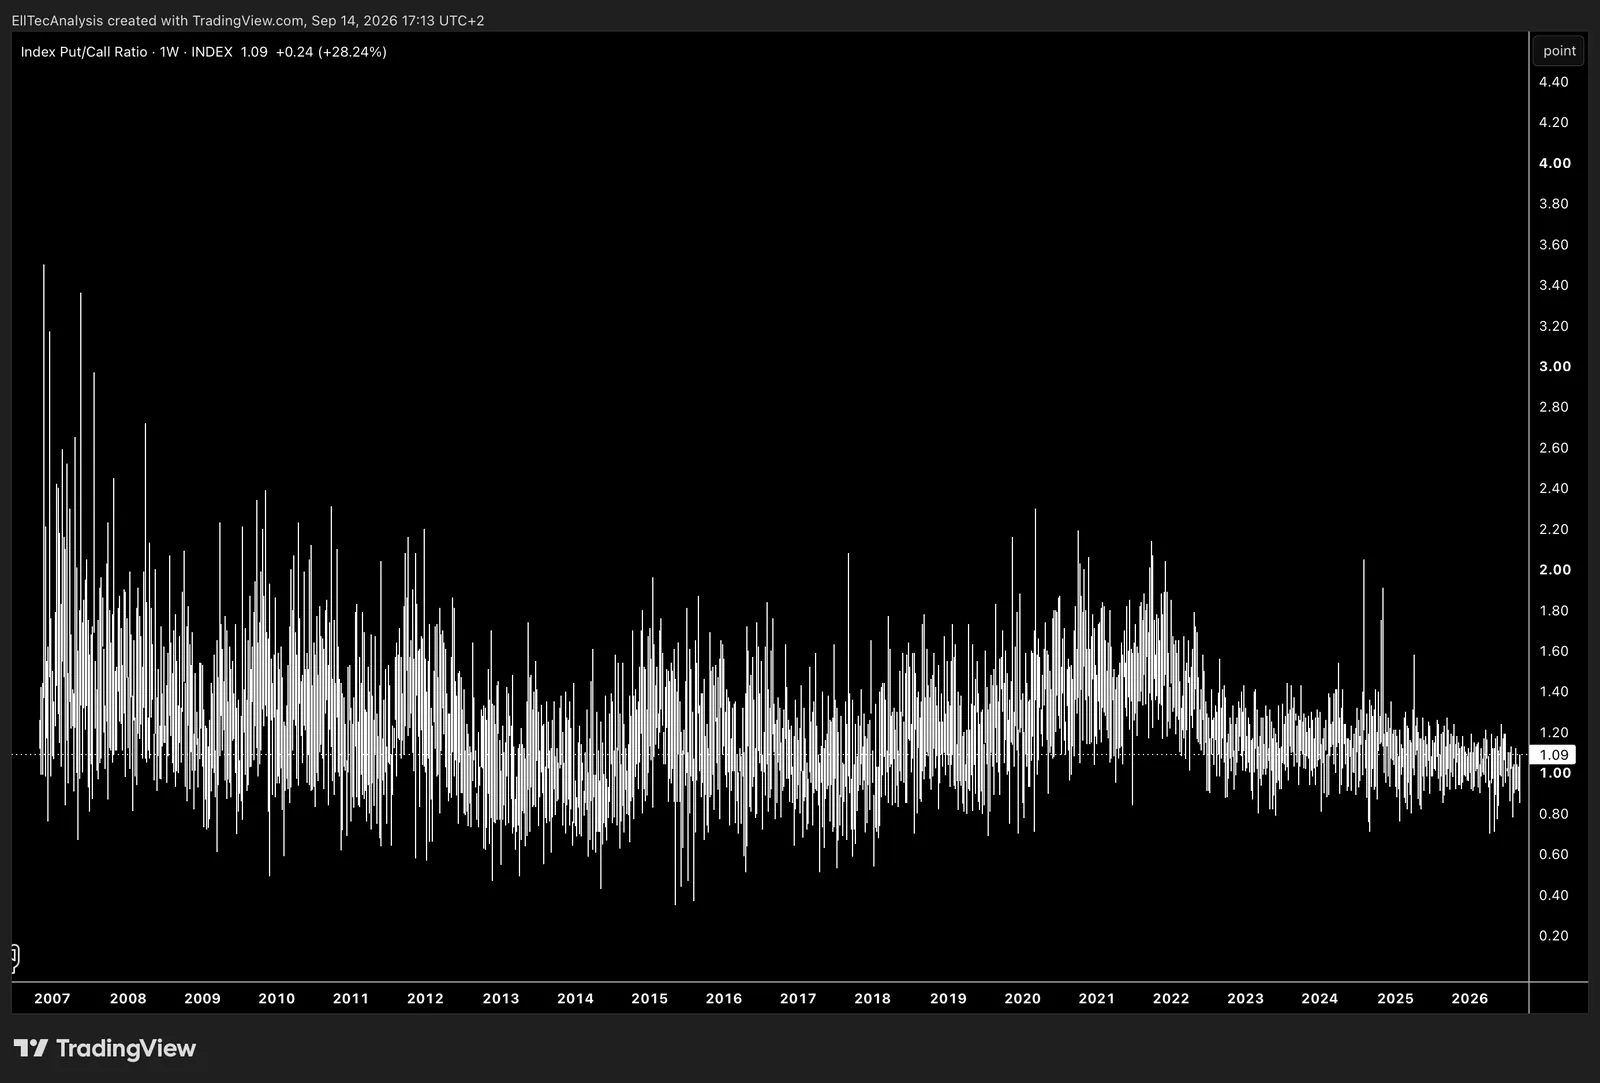
Shows how the Index Put/Call Ratio, the ratio of put‑option volume to call‑option volume across major U.S. equity indices like the S&P 500, Nasdaq‑100, and Dow Jones, has moved over time, offering a clear view of how institutional hedging demand, macro‑driven risk aversion, and volatility cycles shape defensive positioning within broad market index options.
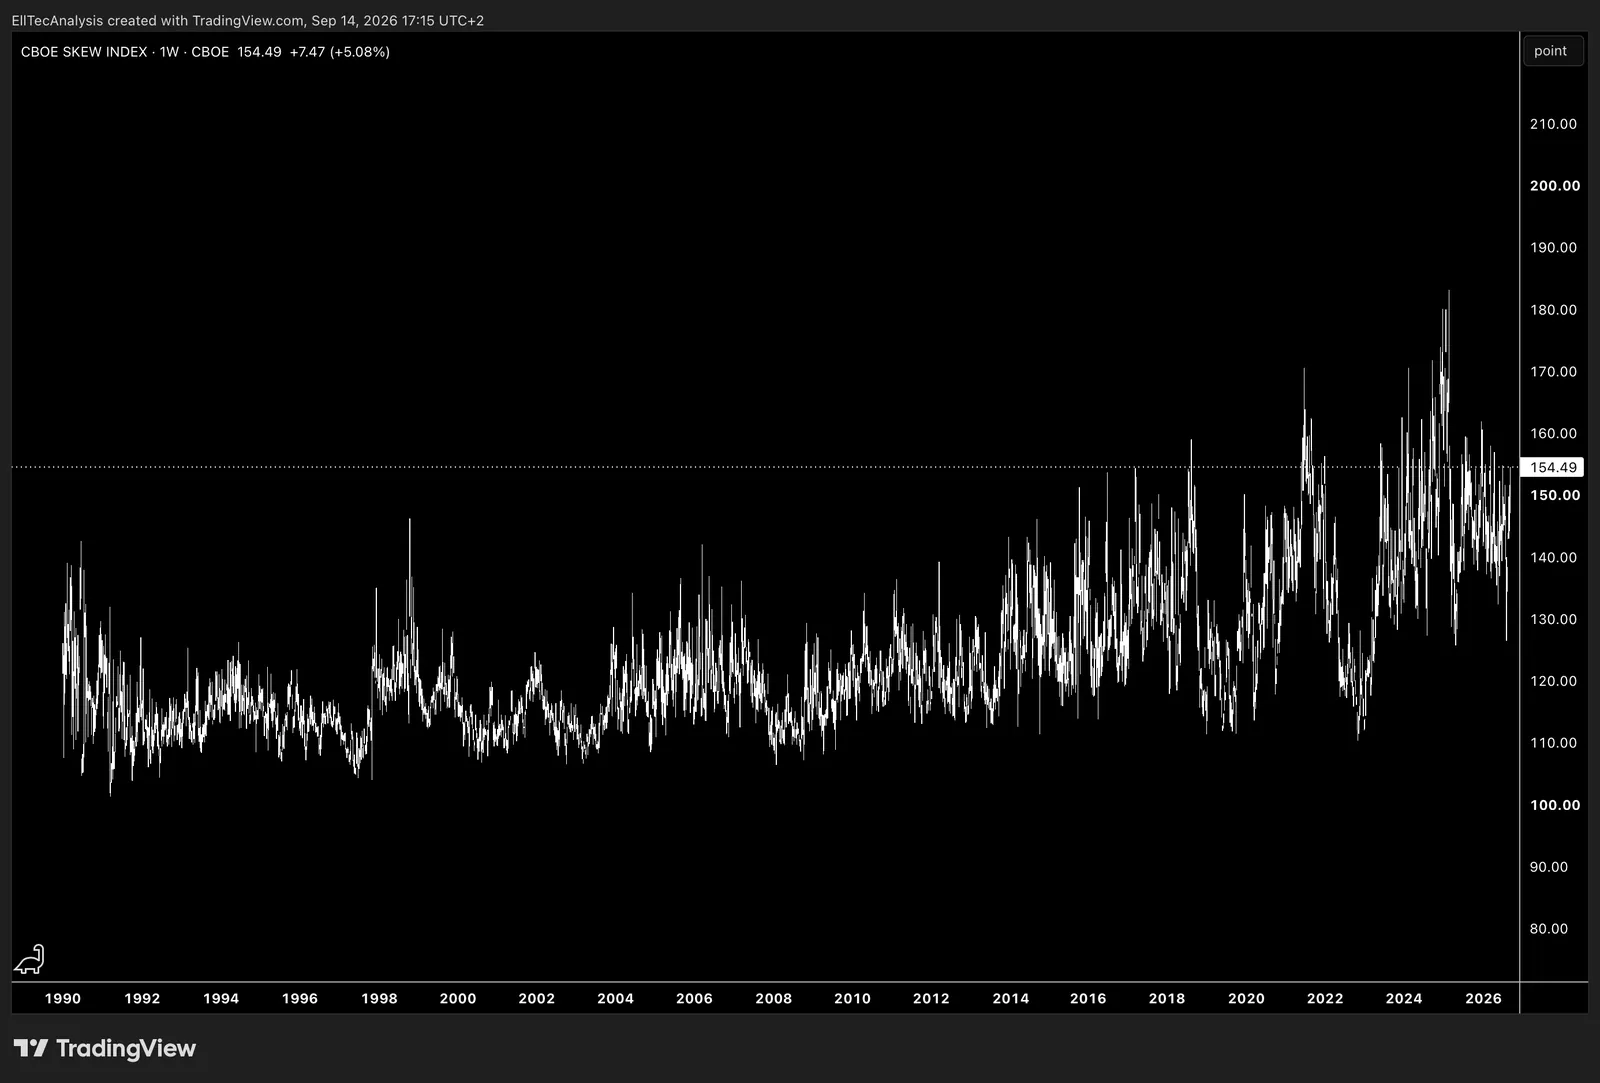
Shows how the CBOE Skew Index, a measure of how much investors are willing to pay for out‑of‑the‑money S&P 500 put options relative to standard at‑the‑money volatility, has moved over time, offering a clear view of how tail‑risk hedging demand rises and falls, how institutions price crash risk, and how macro, liquidity, or volatility regimes influence the market’s perception of extreme downside events.
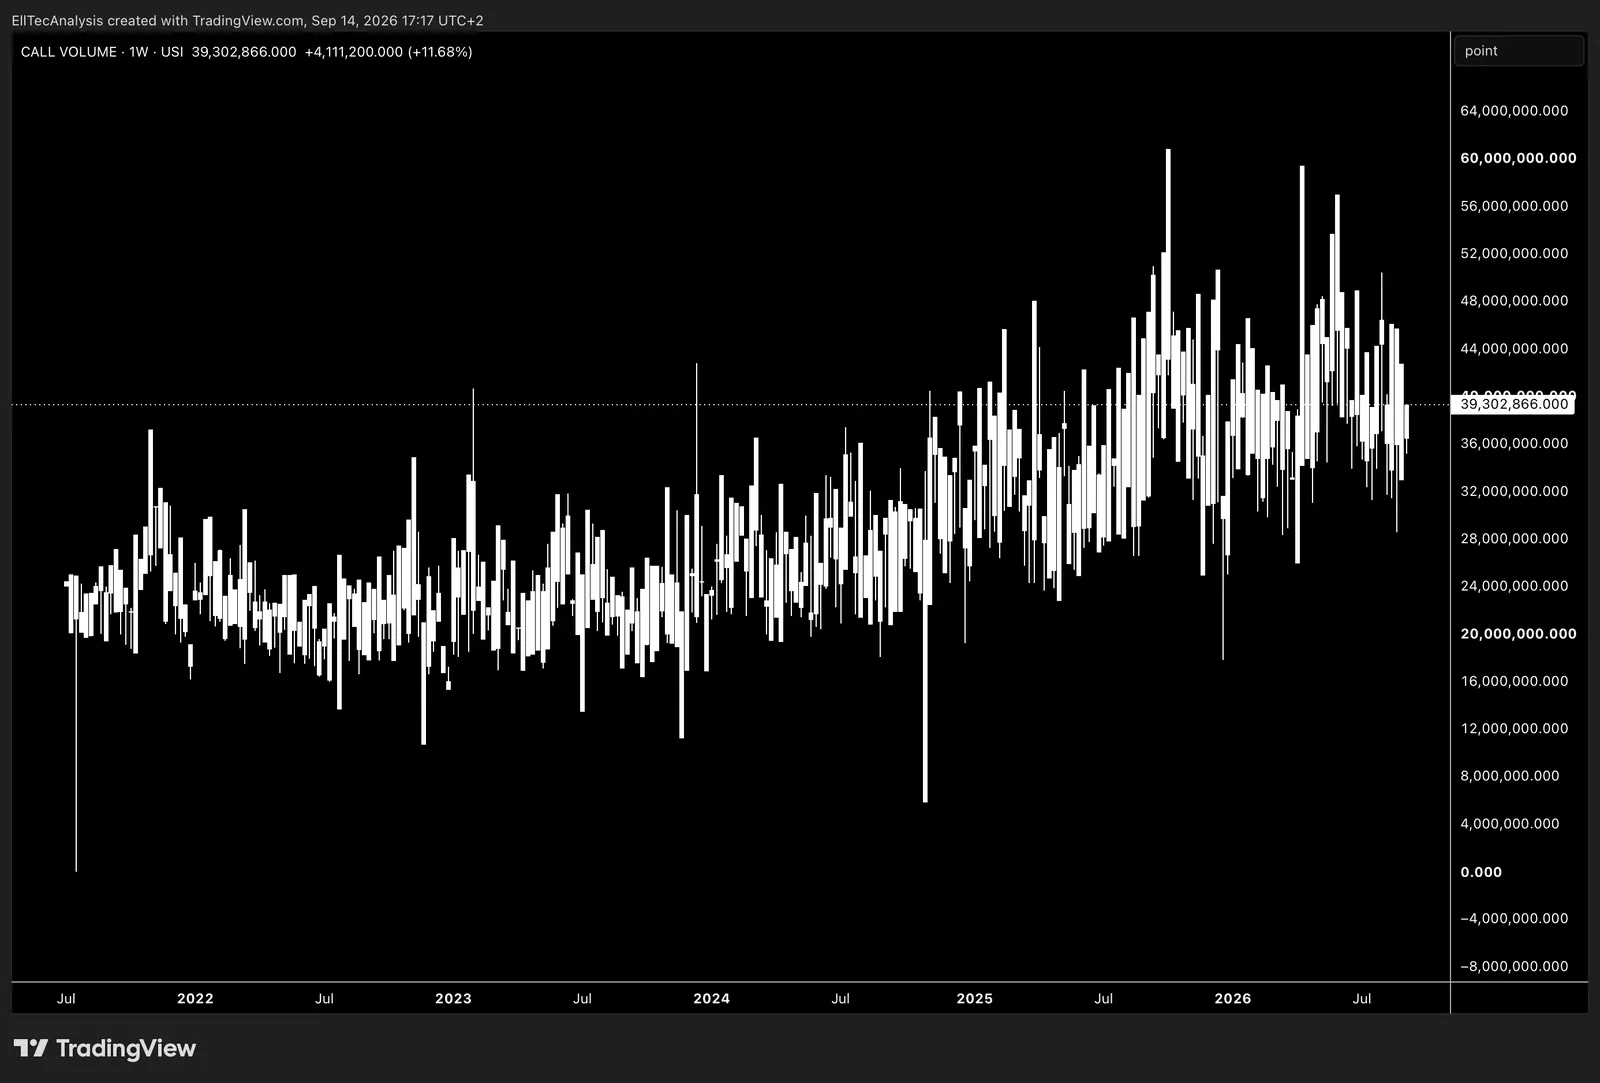
Shows how Call Volume, the total number of call‑option contracts traded across equities, indices, or ETFs, has moved over time, offering a clear view of how traders shift toward upside speculation, momentum chasing, and risk‑on positioning, and how macro conditions, liquidity regimes, and volatility cycles influence demand for leveraged bullish exposure.
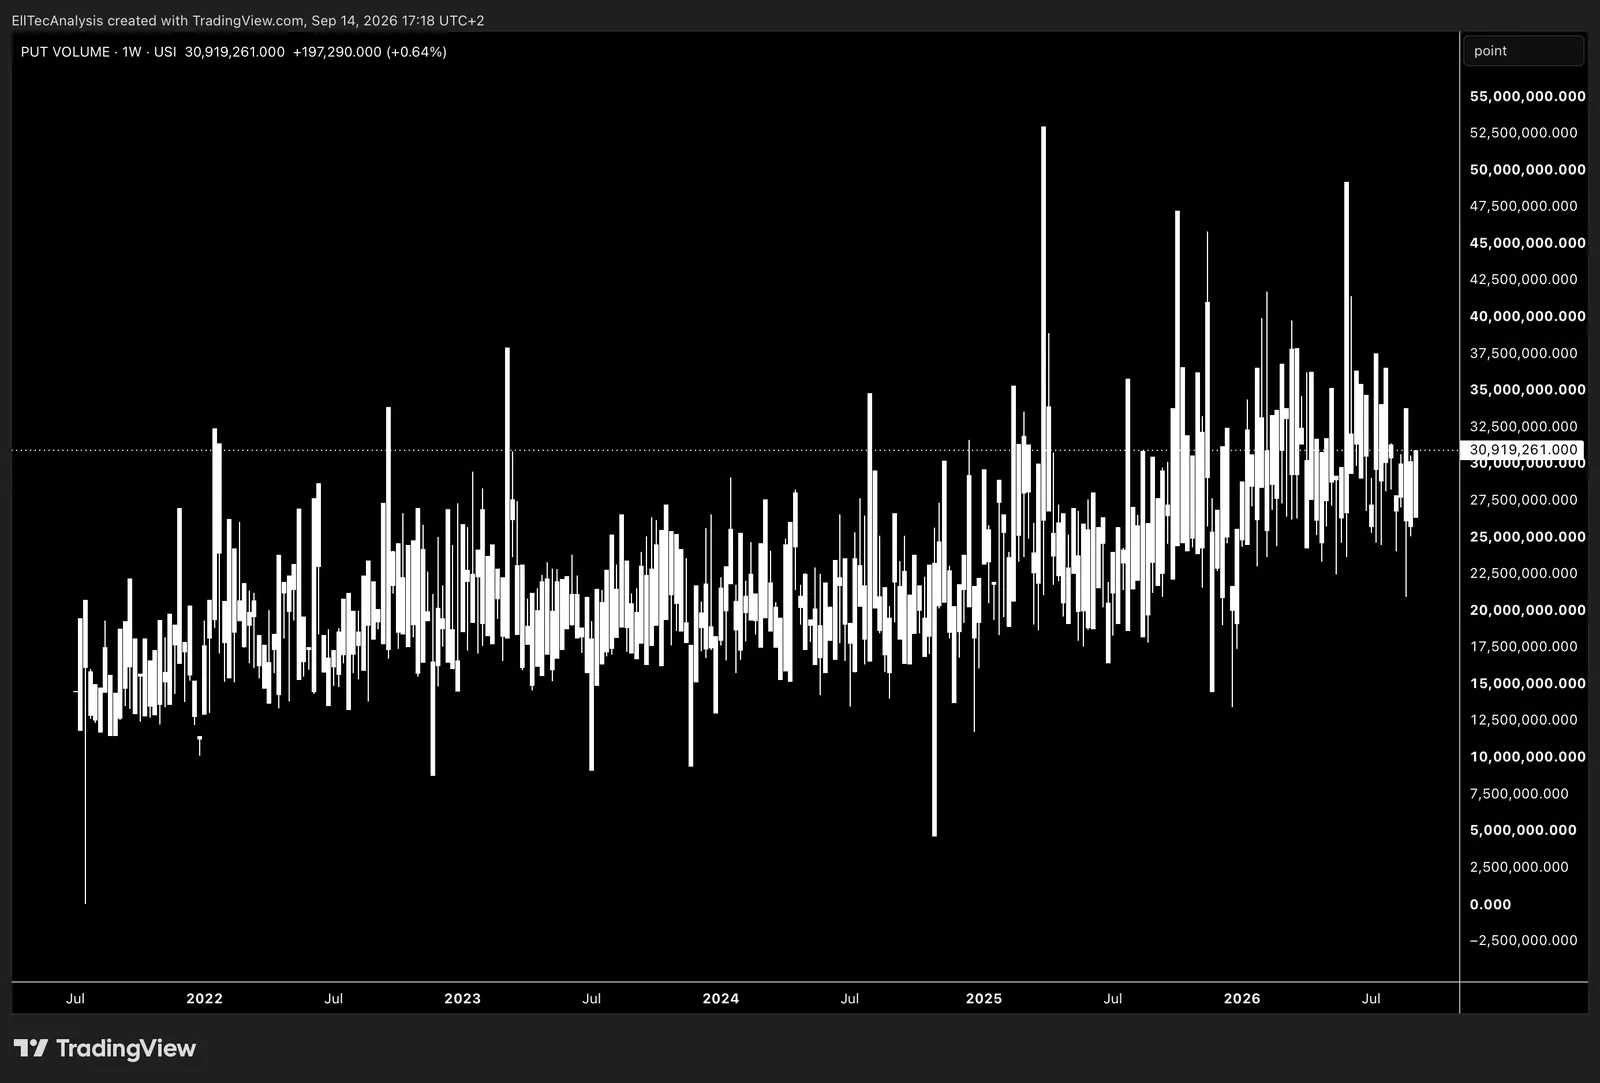
Shows how Put Volume; the total number of put‑option contracts traded across equities, indices, or ETFs; has moved over time, offering a clear view of how traders shift toward downside protection, hedging activity, and risk‑off positioning, and how macro conditions, liquidity regimes, and volatility cycles influence demand for leveraged bearish exposure.
Housing
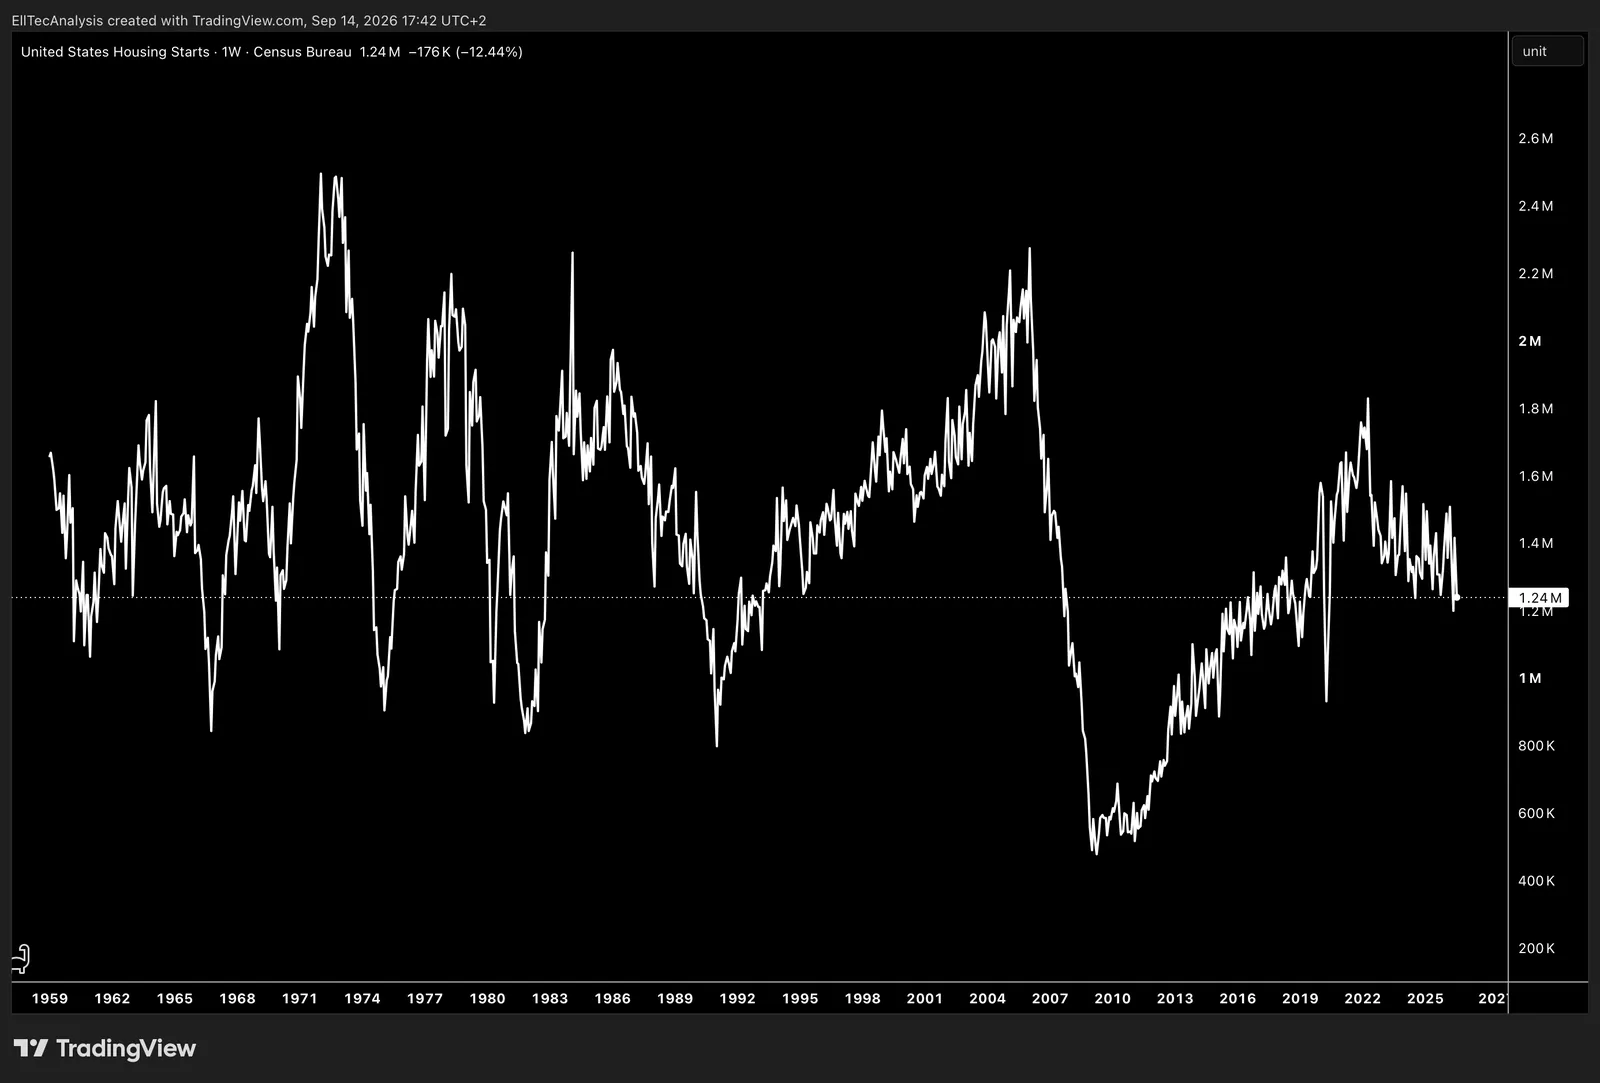
Shows how US Housing Starts, the number of new residential construction projects that begin each month, has moved over time, offering a clear view of how homebuilding activity responds to interest‑rate cycles, credit conditions, demographic demand, and broader macro trends, and how shifts in construction momentum signal turning points in the U.S. housing market and economic growth.
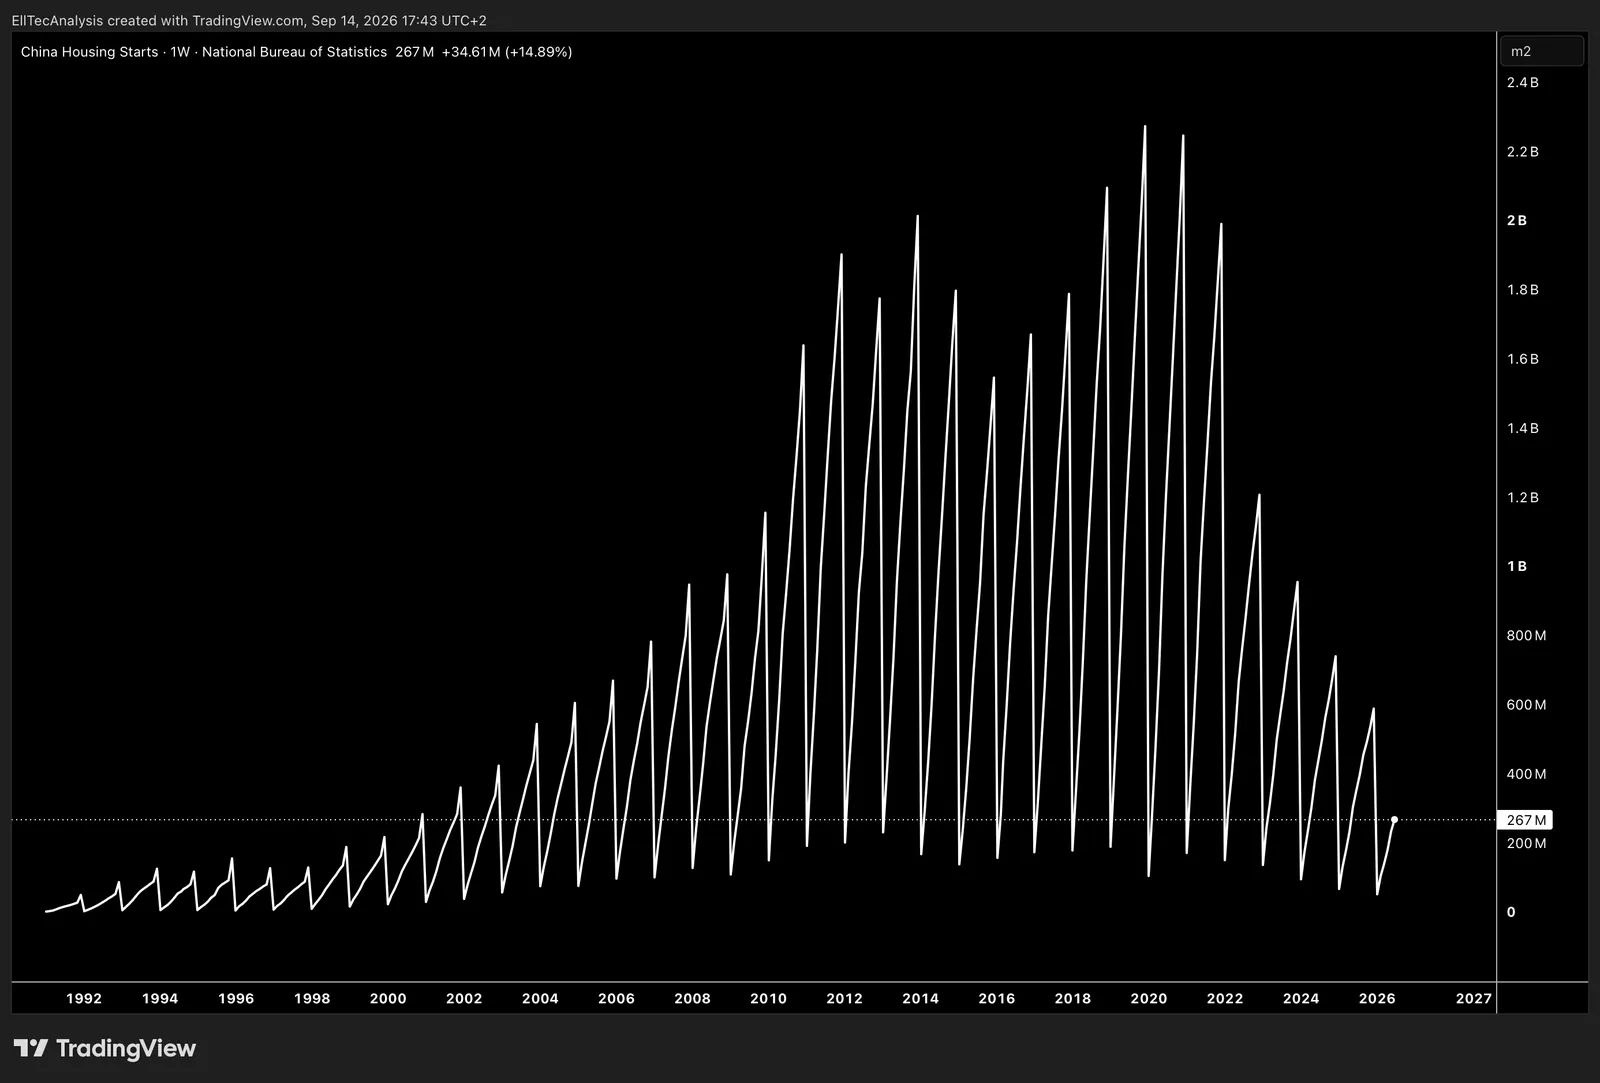
Shows how China Housing Starts, the number of newly initiated residential construction projects across China’s vast property market, has moved over time, offering a clear view of how developer activity responds to credit conditions, policy tightening or easing, demographic shifts, and the broader structural slowdown in China’s real‑estate sector. It highlights how construction momentum reflects liquidity stress among developers, confidence levels among households, and the macro transition from property‑driven growth toward alternative economic engines.
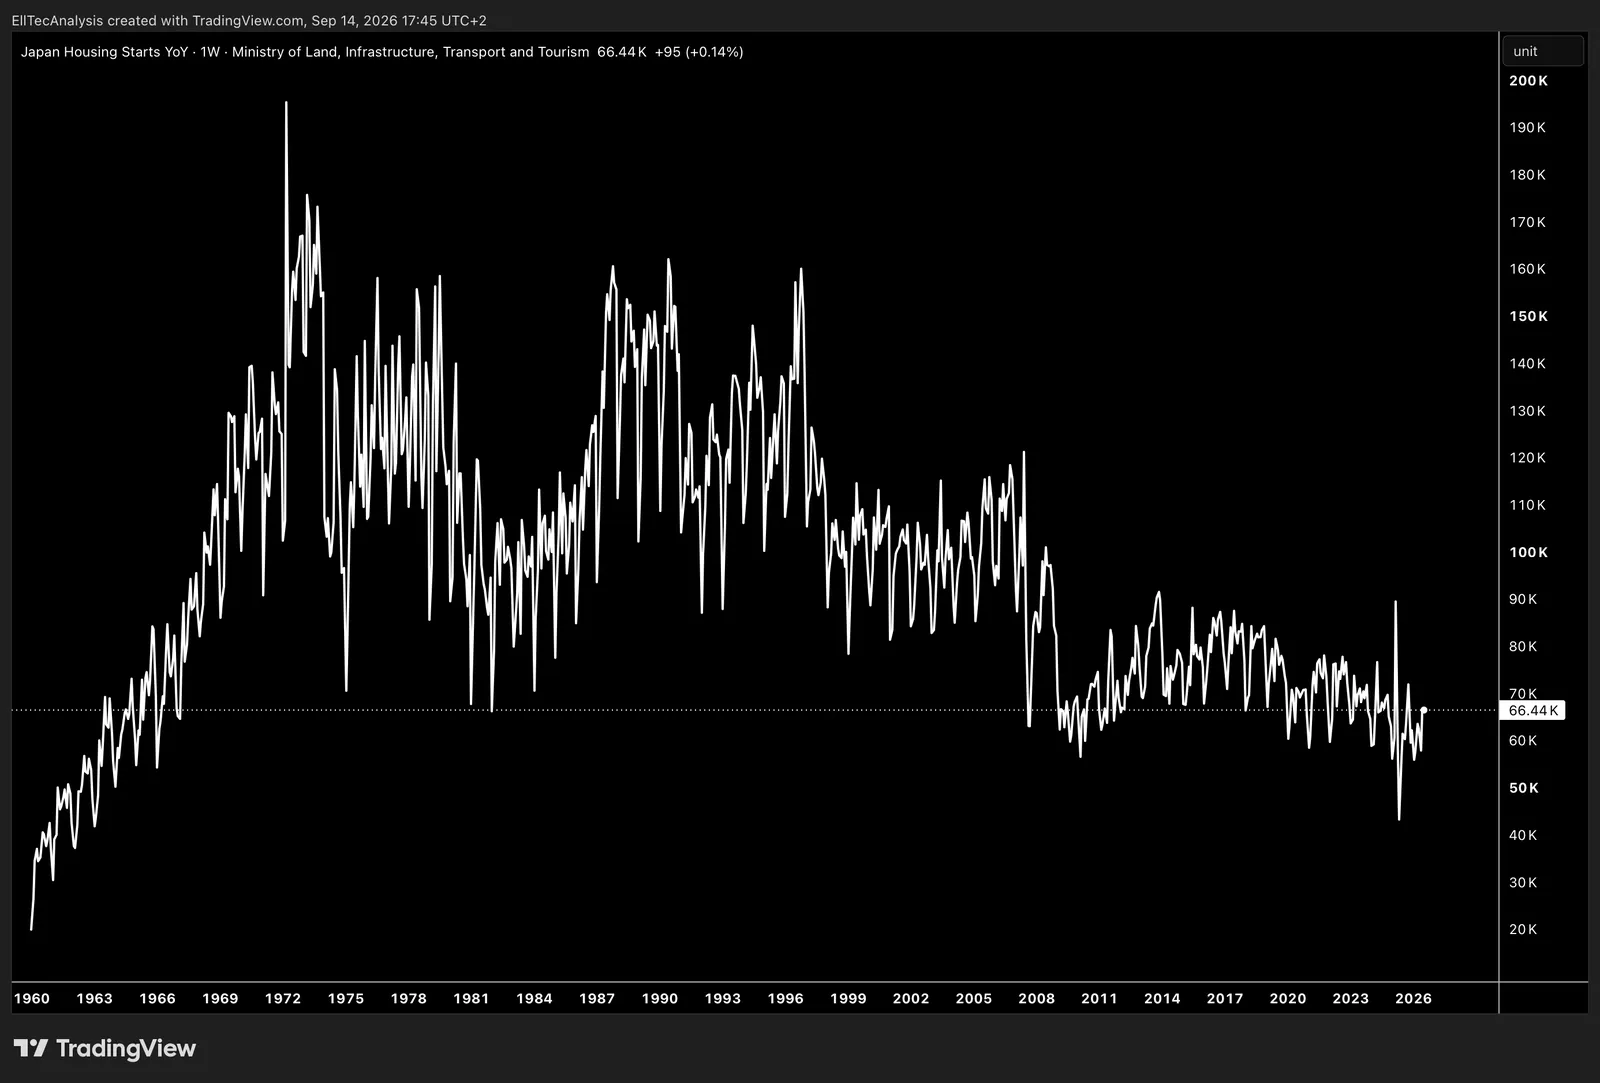
Shows how Japan Housing Starts, the number of newly initiated residential construction projects across Japan’s housing market, has moved over time, offering a clear view of how demographic trends, interest‑rate policy, household confidence, and regional economic conditions shape construction momentum in a country facing long‑term population decline and structurally subdued housing demand.
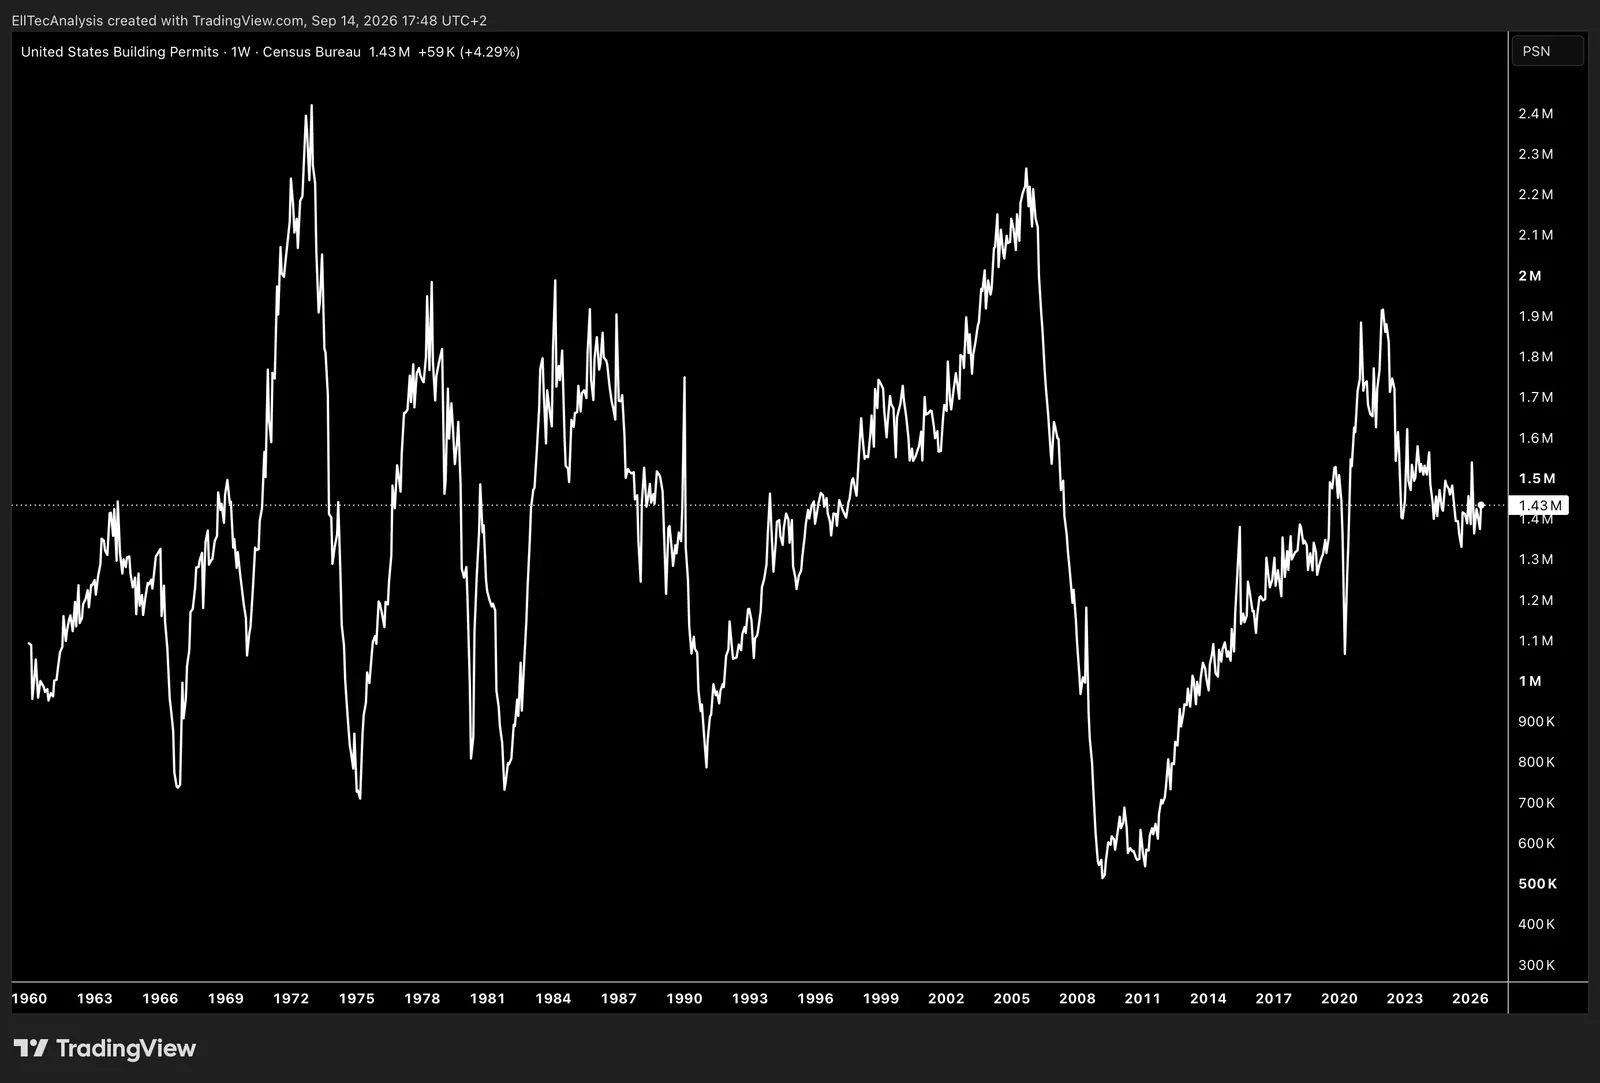
Shows how United States Building Permits; the number of new residential construction authorizations issued each month; has moved over time, offering a clear view of how forward‑looking housing activity responds to interest‑rate cycles, credit conditions, household formation, and broader macro trends. Because permits lead housing starts, shifts in permit momentum often signal upcoming inflection points in U.S. homebuilding and economic growth.
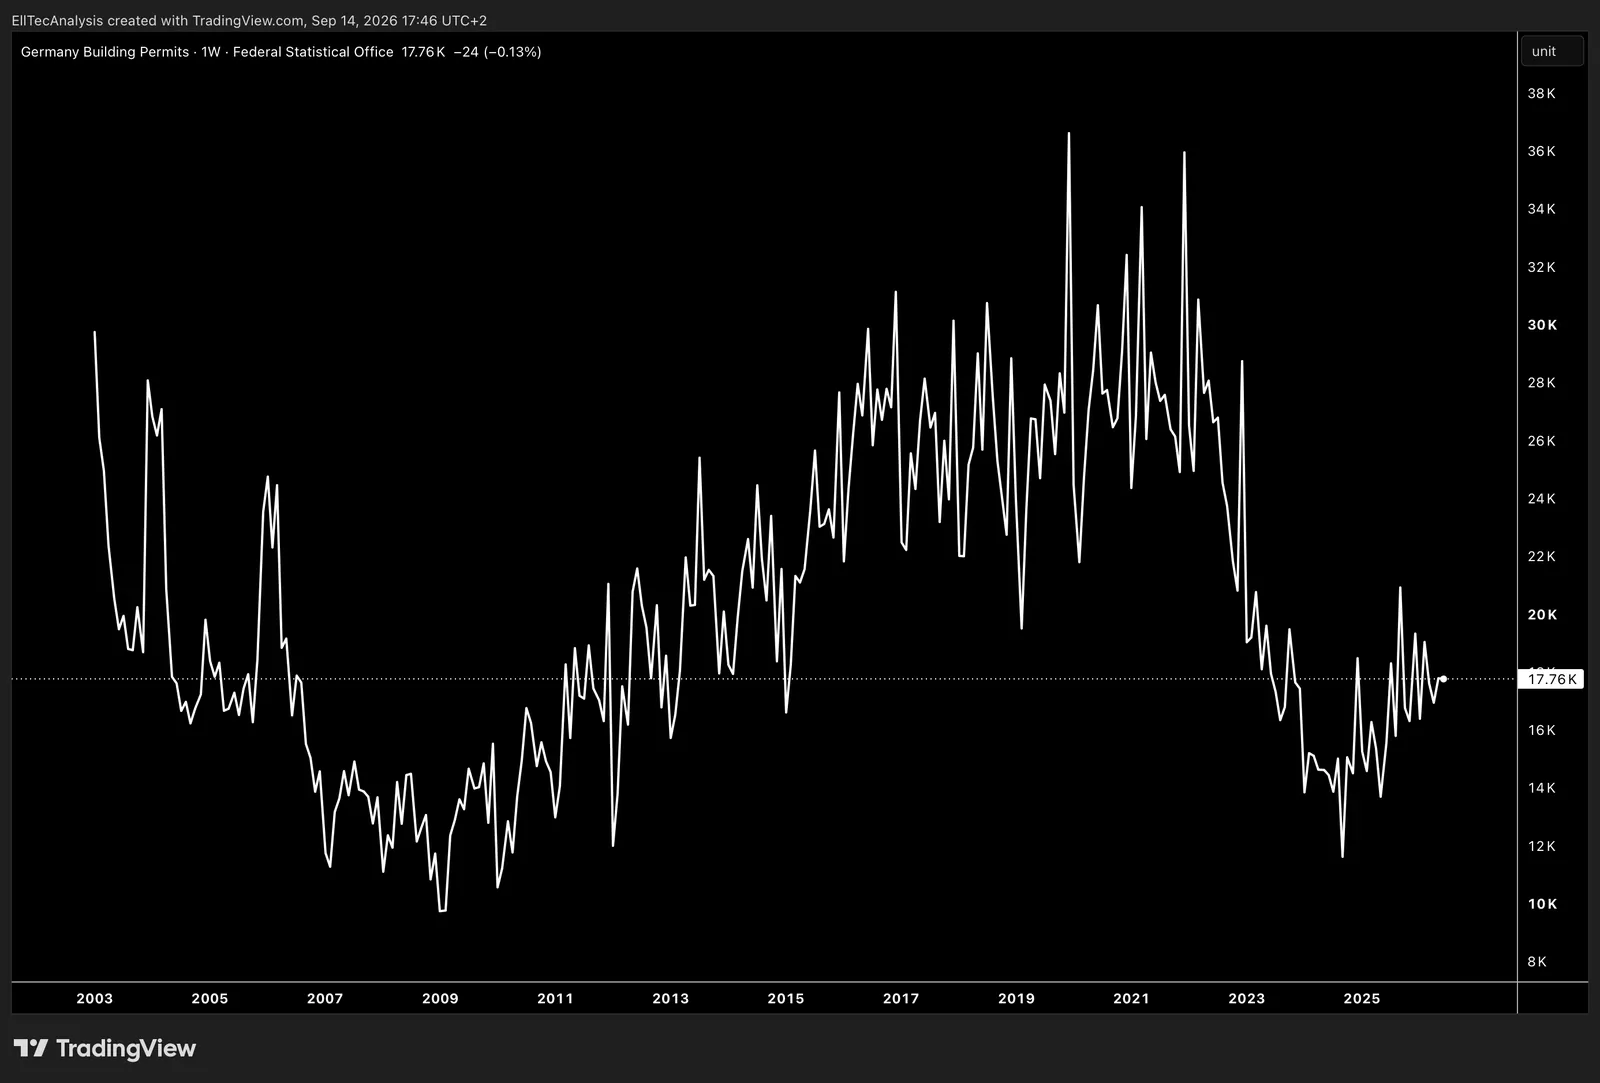
Shows how Germany Building Permits; the number of approved residential construction projects across Germany; has moved over time, offering a clear view of how homebuilding sentiment responds to interest‑rate cycles, construction‑sector costs, regulatory constraints, and demographic pressures. It highlights how Germany’s structurally tight housing supply, regional permitting bottlenecks, and shifting demand patterns shape forward‑looking construction momentum within Europe’s largest economy.
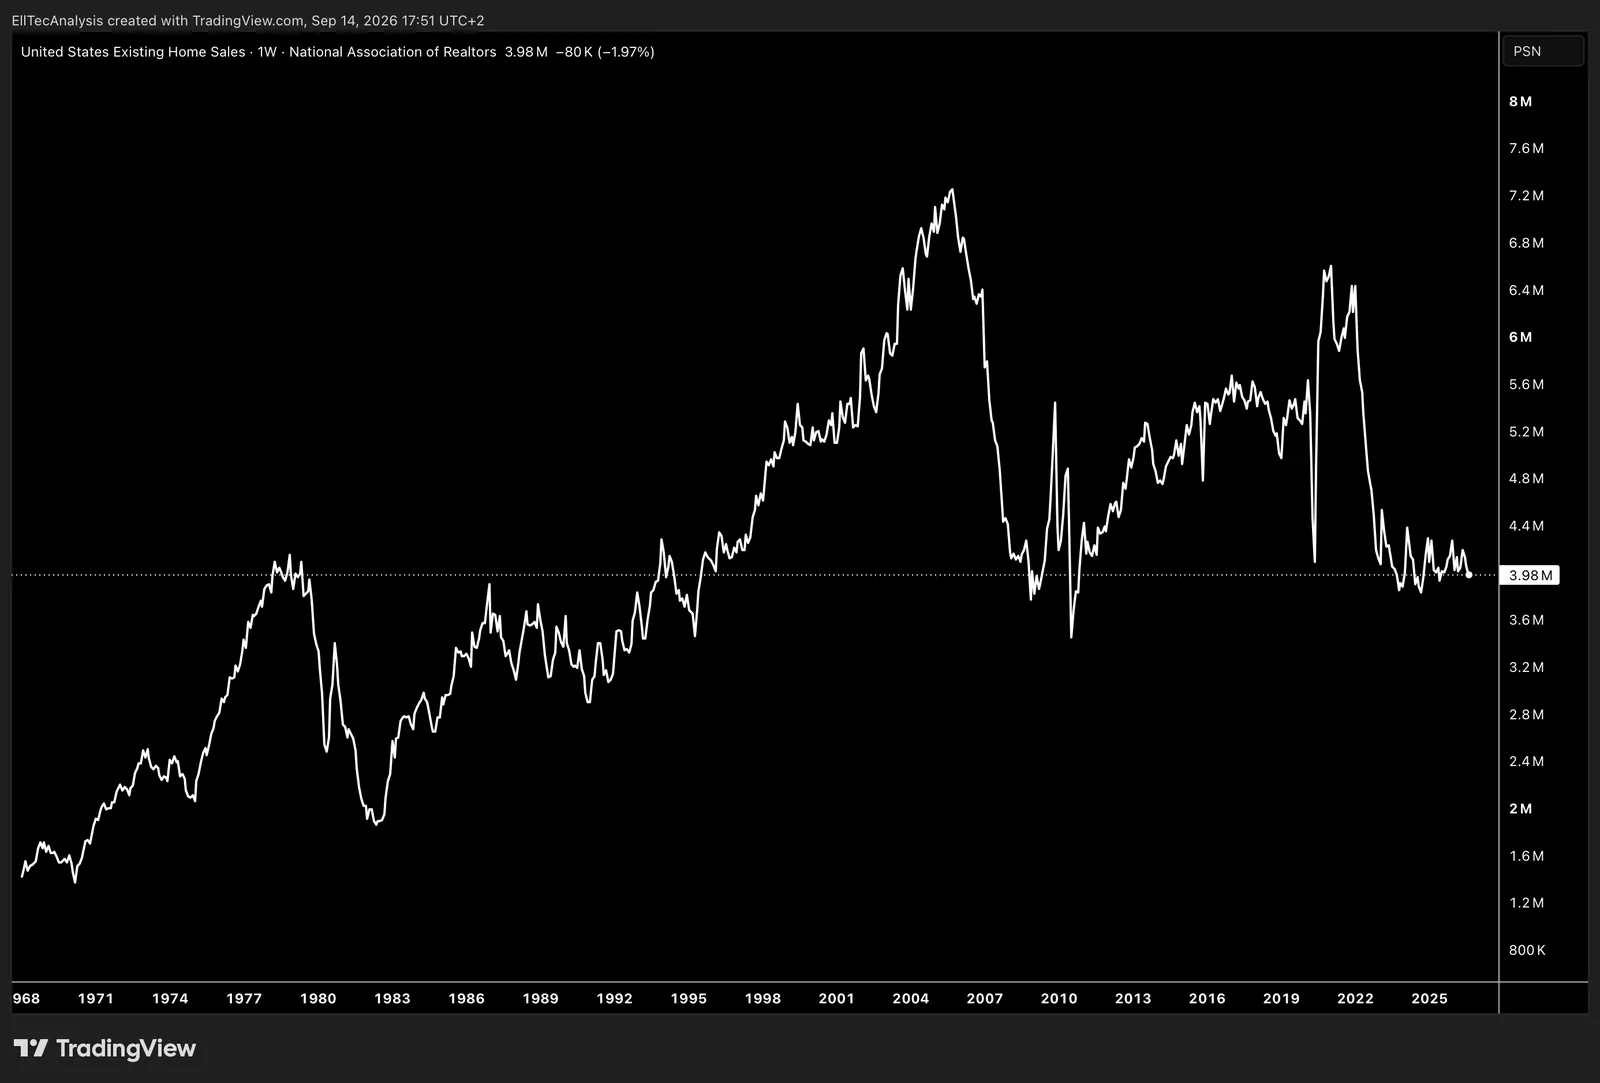
Shows how US Existing Home Sales; the number of completed transactions for previously owned homes; has moved over time, offering a clear view of how housing‑market demand responds to mortgage‑rate cycles, affordability constraints, inventory shortages, and broader macro conditions. Because existing homes make up the majority of U.S. housing transactions, shifts in sales momentum often signal turning points in household confidence, credit availability, and overall housing‑market health.
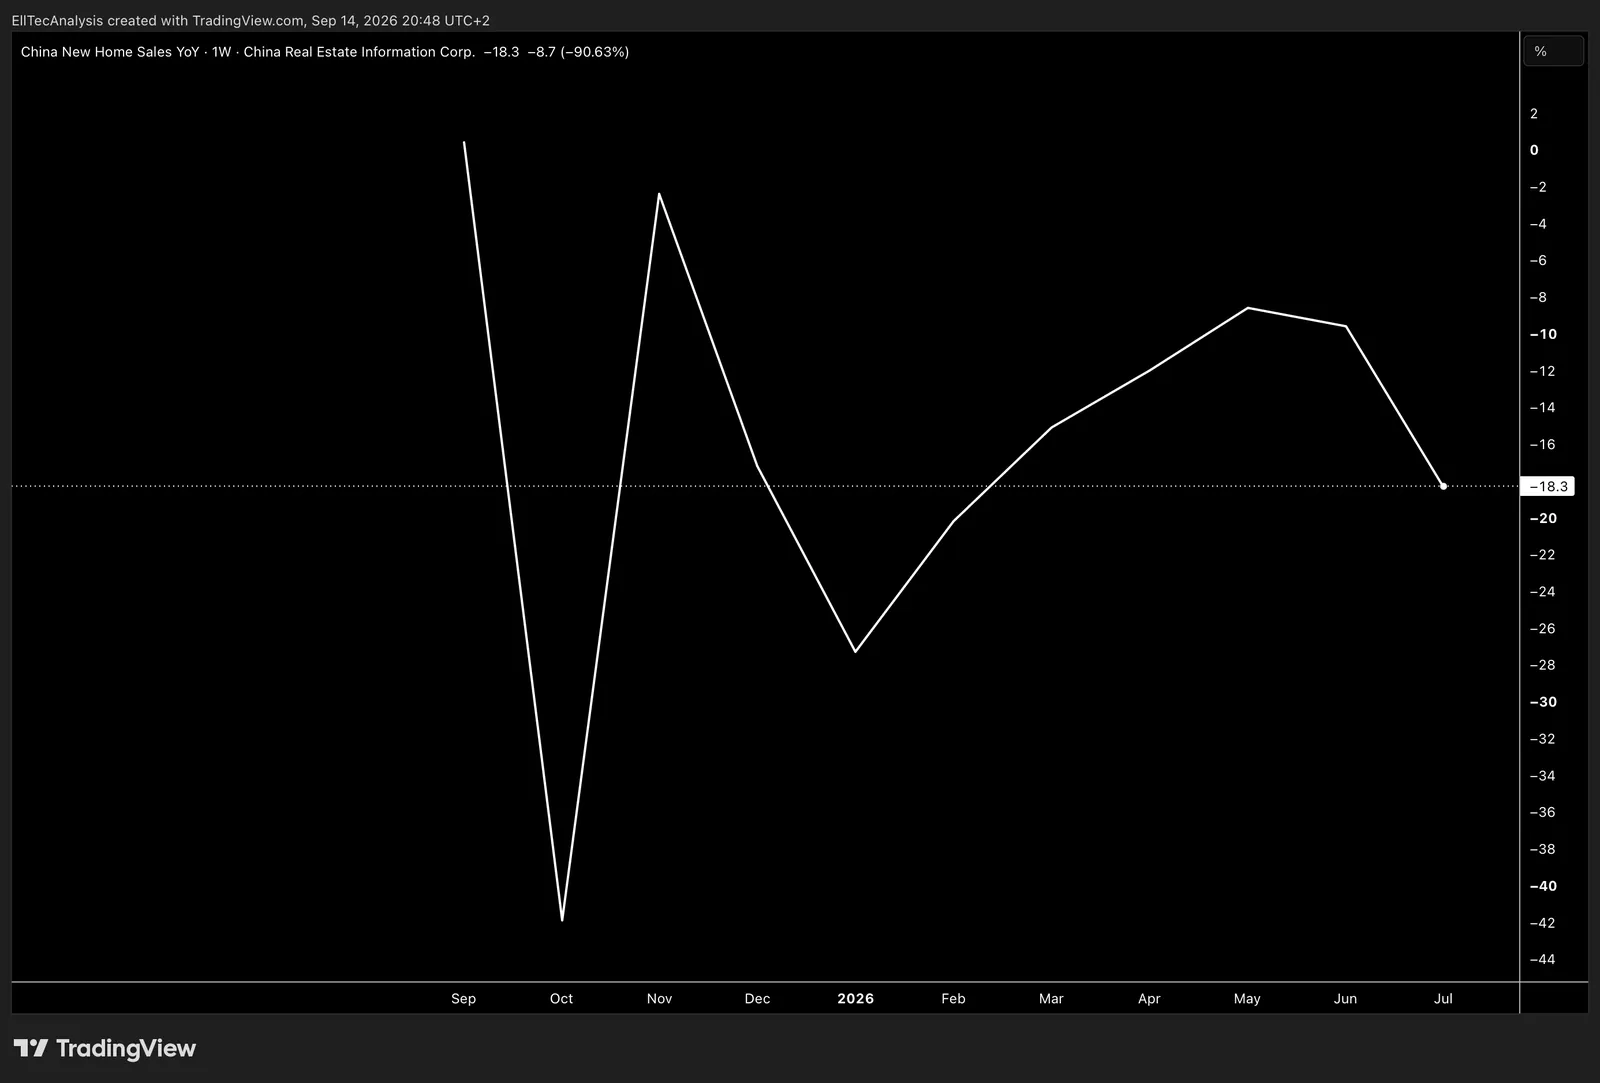
Shows how China New Home Sales YoY; the year‑over‑year change in newly sold residential units across China’s property market; has moved over time, offering a clear view of how demand for new housing responds to credit conditions, mortgage‑rate policy, household confidence, developer liquidity stress, and the broader structural slowdown in China’s real‑estate sector. It highlights how YoY swings in new‑home sales often act as a leading indicator for construction activity, developer cash flow, and macro stabilization efforts.
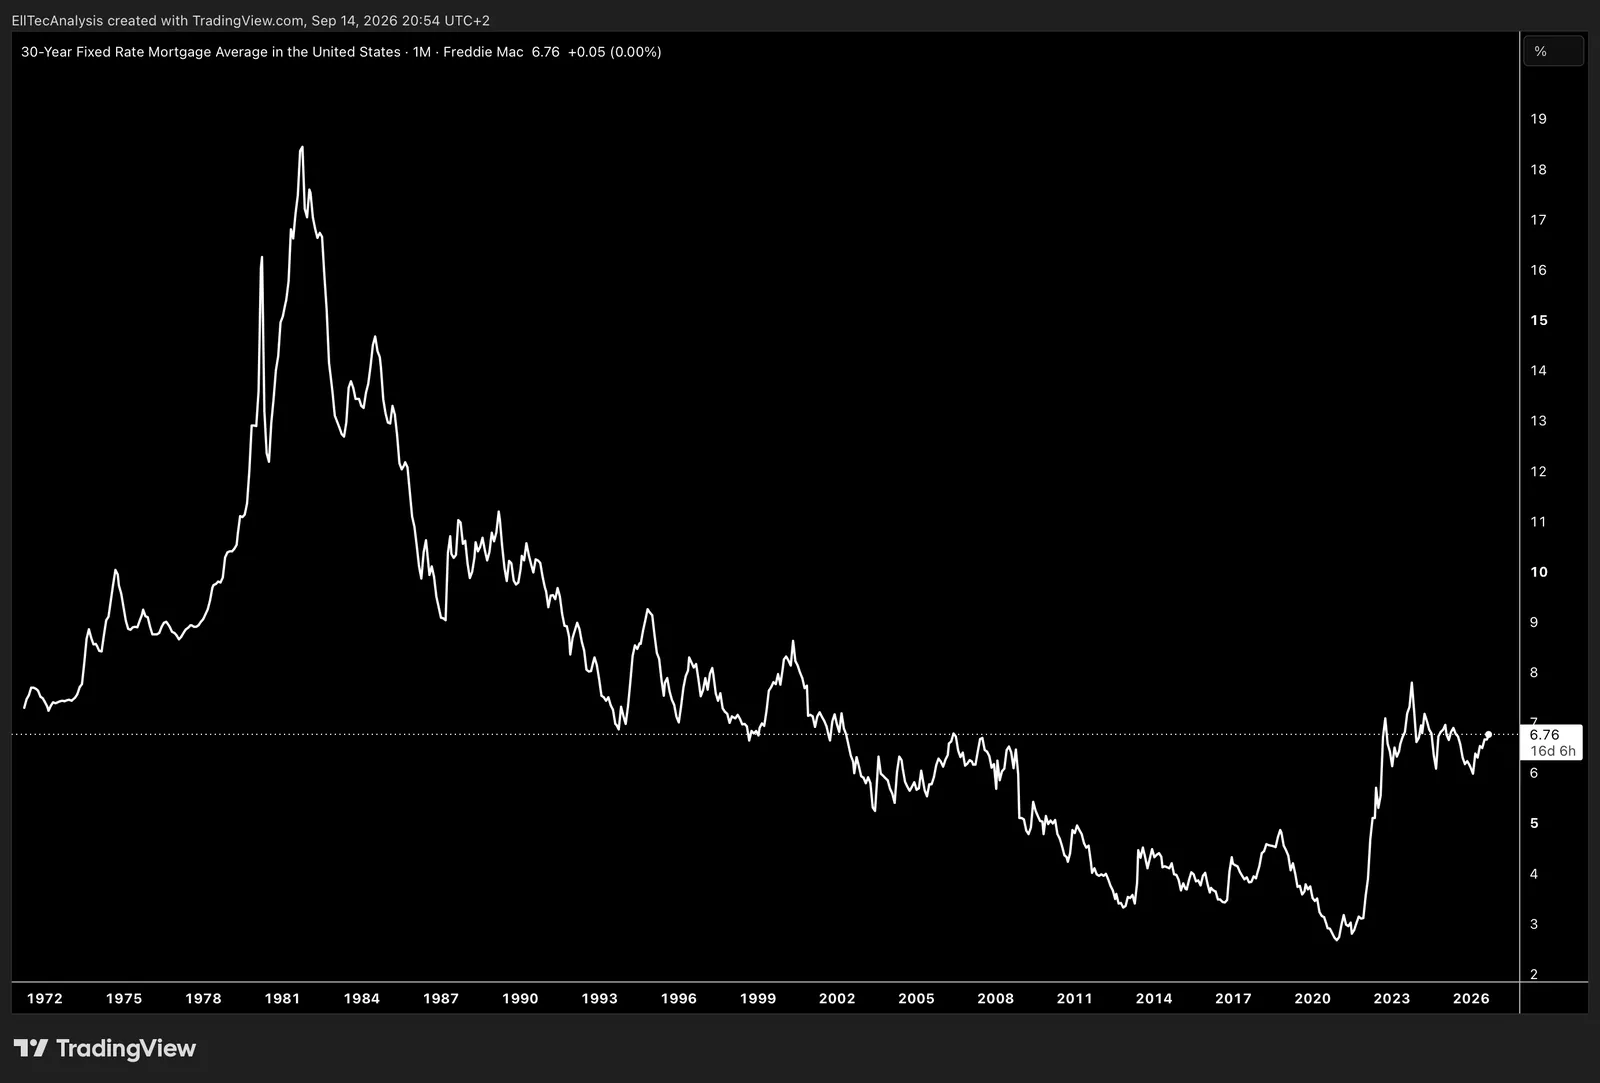
Shows how the US 30‑Year Fixed Rate Mortgage Average, the benchmark long‑term mortgage rate tracked weekly by Freddie Mac, has moved over time, offering a clear view of how Federal Reserve policy, Treasury‑market yields, inflation expectations, and credit‑market liquidity shape the cost of long‑duration household borrowing. Because the 30‑year rate anchors US housing affordability, shifts in this series often signal turning points in homebuyer demand, refinancing activity, and broader housing‑market momentum.
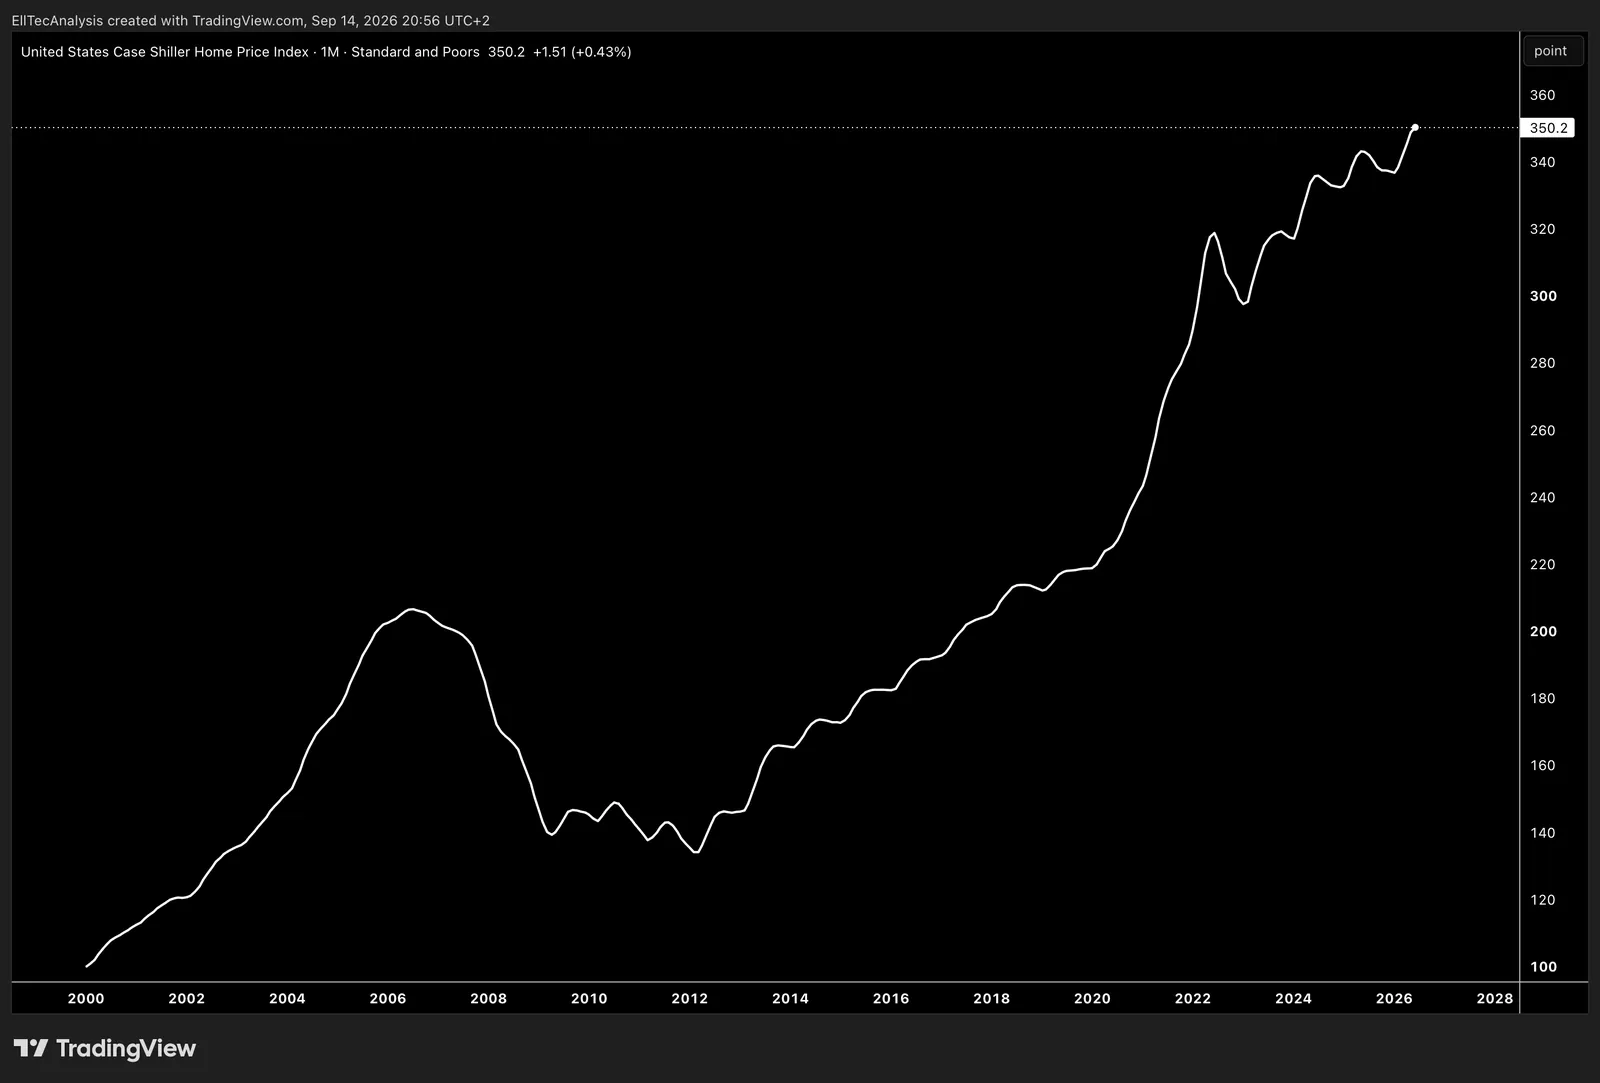
Shows how the US Case‑Shiller Home Price Index; the leading measure of repeat‑sales home‑price appreciation across major US metropolitan areas; has moved over time, offering a clear view of how housing‑market valuations respond to mortgage‑rate cycles, supply constraints, demographic demand, and broader macro conditions. Because Case‑Shiller tracks actual resale price changes rather than listing prices, shifts in this index often signal turning points in real housing‑market momentum, household wealth effects, and the durability of U.S. home‑price inflation.
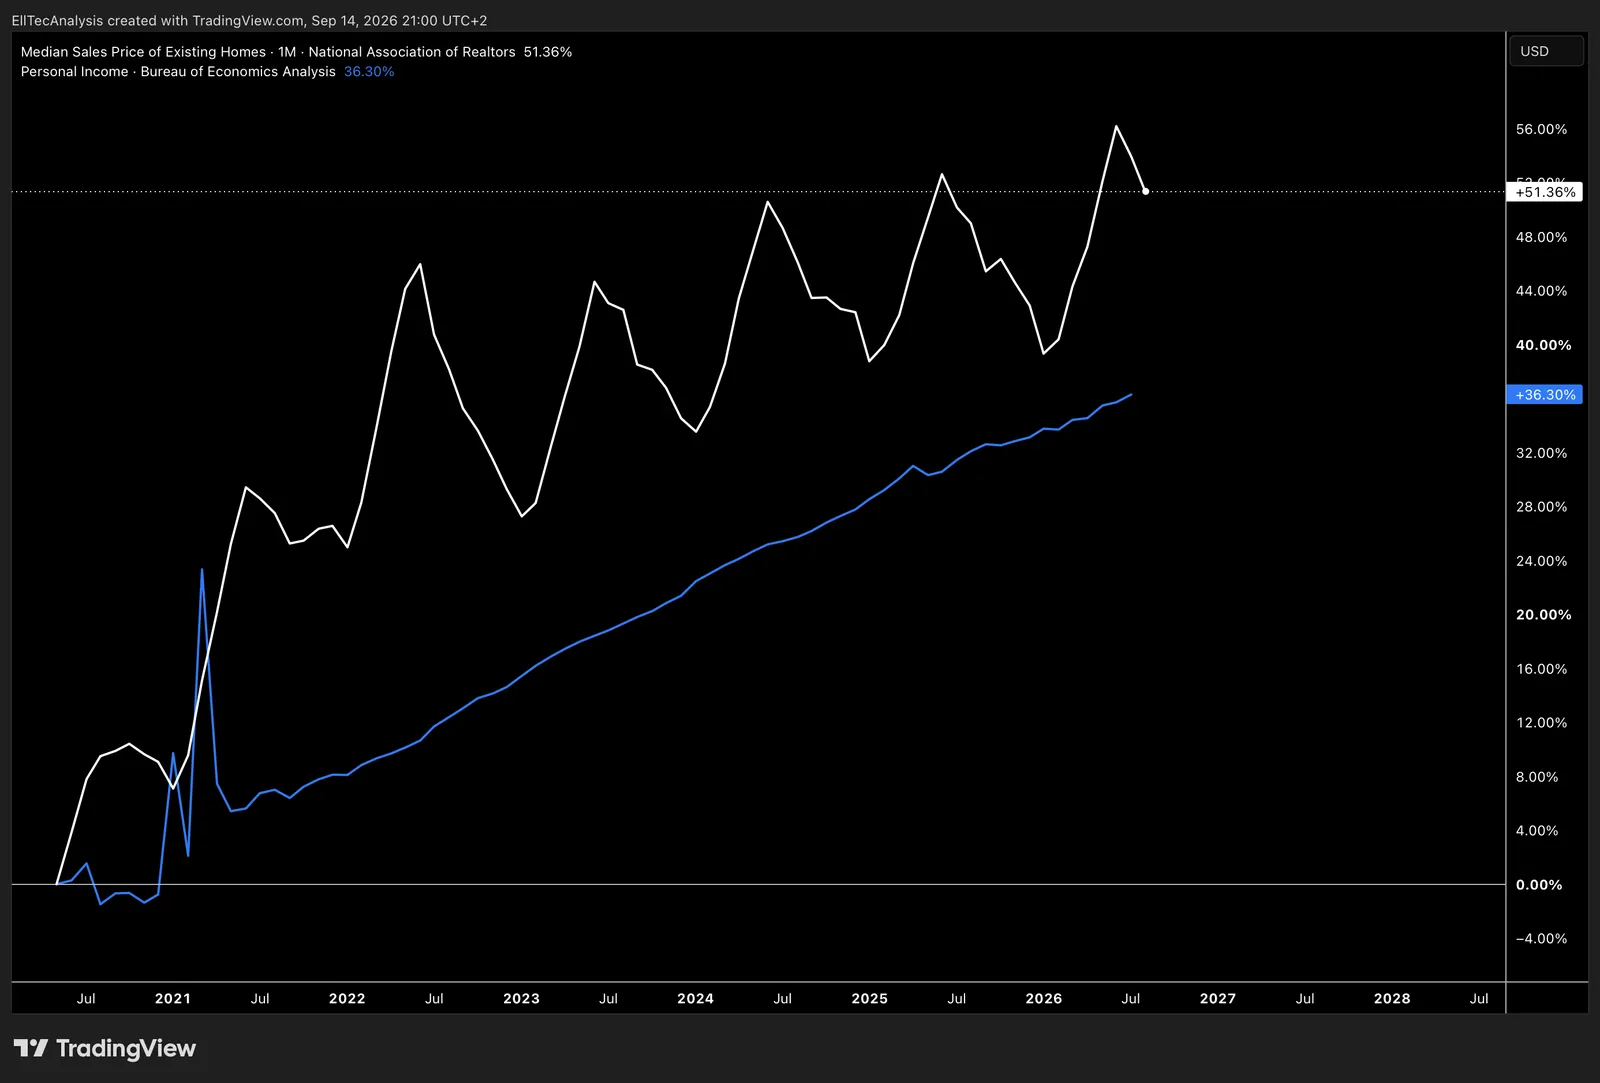
Shows how Median Sales Price of Existing Homes / Personal Income has moved over time, offering a clear view of how US housing affordability shifts as home prices rise faster or slower than household income. Changes in this ratio often mark turning points in purchasing power, credit stress and overall housing‑market accessibility.
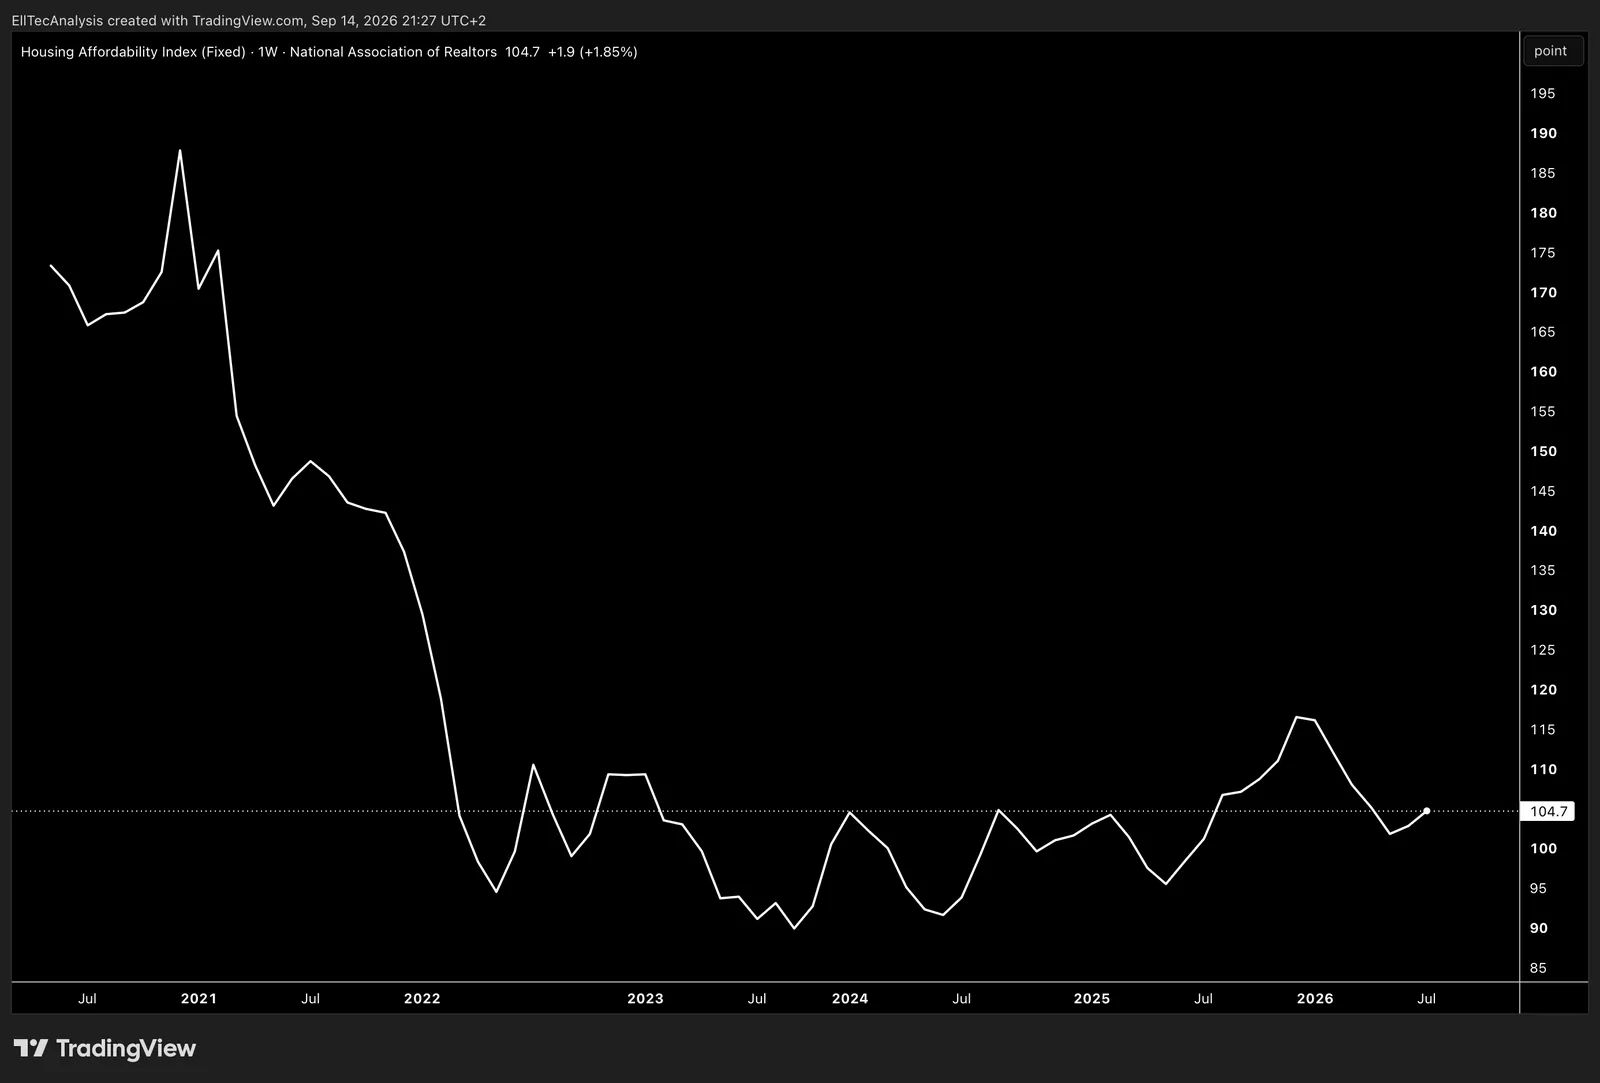
Shows how the US Housing Affordability Index has moved over time, offering a clear view of how easily households can purchase a median‑priced home based on prevailing mortgage rates and income levels. When the index falls, affordability deteriorates; when it rises, purchasing power improves; making it a key gauge of stress or relief in the U.S. housing market.
Conclusion
All of those charts can be used as indications for future outlooks. In EllTec Analysis opinion those are all the important charts Investors need to know. If charts are missing feel free to tell EllTec Analysis
Disclaimer
This analysis is for informational purposes only and does not constitute financial advice. All information is provided without guarantee. Markets involve risks, and past performance is not indicative of future results. Please do your own research or consult a licensed advisor. EllTec Analysis assumes no liability for decisions based on this content.